|
|
|


MIRA INFORM REPORT
|
Report No. : |
486665 |
|
Report Date : |
16.01.2018 |
IDENTIFICATION DETAILS
|
Name : |
BOMBAY RAYON FASHIONS LIMITED (w. e. f. 30.09.2004) |
|
|
|
|
Formerly Known
As : |
MUDRA FABRICS LIMITED (w. e. f. 13.10.1992) MUDRA FABRICS PRIVATE LIMITED |
|
|
|
|
Registered
Office : |
D 1st Floor, Oberoi Garden Estates, Chandivali Farms Road, Chandivali, Andheri (East), Mumbai – 400072, Maharashtra |
|
Tel. No.: |
91-22-39858800 |
|
|
|
|
Country : |
India |
|
|
|
|
Financials (as
on) : |
31.03.2017 |
|
|
|
|
Date of
Incorporation : |
21.05.1992 |
|
|
|
|
Com. Reg. No.: |
11-066880 |
|
|
|
|
Capital
Investment / Paid-up Capital : |
INR 1859.900 Million |
|
|
|
|
CIN No.: [Company Identification
No.] |
L17120MH1992PLC066880 |
|
|
|
|
IEC No.: |
0399028358 |
|
|
|
|
GSTIN : |
Not Divulged |
|
|
|
|
TAN No.: [Tax Deduction &
Collection Account No.] |
Not Available |
|
|
|
|
PAN No.: [Permanent Account No.] |
AAACM3447J |
|
|
|
|
Legal Form : |
A Public Limited Liability Company. The Company’s Shares are Listed on
the Stock Exchanges |
|
|
|
|
Line of Business
: |
The Company is mainly engaged in the business of manufacturing of textiles consisting of yarn, fabrics and garments. [Registered Activity] |
|
|
|
|
No. of Employees
: |
14720 (Approximately) |
RATING & COMMENTS
(Mira Inform has adopted New Rating mechanism w.e.f. 23rd
January 2017)
|
MIRA’s Rating : |
A |
|
Credit Rating |
Explanation |
Rating Comments |
|
A |
Acceptable Risk |
Business dealings permissible with
moderate risk of default |
|
Status : |
Satisfactory |
|
|
|
|
Payment Behaviour : |
Slow But Correct |
|
|
|
|
Litigation : |
Clear |
|
|
|
|
Comments : |
Subject was incorporated in 1992 and is based in Mumbai, Maharashtra.
The company is engaged in manufacturing, exporting and retailing of fabrics
and garments. The company has sound financial base marked by healthy networth
profile along with average debt balance sheet. Rating also takes into account of experience of its promoters,
established track record of business operations and market position. However, rating strength is partially offset by deterioration in the revenue
profile and loss incurred during the year. Trade relations are reported as fair. Business is active. Payments are
slow but correct. The company can be considered for business dealings at usual trade
terms and condition. |
NOTES :
Any query related to this report can be made
on e-mail : infodept@mirainform.com
while quoting report number, name and date.
ECGC Country Risk Classification List
|
Country Name |
Previous Rating (30.06.2017) |
Current Rating (30.09.2017) |
|
India |
A1 |
A1 |
|
Risk Category |
ECGC
Classification |
|
Insignificant |
A1 |
|
Low Risk |
A2 |
|
Moderately Low Risk |
B1 |
|
Moderate Risk |
B2 |
|
Moderately High Risk |
C1 |
|
High Risk |
C2 |
|
Very High Risk |
D |
EXTERNAL AGENCY RATING
NOT AVAILABLE
RBI DEFAULTERS’ LIST STATUS
Subject’s name is not enlisted as a defaulter
in the publicly available RBI Defaulters’ list.
EPF (Employee Provident Fund) DEFAULTERS’ LIST STATUS
Subject’s name is not enlisted as a defaulter
in the publicly available EPF (Employee Provident Fund) Defaulters’ list as of
31-03-2016.
BIFR (Board for Industrial & Financial Reconstruction) LISTING
STATUS
Subject’s name is not listed as a Sick Unit in
the publicly available BIFR (Board for Industrial & Financial
Reconstruction) list as of 16.01.2018.
IBBI (Insolvency and Bankruptcy Board of India) LISTING STATUS
Subject’s name is not listed in the publicly
available IBBI (Insolvency and Bankruptcy Board of India) list as of report
date.
INFORMATION DENIED BY
|
Name : |
Mr. Ramchandra |
|
Designation : |
Assistant Manager |
|
Contact No.: |
91-9833818814 |
Management Non-Cooperative (Tel. No.:
91-22-61068800)
LOCATIONS
|
Registered Office/Factory : |
D 1st Floor, Oberoi Garden Estates, Chandivali Farms Road, Chandivali, Andheri (East), Mumbai – 400072, Maharashtra, India |
|
Tel. No.: |
91-22-39858800/61068800 |
|
Fax No.: |
91-22-39858700 |
|
E-Mail : |
|
|
Website : |
|
|
|
|
|
Bangalore Office/
Head Office : |
KIADB Apparel Park, Near Railway Station, Doddaballapur, Bangalore – 561203, Karnataka, India |
|
Tel. No.: |
91-80-30940000 |
|
Fax No.: |
91-80-30940111 |
|
|
|
|
Sales Marketing Office : |
D 6th Floor, Oberoi Garden Estates, Chandivali Farms Road, Chandivali, Andheri (East), Mumbai – 400072, Maharashtra, India |
|
|
|
|
Factory Location : |
Weaving and Yarn
Dyeing
Processing
Garmenting
|
DIRECTORS
AS ON 31.03.2017
|
Name : |
Mr. Janardhan Biseshwarlal Agrawal |
|
Designation : |
Chairman |
|
Address : |
Flat No. 602, 6th Floor, Daffodil, N S Road No. 7, J V P D Scheme, Vile Parle, Mumbai – 400049, Maharashtra, India |
|
Date of Birth/Age : |
68 Years |
|
Qualification : |
B. Com |
|
Date of Appointment : |
24.08.1992 |
|
DIN No.: |
00019497 |
|
|
|
|
Name : |
Mr. Aman Janardhan Agarwal |
|
Designation : |
Vice Chairman |
|
Address : |
902, 9 JVPD Building NS Road No.10, JVPD Juhu, Vile Parle (West), Mumbai – 400049, Maharashtra, India |
|
Date of Appointment : |
31.01.2003 |
|
DIN No.: |
00019534 |
|
|
|
|
Name : |
Mr. Naseer Ahmed |
|
Designation : |
Joint Vice Chairman |
|
Address : |
391, 2nd Main, 2nd Cross, 2nd Phase, 80 Feet Road, R M V Extension, Bangalore – 560094, Karnataka, India |
|
Date of Appointment : |
25.07.2005 |
|
DIN No.: |
00027095 |
|
|
|
|
Name : |
Mr. Prashant Janardan Agarwal |
|
Designation : |
Managing Director |
|
Address : |
Flat No. 602, 6th Floor, Daffodil, N S Road No. 7, J V P D Scheme, Vile Parle, Mumbai – 400049, Maharashtra, India |
|
Date of Appointment : |
01.06.2010 |
|
DIN No.: |
00019464 |
|
|
|
|
Name : |
Mr. Asharam Mundra |
|
Designation : |
Whole time Director |
|
Address : |
Flat No. 2603-04, Oberoi Springs CHS, Tower-A, New Link Road, Opposite City Mall, Andheri (West), Mumbai - 400053 Maharashtra , India |
|
Date of Appointment : |
01.06.2010 |
|
DIN No.: |
AACPM5740M |
|
|
|
|
Name : |
Ms. Prachi Amit Deshpande |
|
Designation : |
Whole time Director |
|
Address : |
1802, Beauty Palms, Kolbad Road, Opposite Pratap Cinema, Khopat Thane - 400603 Maharashtra, India |
|
Date of Appointment : |
29.09.2015 |
|
PAN No.: |
AHQPD1979C |
|
DIN No.: |
02975271 |
|
|
|
|
Name : |
Mr. Arunachalam Arumugham |
|
Designation : |
Director |
|
Address : |
121, Udani Layout, Cambridge Road, Ulsoor Bangalore – 560008, Karnataka, India |
|
Date of Appointment : |
22.08.2013 |
|
DIN No.: |
00350163 |
|
|
|
|
Name : |
Mr. Man Mohan Agrawal |
|
Designation : |
Director |
|
Address : |
1204/1205, "C" Wing Tower 1 12th Floor, Ashoka Garden, Sewree, Mumbai - 400015, Maharashtra, India |
|
Date of Appointment : |
15.09.2011 |
|
DIN No.: |
00681433 |
|
|
|
|
Name : |
Mr. Suresh Shankar Vishwasrao |
|
Designation : |
Director |
|
Address : |
B9, Dreams, SBI Staff Housing Society Limited, Babhi, Ram Mandir Road, Off Vasantrao Road, Borivali (West), Mumbai - 400092, Maharashtra, India |
|
Date of Appointment : |
31.03.2009 |
|
DIN No.: |
00837235 |
|
|
|
|
Name : |
Mr. John Mathew |
|
Designation : |
Director |
|
Address : |
1501 Wallace Apartment, Sleater Road, Grant Road, Mumbai – 400007, Maharashtra, India |
|
Date of Appointment : |
29.09.2015 |
|
DIN No.: |
01632626 |
|
|
|
|
Name : |
Mr. Narayanan Raja |
|
Designation : |
Nominee Director |
|
Address : |
C-3, Kinellan Tower, Napensea Road, Mumbai – 400036, Maharashtra, India |
|
Date of Appointment : |
15.02.2016 |
|
DIN No.: |
00503400 |
KEY EXECUTIVES
|
Name : |
Mr. Asharam Mundra |
|
Designation : |
Chief Finance Officer |
|
Address : |
Flat No. 2603-04, Oberoi Springs CHS, Tower-A, New Link Road, Opposite City Mall, Andheri (West), Mumbai – 400053, Maharashtra, India |
|
Date of Appointment : |
30.07.2014 |
|
PAN No.: |
AACPM5740M |
|
|
|
|
Name : |
Ms. Prachi Amit Deshpande |
|
Designation : |
Company Secretary and Compliance officer |
|
Address : |
A - 16, Vandana Society, Opposite Forest Office, L. B. S Marg, Thane – 400602, Maharashtra, India |
|
Date of Appointment : |
01.06.2015 |
|
PAN No.: |
AHQPD1979C |
|
|
|
|
Name : |
Mr. Ramchandra |
|
Designation : |
Assistant Manager |
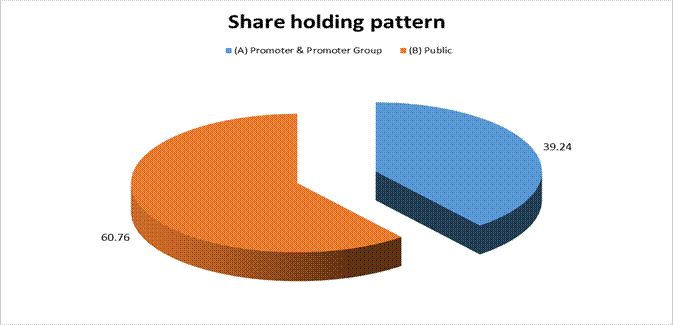
SHAREHOLDING PATTERN
AS ON 03.10.2017
|
Category of shareholder |
Total nos. shares held |
Shareholding as a % of total no. of
shares (calculated as per SCRR, 1957)As a % of (A+B+C2) |
|
|
(A) Promoter & Promoter Group |
124569030 |
39.24 |
|
|
(B) Public |
192907449 |
60.76 |
|
|
Grand Total |
317476479 |
100.00 |
STATEMENT SHOWING SHAREHOLDING PATTERN OF THE PROMOTER AND PROMOTER
GROUP
|
Category of shareholder |
Total nos. shares held |
Shareholding as a % of total no. of shares
(calculated as per SCRR, 1957)As a % of (A+B+C2) |
|
|
A1) Indian |
0.00 |
||
|
Individuals/Hindu undivided Family |
16999626 |
5.35 |
|
|
Janardan Agarwal |
7576140 |
2.39 |
|
|
Prashant Agarwal |
6085082 |
1.92 |
|
|
Aman Agarwal |
3338404 |
1.05 |
|
|
Any Other (specify) |
56569004 |
17.82 |
|
|
Vinita Agarwal |
3815980 |
1.20 |
|
|
Bimladevi Agarwal |
413200 |
0.13 |
|
|
Vedant Aman Agarwal |
320000 |
0.10 |
|
|
Payal Chaudhary |
179300 |
0.06 |
|
|
Janardhan Biseshwarlal Agarwal |
156000 |
0.05 |
|
|
Aayush Prashant Agarwal |
120000 |
0.04 |
|
|
Sushila Mukesh Agarwal |
100000 |
0.03 |
|
|
Priyanka Agarwal |
44200 |
0.01 |
|
|
Ashwell Holding Company Private Limited |
28420000 |
8.95 |
|
|
Reynold Shirting Limited |
13215714 |
4.16 |
|
|
Bombay Rayon Clothing Limited |
7284610 |
2.29 |
|
|
B.R. Machine Tools Private Limited |
2500000 |
0.79 |
|
|
Sub Total A1 |
73568630 |
23.17 |
|
|
A2) Foreign |
0.00 |
||
|
Any Other (specify) |
51000400 |
16.06 |
|
|
AAA United B V |
51000400 |
16.06 |
|
|
Sub Total A2 |
51000400 |
16.06 |
|
|
A=A1+A2 |
124569030 |
39.24 |
STATEMENT SHOWING SHAREHOLDING PATTERN OF THE PUBLIC SHAREHOLDER
|
Category & Name of the Shareholders |
Total no. shares held |
Shareholding % calculated as per SCRR,
1957 As a % of (A+B+C2) |
|
|
B1) Institutions |
0.00 |
||
|
Foreign Portfolio Investors |
227834 |
0.07 |
|
|
Financial Institutions/ Banks |
182937103 |
57.62 |
|
|
State Bank Of India |
86246950 |
27.17 |
|
|
Axis Bank Limited |
25520484 |
8.04 |
|
|
Union Bank of India |
10628614 |
3.35 |
|
|
Standard Chartered Bank |
8138888 |
2.56 |
|
|
Export-Import Bank of India |
7316189 |
2.30 |
|
|
Bank of India |
7032830 |
2.22 |
|
|
Punjab National Bank |
6967184 |
2.19 |
|
|
Central Bank Of India |
5642459 |
1.78 |
|
|
Allahabad Bank |
5111680 |
1.61 |
|
|
State Bank Of India |
3188449 |
1.00 |
|
|
Sub Total B1 |
183164937 |
57.69 |
|
|
B2) Central Government/ State Government(s)/ President of India |
0.00 |
||
|
Central Government/ State Government(s)/ President of India |
10 |
0.00 |
|
|
Sub Total B2 |
10 |
0.00 |
|
|
B3) Non-Institutions |
0.00 |
||
|
Individual share capital upto INR 0.200 Million |
1322904 |
0.42 |
|
|
Individual share capital in excess of INR 0.200 Million |
1434345 |
0.45 |
|
|
Any Other (specify) |
6985253 |
2.20 |
|
|
Foreign Individuals |
1500 |
0.00 |
|
|
HUF |
178082 |
0.06 |
|
|
NRI – Non- Repat |
5612 |
0.00 |
|
|
Other Directors |
75 |
0.00 |
|
|
NRI – Repat |
79265 |
0.02 |
|
|
Clearing Members |
996382 |
0.31 |
|
|
Bodies Corporate |
5724337 |
1.80 |
|
|
Sub Total B3 |
9742502 |
3.07 |
|
|
B=B1+B2+B3 |
192907449 |
60.76 |
BUSINESS DETAILS
|
Line of Business : |
The Company is mainly engaged in the business of manufacturing of textiles consisting of yarn, fabrics and garments. [Registered Activity] |
||||
|
|
|
||||
|
Products / Services
: |
|
||||
|
|
|
||||
|
Brand Names : |
Not Available |
||||
|
|
|
||||
|
Agencies Held : |
Not Available |
||||
|
|
|
||||
|
Exports : |
Not Divulged |
||||
|
|
|
||||
|
Imports : |
Not Divulged |
||||
|
|
|
||||
|
Terms : |
Not Divulged |
PRODUCTION STATUS – (NOT AVAILABLE)
GENERAL INFORMATION
|
Suppliers : |
|
||||||||||||||||||||||||||||||
|
|
|
||||||||||||||||||||||||||||||
|
Customers : |
|
||||||||||||||||||||||||||||||
|
|
|
||||||||||||||||||||||||||||||
|
No. of Employees : |
14720 (Approximately) |
||||||||||||||||||||||||||||||
|
|
|
||||||||||||||||||||||||||||||
|
Bankers : |
|
||||||||||||||||||||||||||||||
|
|
|
||||||||||||||||||||||||||||||
|
Facilities : |
|
|
Auditor 1 : |
|
|
Name : |
V. K. Beswal and Associates Chartered Accountants |
|
Address : |
408/410, Rewa Chambers, 31, New Marine Lines, Mumbai-400020,
Maharashtra, India |
|
Tel. No.: |
91-22-43455656 |
|
Fax No.: |
91-22-43455666 |
|
E-Mail : |
|
|
|
|
|
Auditor 2 : |
|
|
Name : |
P R Agarwal and Awasthi Chartered Accountants |
|
Address : |
42, Gopal Bhavan, 199, Princess Street, Mumbai-400002, Maharashtra,
India |
|
Tel. No.: |
91-22-22093908 |
|
Fax No.: |
91-22-22089133 |
|
E-Mail : |
|
|
Website: |
|
|
Membership No.: |
034147 |
|
|
|
|
Memberships : |
Not Available |
|
|
|
|
Collaborators : |
Not Available |
|
|
|
|
Subsidiary
Companies : |
|
|
|
|
|
Other Related Parties : |
|
CAPITAL STRUCTURE
AS ON 31.03.2017
Authorised Capital :
|
No. of Shares |
Type |
Value |
Amount |
|
|
|
|
|
|
200000000 |
Equity Shares |
INR 10/- each |
INR 2000.000 Million |
|
|
|
|
|
Issued Subscribed & Paid-up Capital :
|
No. of Shares |
Type |
Value |
Amount |
|
|
|
|
|
|
185994193 |
Equity Shares |
INR 10/- each |
INR 1859.900 Million |
|
|
|
|
|
Terms/rights attached
to equity shares
The company has only one class of equity shares having par value of INR 10 per share.
Details of
shareholders holding more than 5% shares in the company:
|
Name of
Shareholders |
31.03.2017 |
|
|
No. of Shares
held |
% of Holding |
|
|
State Bank of India |
23196889 |
12.47% |
|
Axis Bank |
11586959 |
6.23% |
|
Janardan Agrawal |
7576140 |
4.07% |
|
Reynold Shirting Limited |
13215714 |
7.11% |
|
AAA United B.V. |
51000400 |
27.42% |
|
Ashwell Holding Company Private Limited |
28420000 |
15.28% |
Disclosure pursuant
to Part I of Schedule III to the Companies Act, 2013
|
Particulars |
Aggregate No. of Shares
(for last 5 Financial Years) |
|
Equity Shares : |
|
|
Fully paid up pursuant to contract(s) without payment being received in cash |
NIL |
|
Fully paid up pursuant to scheme of CDR * |
51394193 |
|
Fully paid up by way of bonus shares |
NIL |
|
Shares bought back |
NIL |
* Corporate debt
restructuring (CDR)
- During the F.Y.2013-14, the Company’s proposal for restructuring of its debts was approved by Corporate Debt Restructuring Cell (“CDR Cell”) vide Letter of Approval (LOA) dated September 27, 2013. The cut off date (COD) for implementation of CDR was 1st April, 2013. The Company has executed Master Restructuring Agreement (‘MRA’) with CDR Lenders on September 30, 2013.
- Lenders with the approval of CDR EG shall have the right to recompense the reliefs/ sacrifices/ waivers extended by respective CDR Lenders as per the CDR guidelines. The recompense payable is contingent on various factors including improved performance of the Company and many other conditions, the outcome of which is currently materially uncertain. Recompense amount comes to INR 5269.800 million.
- During the year, CDR lenders have approved to convert the outstanding loans of INR 9342.600 million Funded Interest Term Loan (FITL) and Working Capital Term Loan (WCTL) into equity. Till 31st March, 2017 total amount of INR 8525.300 million of FITL and WCTL was converted by the Lenders and accordingly 51394193 equity shares were allotted to them at a price of INR 165.88 per shares
- Pursuant to the successful conversion of the outstanding loan of FITL and WCTL into equity shares as per the details given above, the company became compliant to the requirement of minimum public share holding of 25% in the listed companies as per the SEBI guidelines. The company has received an order from SEBI u/s 11(1), 11(2)(1), 11(4) and 11B of the SEBI Act, 1992 dated 09th March, 2017 to this effect.
- After close of Financial Year on 5th May, 2017and further on 24th May, 2017, total amount of INR 800.700 million of FITL ans WCTL was into equity shares converted by Lenders and accordingly 4826982 equity shares were allotted to them at a price of INR 165.88 per share. ( FV of the equity share INR 10)
- After close of Financial Year on 24th May 2017, the Company has entered into a Framework Agreement with the CDR Lenders for their approval under Scheme of Sustainable Structuring of Stressed Assets (S4A) in terms of RBI circular dated 13th June, 2016 according to which unsustainable loans of INR 22497.400 million was converted into Equity Shares and optionally convertible debentures(OCD). Accordingly CDR Lenders were allotted 107345243 equity shares at a price of INR 146.03 per share and 3995092 “OCDs” of INR 1000/- each. On 24th May, 2017.
- Total outstanding amount on account of repayment of term loans of INR 787.500 million and interest on Term loans and working capital loan of INR 1558.700 million due and unpaid as on 31.03.2017 was considered as part of unsustainable debt and accordingly was cleared in full on 24.05.2017 upon the above conversion.
FINANCIAL DATA
[all figures are
INR Million]
ABRIDGED
BALANCE SHEET [STANDALONE]
|
SOURCES OF FUNDS |
31.03.2017 |
31.03.2016 |
31.03.2015 |
|
|
|
|
|
|
I.
EQUITY AND LIABILITIES |
|
|
|
|
(1)Shareholders' Funds |
|
|
|
|
(a) Share Capital |
1859.900 |
1346.000 |
1346.000 |
|
(b) Reserves &
Surplus |
24686.200 |
18201.600 |
24832.800 |
|
(c) Money received
against share warrants |
0.000 |
0.000 |
493.100 |
|
|
|
|
|
|
(2) Share Application
money pending allotment |
0.000 |
0.000 |
0.000 |
|
Total Shareholders’ Funds
|
26546.100 |
19547.600 |
26671.900 |
|
|
|
|
|
|
(3) Non-Current
Liabilities |
|
|
|
|
(a) long-term borrowings |
17027.700 |
26813.600 |
27417.300 |
|
(b) Deferred tax
liabilities (Net) |
1305.300 |
1958.600 |
726.000 |
|
(c) Other long term
liabilities |
123.500 |
103.000 |
0.000 |
|
(d) long-term provisions |
0.000 |
0.000 |
81.800 |
|
Total Non-current
Liabilities |
18456.500 |
28875.200 |
28225.100 |
|
|
|
|
|
|
(4) Current Liabilities |
|
|
|
|
(a) Short term borrowings |
36358.100 |
27185.900 |
23831.800 |
|
(b) Trade payables |
5418.900 |
7396.800 |
6395.700 |
|
(c) Other current
liabilities |
5334.800 |
3911.100 |
2769.100 |
|
(d) Short-term provisions |
54.200 |
54.000 |
397.100 |
|
Total Current Liabilities
|
47166.000 |
38547.800 |
33393.700 |
|
|
|
|
|
|
TOTAL |
92168.600 |
86970.600 |
88290.700 |
|
|
|
|
|
|
II.
ASSETS |
|
|
|
|
(1) Non-current assets |
|
|
|
|
(a) Fixed Assets |
|
|
|
|
(i) Tangible assets |
31756.900 |
33251.100 |
33717.900 |
|
(ii) Intangible Assets |
12.700 |
25.900 |
41.000 |
|
(iii) Capital
work-in-progress |
89.400 |
1.500 |
109.400 |
|
(iv) Intangible assets
under development |
0.000 |
0.000 |
0.000 |
|
(b) Non-current
Investments |
1465.700 |
1465.200 |
1494.900 |
|
(c) Deferred tax assets
(net) |
0.000 |
0.000 |
0.000 |
|
(d) Long-term Loan and Advances |
1560.700 |
1501.500 |
3724.700 |
|
(e) Other Non-current
assets |
392.500 |
659.600 |
0.000 |
|
Total Non-Current Assets |
35277.900 |
36904.800 |
39087.900 |
|
|
|
|
|
|
(2) Current assets |
|
|
|
|
(a) Current investments |
0.000 |
1.100 |
1.100 |
|
(b) Inventories |
36463.400 |
31214.200 |
28753.600 |
|
(c) Trade receivables |
14722.900 |
12753.100 |
11547.000 |
|
(d) Cash and cash
equivalents |
531.900 |
818.300 |
867.700 |
|
(e) Short-term loans and
advances |
720.900 |
877.300 |
8033.400 |
|
(f) Other current assets |
4451.600 |
4401.800 |
0.000 |
|
Total Current Assets |
56890.700 |
50065.800 |
49202.800 |
|
|
|
|
|
|
TOTAL |
92168.600 |
86970.600 |
88290.700 |
PROFIT
& LOSS ACCOUNT [STANDALONE]
|
|
PARTICULARS |
31.03.2017 |
31.03.2016 |
31.03.2015 |
|
|
SALES |
|
|
|
|
|
Income |
38769.600 |
41716.200 |
35326.700 |
|
|
Other Income |
216.700 |
544.000 |
400.800 |
|
|
TOTAL |
38986.300 |
42260.200 |
35727.500 |
|
|
|
|
|
|
|
Less |
EXPENSES |
|
|
|
|
|
Cost of Materials
Consumed |
27489.600 |
28948.200 |
26515.600 |
|
|
Changes in inventories of
finished goods, work-in-progress and Stock-in-Trade |
(2784.900) |
(2560.200) |
(3597.500) |
|
|
Employees benefits
expense |
2546.500 |
2487.500 |
2322.200 |
|
|
Other expenses |
5527.700 |
5263.300 |
4458.400 |
|
|
TOTAL |
32778.900 |
34138.800 |
29698.700 |
|
|
|
|
|
|
|
|
PROFIT / (LOSS) BEFORE INTEREST,
TAX, DEPRECIATION AND AMORTISATION |
6207.400 |
8121.400 |
6028.800 |
|
|
|
|
|
|
|
Less |
FINANCIAL EXPENSES |
6717.500 |
5966.500 |
5576.000 |
|
|
|
|
|
|
|
|
PROFIT / (LOSS) BEFORE
TAX, DEPRECIATION AND AMORTISATION |
(510.100) |
2154.900 |
452.800 |
|
|
|
|
|
|
|
Less |
DEPRECIATION/
AMORTISATION |
1615.100 |
1657.800 |
1663.300 |
|
|
|
|
|
|
|
|
PROFIT/ (LOSS) BEFORE TAX |
(2125.200) |
497.100 |
(1210.500) |
|
|
|
|
|
|
|
Less |
TAX |
(612.900) |
262.900 |
(423.100) |
|
|
|
|
|
|
|
|
PROFIT/ (LOSS) AFTER TAX
|
(1512.300) |
234.200 |
(787.400) |
|
|
|
|
|
|
|
|
EARNINGS IN FOREIGN
CURRENCY |
|
|
|
|
|
F.O.B. Value of Exports |
5296.700 |
6006.300 |
3894.400 |
|
|
TOTAL EARNINGS |
5296.700 |
6006.300 |
3894.400 |
|
|
|
|
|
|
|
|
IMPORTS |
|
|
|
|
|
Raw Materials and Others |
1569.000 |
399.200 |
258.800 |
|
|
Stores and Spares |
30.300 |
53.900 |
301.800 |
|
|
Capital Goods |
3.000 |
66.900 |
23.700 |
|
|
TOTAL IMPORTS |
1602.300 |
520.000 |
584.300 |
|
|
|
|
|
|
|
|
Earnings / (Loss) Per
Share (INR) |
(8.68) |
1.74 |
(5.85) |
CURRENT MATURITIES
OF LONG TERM DEBT DETAILS
|
Particulars |
31.03.2017 |
31.03.2016 |
31.03.2015 |
|
Current Maturities of Long term debt |
2765.900 |
2347.000 |
2170.000 |
|
Cash Generation from Operations |
2837.900 |
4537.200 |
5760.700 |
|
Net Cash Flow from operating activities |
2810.200 |
4476.900 |
5734.900 |
QUARTERLY
RESULTS
|
PARTICULARS |
|
30.06.2017 1st
Quarter |
30.09.2017 2nd
Quarter |
|
|
|
(Unaudited) |
(Unaudited) |
|
|
|
|
|
|
Net Sales |
|
10277.900 |
6750.500 |
|
Total Expenditure |
|
8567.300 |
5732.700 |
|
PBIDT (Excluding Other Income) |
|
1710.600 |
1017.800 |
|
Other Income |
|
49.300 |
9.200 |
|
Operating Profit |
|
1759.900 |
1027.000 |
|
Interest |
|
1444.700 |
820.100 |
|
Exceptional Items |
|
0.000 |
NA |
|
PBDT |
|
315.200 |
206.900 |
|
Depreciation |
|
385.300 |
390.700 |
|
Profit Before Tax |
|
(70.100) |
(183.800) |
|
Tax |
|
(17.200) |
(38.200) |
|
Provisions and contingencies |
|
NA |
NA |
|
Profit After Tax |
|
(52.900) |
(145.600) |
|
Extraordinary Items |
|
NA |
NA |
|
Prior Period Expenses |
|
NA |
NA |
|
Other Adjustments |
|
NA |
NA |
|
Net Profit |
|
(52.900) |
(145.600) |
KEY
RATIOS
EFFICIENCY RATIOS
|
PARTICULARS |
31.03.2017 |
31.03.2016 |
31.03.2015 |
|
Average Collection Days (Sundry Debtors
/ Income * 365) |
138.61 |
111.58 |
119.31 |
|
|
|
|
|
|
Account Receivables Turnover (Income /
Sunday Debtors) |
2.63 |
3.27 |
3.06 |
|
|
|
|
|
|
Average Payment Days (Sundry Creditors / Purchases * 365 Days) |
71.95 |
93.26 |
88.04 |
|
|
|
|
|
|
Inventory Turnover (Operating Income / Inventories) |
0.17 |
0.26 |
0.21 |
|
|
|
|
|
|
Asset Turnover (Operating Income / Net Fixed Assets) |
0.19 |
0.24 |
0.18 |
LEVERAGE RATIOS
|
PARTICULARS |
31.03.2017 |
31.03.2016 |
31.03.2015 |
|
Debt Ratio ((Borrowing
+ Current Liabilities) / Total Assets) |
0.73 |
0.78 |
0.71 |
|
|
|
|
|
|
Debt Equity Ratio (Total Liability / Networth) |
2.12 |
2.88 |
2.00 |
|
|
|
|
|
|
Current Liabilities to Networth (Current Liabilities / Net Worth) |
1.78 |
1.97 |
1.25 |
|
|
|
|
|
|
Fixed Assets to Networth (Net Fixed Assets / Networth) |
1.20 |
1.70 |
1.27 |
|
|
|
|
|
|
Interest Coverage Ratio (PBIT / Financial Charges) |
0.92 |
1.36 |
1.08 |
PROFITABILITY RATIOS
|
PARTICULARS |
|
31.03.2017 |
31.03.2016 |
31.03.2015 |
|
Net Profit Margin [(PAT
/ Sales) * 100] |
% |
(3.90) |
0.56 |
(2.23) |
|
|
|
|
|
|
|
Return on Total Assets ((PAT / Total Assets) * 100) |
% |
(1.64) |
0.27 |
(0.89) |
|
|
|
|
|
|
|
Return on Investment (ROI) ((PAT / Networth) * 100) |
% |
(5.70) |
1.20 |
(2.95) |
SOLVENCY RATIOS
|
PARTICULARS |
31.03.2017 |
31.03.2016 |
31.03.2015 |
|
Current Ratio (Current
Assets / Current Liabilities) |
1.21 |
1.30 |
1.47 |
|
|
|
|
|
|
Quick Ratio ((Current Assets – Inventories) / Current
Liabilities) |
0.43 |
0.49 |
0.61 |
|
|
|
|
|
|
G-Score Ratio Financial (Networth / Total Assets) |
0.29 |
0.22 |
0.30 |
|
|
|
|
|
|
G-Score Ratio Debt (Debts / Equity Capital) |
30.19 |
41.86 |
39.69 |
|
|
|
|
|
|
G-Score Ratio Liquidity (Total Current Assets / Total Current Liabilities) |
1.21 |
1.30 |
1.47 |
Total
Liability = Short-term Debt + Long-term Debt + Current Maturities of Long-term
debts
STOCK
PRICES
|
Face Value |
INR 10.00/- |
|
Market Value |
INR 105.00/- |
FINANCIAL ANALYSIS
[all figures are
INR Million]
DEBT EQUITY RATIO
|
Particular |
31.03.2015 |
31.03.2016 |
31.03.2017 |
|
|
INR In Million |
INR In Million |
INR In Million |
|
Share Capital |
1346.000 |
1346.000 |
1859.900 |
|
Reserves & Surplus |
24832.800 |
18201.600 |
24686.200 |
|
Money received against
share warrants |
493.100 |
0.000 |
0.000 |
|
Share Application money
pending allotment |
0.000 |
0.000 |
0.000 |
|
Net worth |
26671.900 |
19547.600 |
26546.100 |
|
|
|
|
|
|
long-term borrowings |
27417.300 |
26813.600 |
17027.700 |
|
Short term borrowings |
23831.800 |
27185.900 |
36358.100 |
|
Current Maturities of
Long term debt |
2170.000 |
2347.000 |
2765.900 |
|
Total borrowings |
53419.100 |
56346.500 |
56151.700 |
|
Debt/Equity ratio |
2.003 |
2.883 |
2.115 |
YEAR-ON-YEAR GROWTH
|
Year on Year Growth |
31.03.2015 |
31.03.2016 |
31.03.2017 |
|
|
INR In Million |
INR In Million |
INR In Million |
|
Sales |
35326.700 |
41716.200 |
38769.600 |
|
|
|
18.087 |
(7.063) |

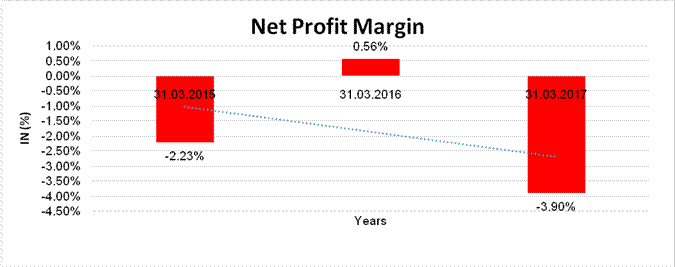
NET PROFIT MARGIN
|
Net Profit Margin |
31.03.2015 |
31.03.2016 |
31.03.2017 |
|
|
INR In Million |
INR In Million |
INR In Million |
|
Sales |
35326.700 |
41716.200 |
38769.600 |
|
Profit / (Loss) |
(787.400) |
234.200 |
(1512.300) |
|
|
(2.23%) |
0.56% |
(3.90%) |
ABRIDGED
BALANCE SHEET [CONSOLIDATED]
|
SOURCES OF FUNDS |
|
31.03.2017 |
31.03.2016 |
|
|
|
|
|
|
I.
EQUITY AND LIABILITIES |
|
|
|
|
(1)Shareholders' Funds |
|
|
|
|
(a) Share Capital |
|
1859.900 |
1346.000 |
|
(b) Reserves &
Surplus |
|
25311.200 |
18935.400 |
|
(c) Money received
against share warrants |
|
0.000 |
0.000 |
|
|
|
|
|
|
(2) Share Application money
pending allotment |
|
0.000 |
0.000 |
|
(3) Minority interest |
|
14.900 |
14.900 |
|
Total Shareholders’ Funds
|
|
27186.000 |
20296.300 |
|
|
|
|
|
|
(4) Non-Current
Liabilities |
|
|
|
|
(a) long-term borrowings |
|
16653.400 |
26425.900 |
|
(b) Deferred tax
liabilities (Net) |
|
1391.500 |
1958.600 |
|
(c) Other long term
liabilities |
|
0.000 |
0.000 |
|
(d) long-term provisions |
|
145.900 |
118.000 |
|
Total Non-current
Liabilities |
|
18190.800 |
28502.500 |
|
|
|
|
|
|
(5) Current Liabilities |
|
|
|
|
(a) Short term borrowings |
|
36359.300 |
27186.700 |
|
(b) Trade payables |
|
5901.600 |
8598.700 |
|
(c) Other current
liabilities |
|
5819.100 |
4335.900 |
|
(d) Short-term provisions |
|
66.200 |
102.000 |
|
Total Current Liabilities
|
|
48146.200 |
40223.300 |
|
|
|
|
|
|
TOTAL |
|
93523.000 |
89022.100 |
|
|
|
|
|
|
II.
ASSETS |
|
|
|
|
(1) Non-current assets |
|
|
|
|
(a) Fixed Assets |
|
|
|
|
(i) Tangible assets |
|
33051.300 |
34580.100 |
|
(ii) Intangible Assets |
|
1469.900 |
1482.400 |
|
(iii) Capital
work-in-progress |
|
115.900 |
45.100 |
|
(iv) Intangible assets
under development |
|
0.000 |
0.000 |
|
(b) Non-current
Investments |
|
231.000 |
230.500 |
|
(c) Deferred tax assets
(net) |
|
0.000 |
0.000 |
|
(d) Long-term Loan and Advances |
|
2055.400 |
2088.500 |
|
(e) Other Non-current
assets |
|
394.800 |
659.600 |
|
Total Non-Current Assets |
37318.300 |
39086.200 |
|
|
|
|
|
|
|
(2) Current assets |
|
|
|
|
(a) Current investments |
|
0.000 |
1.100 |
|
(b) Inventories |
|
36512.400 |
31261.300 |
|
(c) Trade receivables |
|
14196.100 |
12955.200 |
|
(d) Cash and cash
equivalents |
|
756.200 |
1038.800 |
|
(e) Short-term loans and
advances |
|
2.600 |
0.000 |
|
(f) Other current assets |
|
4737.400 |
4679.500 |
|
Total Current Assets |
|
56204.700 |
49935.900 |
|
|
|
|
|
|
TOTAL |
|
93523.000 |
89022.100 |
PROFIT
& LOSS ACCOUNT [CONSOLIDATED]
|
|
PARTICULARS |
|
31.03.2017 |
31.03.2016 |
|
|
SALES |
|
|
|
|
|
Income |
|
38948.600 |
42095.800 |
|
|
Other Income |
|
222.300 |
1034.500 |
|
|
TOTAL |
|
39170.900 |
43130.300 |
|
|
|
|
|
|
|
Less |
EXPENSES |
|
|
|
|
|
Cost of Materials
Consumed |
|
27544.700 |
29110.600 |
|
|
Changes in inventories of
finished goods, work-in-progress and Stock-in-Trade |
|
(2788.100) |
(2556.700) |
|
|
Employees benefits
expense |
|
2737.100 |
2787.700 |
|
|
Prior year adjustments |
|
0.700 |
0.000 |
|
|
Deferred tax |
|
75.700 |
0.000 |
|
|
Other expenses |
|
5458.000 |
5316.900 |
|
|
TOTAL |
|
33028.100 |
34658.500 |
|
|
|
|
|
|
|
|
PROFIT / (LOSS) BEFORE INTEREST,
TAX, DEPRECIATION AND AMORTISATION |
|
6142.800 |
8471.800 |
|
|
|
|
|
|
|
Less |
FINANCIAL EXPENSES |
|
6725.500 |
5973.200 |
|
|
|
|
|
|
|
|
PROFIT / (LOSS) BEFORE
TAX, DEPRECIATION AND AMORTISATION |
|
(582.700) |
2498.600 |
|
|
|
|
|
|
|
Less |
DEPRECIATION/
AMORTISATION |
|
1665.500 |
1808.600 |
|
|
|
|
|
|
|
|
PROFIT/ (LOSS) BEFORE TAX |
|
(2248.200) |
690.000 |
|
|
|
|
|
|
|
Less |
TAX |
|
(625.400) |
405.800 |
|
|
|
|
|
|
|
|
PROFIT/ (LOSS) AFTER TAX
|
(1622.800) |
284.200 |
|
|
|
|
|
|
|
|
Add |
Minority interest |
|
0.000 |
1.500 |
|
|
|
|
|
|
|
|
PROFIT
/ (LOSS) FOR THE YEAR |
|
(1622.800) |
285.700 |
|
|
|
|
|
|
|
|
Earnings / (Loss) Per Share
(INR) |
|
(9.32) |
2.12 |
LOCAL AGENCY FURTHER INFORMATION
|
Sr. No. |
Check list by
info agents |
Available in
Report (Yes/No) |
|
1 |
Year of establishment |
Yes |
|
2 |
Constitution of the entity -Incorporation
details |
Yes |
|
3 |
Locality of the entity |
Yes |
|
4 |
Premises details |
No |
|
5 |
Buyer visit details |
-- |
|
6 |
Contact numbers |
Yes |
|
7 |
Name of the person contacted |
Yes |
|
8 |
Designation of contact person |
Yes |
|
9 |
Promoter’s background |
Yes |
|
10 |
Date of Birth of Proprietor / Partners /
Directors |
Yes |
|
11 |
Pan Card No. of Proprietor / Partners |
No |
|
12 |
Voter Id Card No. of Proprietor / Partners |
No |
|
13 |
Type of business |
Yes |
|
14 |
Line of Business |
Yes |
|
15 |
Export/import details (if applicable) |
No |
|
16 |
No. of employees |
Yes |
|
17 |
Details of sister concerns |
Yes |
|
18 |
Major suppliers |
No |
|
19 |
Major customers |
No |
|
20 |
Banking Details |
Yes |
|
21 |
Banking facility details |
Yes |
|
22 |
Conduct of the banking account |
-- |
|
23 |
Financials, if provided |
Yes |
|
24 |
Capital in the business |
Yes |
|
25 |
Last accounts filed at ROC, if applicable |
Yes |
|
26 |
Turnover of firm for last three years |
Yes |
|
27 |
Reasons for variation <> 20% |
-- |
|
28 |
Estimation for coming financial year |
No |
|
29 |
Profitability for last three years |
Yes |
|
30 |
Major shareholders, if available |
Yes |
|
31 |
External Agency Rating, if available |
No |
|
32 |
Litigations that the firm/promoter
involved in |
-- |
|
33 |
Market information |
-- |
|
34 |
Payments terms |
No |
|
35 |
Negative Reporting by Auditors in the
Annual Report |
No |
OPERATIONS:
The total sales of the Company for the year were lowered by 7.6% to INR 38769.600 million as against INR 41716.200 million in previous financial year. The reduction in sale is due to general market conditions and stress on working capital. Due to lowered operations, the Company suffered loss of INR 1512.300 million during the financial year, compared to INR 234.200 million profit as per IND-AS of previous financial year.
MANAGEMENT DISCUSSION
AND ANALYSIS
INDUSTRY STRUCTURE
AND DEVELOPMENT
GLOBAL TEXTILE AND
APPAREL MARKET OVERVIEW –
Global apparel consumption is US$ 1.7 trillion which is expected to grow at a CAGR of 4% to reach US$ 2.6 trillion by 2025. Fastest growth (12%) is expected to be witnessed in India followed by China (10%).
China will be the largest apparel market by 2025 with a share of 21% in global apparel market. EU and USA will continue dominating the global apparel markets with 17% and 15% share, respectively. India will have 8% share in global apparel market in 2025 which currently stands at approx. 4.5%.
Global textile and apparel trade in 2016 stood at US$ 720 bn. T&A trade is cyclical in nature where couple of years’ growth is followed by trade decline. However, trade has grown at a CAGR of 2% from 2010 to 2016. Apparel is the single largest category which has a share of 55% in the global textiles and apparel trade in 2016. China is the largest exporter of textiles and apparel with a share of approx. 38% in global T&A trade. China is followed by India with an approximate share of 5% in global textile and apparel trade.
INDIAN TEXTILE AND
APPAREL MARKET OVERVIEW
Indian textile and apparel market is estimated at US$ 124 billion in 2016. Domestic consumption of textile and apparel is valued at US$ 84 bn. for 2016. Within this, apparel retail contributes ~ US$ 63 bn., technical textiles contributes ~ US$ 15 bn. and home textiles contributes ~ US$ 6 bn. While export is estimated at US$ 40 billion with US$ 23 billion and US$ 17 billion of textile and apparel export respectively.
CATEGORY WISE EXPORTS
Apparel is the largest category exported from India having a share of 48% in the total textile and apparel exports during 2016-17 which has increased considerably from 39% in 2012-13. Home Textiles is the second largest category exported from India with a share of 14% in 2016-17 followed by fabric, handicrafts and yarn with a share of 12%, 12% and 11% respectively. Share of fiber and filament has declined from 13% and 4% in 2012-13 to 7% and 3% in 2016-17 respectively. This indicates that slowly and gradually India’s export product mix is getting shifted towards value added products.
SEGMENT-WISE OR
PRODUCT-WISE PERFORMANCE:
The Company is engaged in the business of manufacturing and sale of textile accordingly this is the only single reportable segment.
OUTLOOK
As a Company Bombay Rayon Fashions Limited is optimistic about future as well as its growth path. The Company is confident in the ability to grow its business organically with the reduction debts burden on its conversion in to equity.
SWOT ANALYSIS OF
INDIAN TEXTILE INDUSTRY:
STRENGTH
- Nation’s textile industry has potential to double its rise in the next 7 years; China is losing advantage in textile because of rising power costs, labour costs and focus on domestic market;
- Major exporting countries like Bangladesh are also facing geopolitical issues;
- Country’s major costs such as cotton, yarn, power, wages, dyes and chemicals are internationally competitive;
- Make in India campaign covering 25 sectors including the textile and garment industry has been launched. An investment opportunities for foreign companies and entrepreneurs are present across the complete value chain of synthetics, value-added and specialty fabrics, fabric processing set-ups for the following:
- Natural and synthetic textiles,
- Technical textiles,
- Garments, and
- Retail brands.
- GoI also allows 100% FDI through the automatic route in the textile sector through ‘Make in India’ initiative;
- Technology Upgradation Fund Scheme launched in 1999 has also given a major boost to this sector; the
scheme is continuing through the 12th plan with a massive focus on power looms
WEAKNESSES
- Preferential tax regime whereby the textile sector has not received its due under the FTP despite being one of the biggest job providers in the nation;
- Huge tariff barriers are faced by the industry on account of preferential tariff arrangements;
- Duty sops of only 2% were given to mainstream cotton textile products, whereas higher rates were given for handlooms, carpets, coir products under the merchandise exports from India scheme (MEIS);
- Man made textile industry that is highly capital intensive and can attract FDI has been discriminated against through the cotton industry; liberal MEIS benefit under FTP has not been granted to this sector;
- Benefits for exporting textiles in major emerging markets for MMF textiles have been stopped in the new FTP;
- Old machines, more than 10 years old, especially in the weaving sector is another problem plaguing the industry. While the global textile industry is advancing technologically, local textile industry still relies on import of second hand textile machineries;
- Rigid labour laws have stymied the growth of the sector where labour involvement is maximum;
- Lack of economies of scale and paucity of large manufacturing capacities is also a weakness of the Indian textile sector.
INTERNAL CONTROL
SYSTEM AND THEIR ADEQUACY:
The Company has an effective internal control and risk-mitigation system, which are constantly assessed and strengthened with new/revised standard operating procedures. The Company’s internal control system is commensurate with its size, scale and complexities of its operations. The internal and operational audit is entrusted to S. Venkatram and Co., a reputed firm of Chartered Accountants. The main thrust of internal audit is to test and review controls, appraisal of risks and business processes, besides benchmarking controls with best practices in the industry. The Audit Committee of the Board of Directors actively reviews the adequacy and effectiveness of the internal control systems and suggests improvements to strengthen the same. The Company has a robust Management Information System, which is an integral part of the control mechanism. The Audit Committee of the Board of Directors, Statutory Auditors and the Business Heads are periodically apprised of the internal audit findings and corrective actions taken. Audit plays a key role in providing assurance to the Board of Directors. Significant audit observations and corrective actions taken by the management are presented to the Audit Committee of the Board. To maintain its objectivity and independence, the Internal Audit function reports to the Chairman of the Audit Committee.
UNSECURED LOANS:
|
Unsecured Loan |
31.03.2017 INR In Million |
31.03.2016 INR In Million |
|
Long-term
Borrowings |
|
|
|
From Related
Parties : |
|
|
|
Advances from Subsidiary |
402.500 |
402.500 |
|
From Promoters |
966.600 |
966.600 |
|
From Others |
552.000 |
935.300 |
|
Total |
1921.100 |
2304.400 |
INDEX OF CHARGE:
|
SNo |
SRN |
Charge Id |
Charge Holder Name |
Date of Creation |
Date of Modification |
Amount |
Address |
|
1 |
G62579388 |
100134253 |
Bank of India |
16/06/2017 |
- |
2260400000.0 |
MDI, Building, First Floor, 28 S.V. Road, Andheri (West), Mumbai-400058, Maharashtra, India |
|
2 |
G55141824 |
100130405 |
Sbicap Trustee Company Limited |
23/05/2017 |
- |
4001970707.0 |
202, Maker Tower, 'E', Cuffe Parade, Colaba,Mumbai-400005, Maharashtra, India |
|
3 |
C76297902 |
10614125 |
Standard Chartered Bank |
31/12/2015 |
- |
1968000000.0 |
Crescenzo, 3A/F Plot No. C-38 and 39G-Block, Bandra Kurla Complex, Mumbai-400051, Maharashtra, India |
|
4 |
C76848522 |
10615390 |
Allahabad Bank |
29/12/2015 |
- |
130000000.0 |
Fort Branch, 37- Mumbai Samachar Marg, Fort, Mumbai-400023, Maharashtra, India |
|
5 |
C76957729 |
10615688 |
Central Bank of India |
29/12/2015 |
- |
250000000.0 |
Vaastu Darsha 'B' Wing, 1st Floor, Asad Road, Nextto K/East Ward Municipal Office Building, Andheri, Mumbai-400069, Maharashtra, India |
|
6 |
C75693663 |
10612613 |
Bank of India |
22/12/2015 |
- |
220000000.0 |
MDI, Building, First Floor, 28 S.V. Road, Andheri (West), Mumbai-400058, Maharashtra, India |
|
7 |
C64542293 |
10591632 |
State Bank of India |
28/07/2015 |
- |
1900000000.0 |
Corporate Centre at State Bank Bhavan, Madame Cama Road, Nariman Point, Mumbai-400021, Maharashtra, India |
|
8 |
C60046463 |
10582469 |
Central Bank of India |
25/06/2015 |
- |
670000000.0 |
Vaastu Darsha 'B' Wing, 1st Floor, Asad Road, Nextto K/East Ward Municipal Office Building, Andheri, Mumbai-400069, Maharashtra, India |
|
9 |
C75607119 |
10564335 |
Bank of India |
24/03/2015 |
18/12/2015 |
190000000.0 |
MDI, Building, First Floor, 28 S.V. Road, Andheri (West), Mumbai-400058, Maharashtra, India |
|
10 |
C67252940 |
10596979 |
Allahabad Bank |
24/03/2015 |
- |
830000000.0 |
Fort Branch, 37- Mumbai Samachar Marg, Fort, Mumbai-400023, Maharashtra, India |
CONTINGENT
LIABILITIES:
(INR in million)
|
PARTICULARS |
31.03.2017 |
31.03.2016 |
|
Bills Discounted with Banks under Letter of credits or otherwise. |
158.700 |
853.900 |
|
Bank Guarantee |
46.100 |
34.500 |
|
Employees State Insurance Contribution |
27.000 |
29.300 |
|
Employees Provident Fund |
62.700 |
65.400 |
|
Demand outstanding related to Income tax |
624.900 |
684.000 |
STATEMENT OF
STANDALONE UNAUDITED FINANCIAL RESULTS FOR THE QUARTER ENDED 30TH
SEPTEMBER, 2017
(INR In Million)
|
Particulars |
Quarter ended |
Half year ended |
|
|
|
30.09.2017 |
30.06.2017 |
30.09.2017 |
|
|
Unaudited |
Unaudited |
Unaudited |
|
INCOME FROM OPERATIONS |
|
|
|
|
Net Sales |
6750.500 |
10277.900 |
17028.400 |
|
Other Operating Income |
9.200 |
49.300 |
58.500 |
|
Total
Income from Operations |
6759.700 |
10327.200 |
17086.900 |
|
|
|
|
|
|
EXPENSES |
|
|
|
|
Cost of materials consumed |
4941.200 |
7226.400 |
12167.600 |
|
Changes in inventories of finished goods and
work-in-progress |
(1058.200) |
(452.600) |
(1510.800) |
|
Employee benefits expense |
705.200 |
588.600 |
1293.800 |
|
Finance costs |
820.100 |
1444.700 |
2264.800 |
|
Depreciation and Amortization expenses |
390.700 |
385.300 |
776.000 |
|
Other Expenditure |
1144.500 |
1204.900 |
2349.400 |
|
Total
Expenses |
6943.500 |
10397.300 |
17340.800 |
|
Profit
/ (Loss) before Tax |
(183.800) |
(70.100) |
(253.900) |
|
Tax Expense |
(38.200) |
(17.200) |
(292.300) |
|
Profit
/ (Loss) after Tax |
(145.600) |
(52.900) |
(463.900) |
|
Paid-up Equity Share Capital (Face value INR 10/- per
share) |
2981.700 |
2981.700 |
2981.700 |
|
Basic
and Diluted EPS (in INR) |
(0.49) |
(0.18) |
(0.67) |
UNAUDITED
STANDALONE STATEMENT OF ASSTES AND LIABILITIES AS ON SEPTEMBER 30, 2017
INR In Million
|
SOURCES OF FUNDS |
|
|
30.09.2017 (Unaudited) |
|
I.
EQUITY
AND LIABILITIES |
|
|
|
|
(1)Shareholders' Funds |
|
|
|
|
(a) Share Capital |
|
|
2981.700 |
|
(b) Reserves & Surplus |
|
|
39831.400 |
|
(c) Pending Call Money |
|
|
0.000 |
|
Sub-total Shareholders’ |
|
|
42813.100 |
|
|
|
|
|
|
(2) Non-Current Liabilities |
|
|
|
|
(a) long-term borrowings |
|
|
16982.900 |
|
(b) Deferred tax liabilities (Net) |
|
|
1249.900 |
|
(c) Other long term liabilities |
|
|
123.500 |
|
(d) long-term provisions |
|
|
0.000 |
|
Sub-total of
Non-Current liabilities |
|
|
18356.300 |
|
|
|
|
|
|
(3)
Current liabilities |
|
|
|
|
(a) Short
term borrowings |
|
|
23318.900 |
|
(b) Trade
payables |
|
|
5546.100 |
|
(c) Other
current liabilities |
|
|
3342.800 |
|
(d) Short-term
provisions |
|
|
0.600 |
|
Sub-total of Current liabilities |
|
|
32208.400 |
|
|
|
|
|
|
TOTAL |
|
|
93377.800 |
|
|
|
|
|
|
II.
ASSETS |
|
|
|
|
(1)
Non-current assets |
|
|
|
|
(a) Fixed
Assets |
|
|
|
|
i)
Tangible
assets |
|
|
31012.000 |
|
ii)
Intangible
assets |
|
|
11.600 |
|
iii)
Capital
work-in-progress |
|
|
147.900 |
|
(b)
Non-Current investments |
|
|
1465.700 |
|
(c) Deferred
tax assets (net) |
|
|
0.000 |
|
(d) Long
term loans and advances |
|
|
1346.300 |
|
(e) Other
non-current assets |
|
|
318.900 |
|
Sub-total of
Non-Current Assets |
|
|
34302.400 |
|
|
|
|
|
|
(2)
Current assets |
|
|
|
|
(a)
Current investments |
|
|
0.000 |
|
(b)
Inventories |
|
|
38125.800 |
|
(c) Trade
receivables |
|
|
16172.300 |
|
(d) Cash
and cash equivalents |
|
|
422.700 |
|
(e)
Short-term loans and advances |
|
|
475.100 |
|
(f) Other
current assets |
|
|
3879.500 |
|
Sub-total of
Current Assets |
|
|
59075.400 |
|
|
|
|
|
|
TOTAL |
|
|
93377.800 |
NOTES:
1. The above results were reviewed by the Audit Committee. The Board of Directors at its meeting held on 14th November, 2017 has approved the above results and its release.
2. The Limited Review under Regulation 33 of the SEBI (Listing Obligations and
Disclosure Requirements) Regulation 2015 has been carried out by the Statutory
Auditors.
3. This statement has been prepared in accordance with the Companies {Indian
Accounting) Rules, 2015 (Ind As) prescribed under Section 133 of Companies Act,
2013 with rule 3 of
4. Upon Implementation of S4A, against conversion of Balance portion
unsustainable debt, the company has made following allotment to SBI:
(a) 106732 Optionally Convertible Debentures of INR 1000/- each aggregating to
INR 10.67 Crores on 29th Sept, 2017.
(b) 19310061 Equity Shares of Face Value of INR 10/- each at a premium of INR
130.50 per share aggregating to INR 2713.100 million on 3rd October, 2017.
5. The Company operates in a single segment of manufacture and sale of Textiles
6. The above is Financial Results for the quarter and six months ended 30th
September, 2017.
FIXED ASSETS:
- Land
- Building
- Office Premises
- Plant and Machinery
- Furniture
- Office Equipment
- Computer
- Vehicles
CMT REPORT (Corruption, Money Laundering & Terrorism]
The Public Notice information has been collected from various sources
including but not limited to: The Courts, India Prisons Service,
Interpol, etc.
1] INFORMATION ON
DESIGNATED PARTY
No exist designating subject or any of its beneficial owners, controlling
shareholders or senior officers as terrorist or terrorist organization or whom
notice had been received that all financial transactions involving their assets
have been blocked or convicted, found guilty or against whom a judgement or
order had been entered in a proceedings for violating money-laundering,
anti-corruption or bribery or international economic or anti-terrorism sanction
laws or whose assets were seized, blocked, frozen or ordered forfeited for
violation of money laundering or international anti-terrorism laws.
2] Court Declaration :
No records exist to suggest that subject is
or was the subject of any formal or informal allegations, prosecutions or other
official proceeding for making any prohibited payments or other improper payments
to government officials for engaging in prohibited transactions or with
designated parties.
3] Asset Declaration :
No records exist to suggest that the property or assets of the subject
are derived from criminal conduct or a prohibited transaction.
4] Record on Financial
Crime :
Charges or conviction
registered against subject: None
5] Records on Violation of
Anti-Corruption Laws :
Charges or
investigation registered against subject: None
6] Records on Int’l Anti-Money
Laundering Laws/Standards :
Charges or
investigation registered against subject: None
7] Criminal Records
No
available information exist that suggest that subject or any of its principals
have been formally charged or convicted by a competent governmental authority
for any financial crime or under any formal investigation by a competent
government authority for any violation of anti-corruption laws or international
anti-money laundering laws or standard.
8] Affiliation with
Government :
No record
exists to suggest that any director or indirect owners, controlling
shareholders, director, officer or employee of the company is a government
official or a family member or close business associate of a Government
official.
9] Compensation Package :
Our market
survey revealed that the amount of compensation sought by the subject is fair
and reasonable and comparable to compensation paid to others for similar
services.
10] Press Report :
No press reports / filings exists on
the subject.
CORPORATE GOVERNANCE
MIRA INFORM as part of its Due Diligence do provide comments on
Corporate Governance to identify management and governance. These factors often
have been predictive and in some cases have created vulnerabilities to credit
deterioration.
Our Governance Assessment focuses principally on the interactions
between a company’s management, its Board of Directors, Shareholders and other
financial stakeholders.
CONTRAVENTION
Subject is not known to have contravened any existing local laws, regulations
or policies that prohibit, restrict or otherwise affect the terms and
conditions that could be included in the agreement with the subject.
FOREIGN EXCHANGE RATES
|
Currency |
Unit
|
INR |
|
US Dollar |
1 |
INR 63.41 |
|
UK Pound |
1 |
INR 88.18 |
|
Euro |
1 |
INR 77.45 |
INFORMATION DETAILS
|
Information
Gathered by : |
SAV |
|
|
|
|
Analysis Done by
: |
PRS |
|
|
|
|
Report Prepared
by : |
BHG |
SCORE FACTORS
|
DEMERIT POINTS |
|
|
|
--BANK CHARGES |
YES/NO |
YES |
|
--LITIGATION |
YES/NO |
NO |
|
--OTHER ADVERSE INFORMATION |
YES/NO |
NO |
|
MERIT POINTS |
|
|
|
--SOLE DISTRIBUTORSHIP |
YES/NO |
NO |
|
--EXPORT ACTIVITIES |
YES/NO |
NO |
|
--AFFILIATION |
YES/NO |
YES |
|
--LISTED |
YES/NO |
YES |
|
--OTHER MERIT FACTORS |
YES/NO |
YES |
RATING EXPLANATIONS
|
Credit Rating |
Explanation |
Rating Comments |
|
A++ |
Minimum Risk |
Business dealings permissible with minimum
risk of default |
|
A+ |
Low Risk |
Business dealings permissible with low
risk of default |
|
A |
Acceptable Risk |
Business dealings permissible with
moderate risk of default |
|
B |
Medium Risk |
Business dealings permissible on a regular
monitoring basis |
|
C |
Medium High Risk |
Business dealings permissible preferably
on secured basis |
|
D |
High Risk |
Business dealing not recommended or on
secured terms only |
|
NB |
New Business |
No recommendation can be done due to
business in infancy stage |
|
NT |
No Trace |
No recommendation can be done as the
business is not traceable |
NB is stated where there is insufficient information to facilitate rating. However, it is not to be considered as unfavourable.
This score serves as a reference to assess
SC’s credit risk and to set the amount of credit to be extended. It is
calculated from a composite of weighted scores obtained from each of the major
sections of this report. The assessed factors are as follows:
·
Financial
condition covering various ratios
·
Company
background and operations size
·
Promoters
/ Management background
·
Payment
record
·
Litigation
against the subject
·
Industry
scenario / competitor analysis
·
Supplier
/ Customer / Banker review (wherever available)
This report is issued at
your request without any risk and responsibility on the part of MIRA INFORM
PRIVATE LIMITED (MIPL) or its officials.