|
|
|


MIRA INFORM REPORT
|
Report No. : |
485089 |
|
Report Date : |
18.01.2018 |
IDENTIFICATION DETAILS
|
Name : |
AT LEAST SA |
|
|
|
|
Registered Office : |
C/ Pantoja, 14. - Madrid - 28002 - Madrid |
|
|
|
|
Country : |
Spain |
|
|
|
|
Financials (as on) : |
2015 |
|
|
|
|
Date of Incorporation : |
09.06.1994 |
|
|
|
|
Legal Form : |
Public company |
|
|
|
|
Line of Business : |
Wholesale of textiles |
|
|
|
|
No. of Employees : |
Not available |
RATING & COMMENTS
(Mira Inform has adopted New Rating mechanism w.e.f. 23rd
January 2017)
|
MIRA’s Rating : |
D |
|
Credit Rating |
Explanation |
Rating Comments |
|
D |
High Risk |
Business dealing not recommended or on
secured terms only |
|
Status : |
Very close to insolvency |
|
|
|
|
Payment Behaviour : |
Slow and delayed |
|
|
|
|
Litigation : |
Clear |
NOTES :
Any query related to this report can be made
on e-mail : infodept@mirainform.com
while quoting report number, name and date.
ECGC Country Risk Classification List
|
Country Name |
Previous Rating (30.06.2017) |
Current Rating (30.09.2017) |
|
Spain |
A1 |
A1 |
|
Risk Category |
ECGC
Classification |
|
Insignificant |
A1 |
|
Low Risk |
A2 |
|
Moderately Low Risk |
B1 |
|
Moderate Risk |
B2 |
|
Moderately High Risk |
C1 |
|
High Risk |
C2 |
|
Very High Risk |
D |
SPAIN - ECONOMIC OVERVIEW
After experiencing a prolonged recession in the wake of the global financial crisis that began in 2008, in 2016 Spain marked the third full year of positive economic growth in nine years, largely due to increased private consumption. At the onset of the financial crisis, Spain's GDP contracted by 3.7% in 2009, ending a 16-year growth trend, and continued contracting through most of 2013. In that year, the government successfully shored up struggling banks - exposed to the collapse of Spain's depressed real estate and construction sectors - and in January 2014 completed an EU-funded restructuring and recapitalization program for its financial sector.
Until 2014, credit contraction in the private sector, fiscal austerity, and high unemployment weighed on domestic consumption and investment. The unemployment rate rose from a low of about 8% in 2007 to more than 26% in 2013, but labor reforms prompted a modest reduction to 19.7% in 2016. High unemployment has strained Spain's public finances, as spending on social benefits increased while tax revenues fell. Spain’s budget deficit peaked at 11.4% of GDP in 2010, but Spain gradually reduced the deficit to about 5% of GDP in 2015, and 4.1% of GDP in 2016. Public debt has increased substantially – from 60.1% of GDP in 2010 to nearly 99.5% in 2016.
Exports were resilient throughout the economic downturn and helped to bring Spain's current account into surplus in 2013 for the first time since 1986, where it remained through 2016. Rising labor productivity and an internal devaluation resulting from moderating labor costs and lower inflation have helped to improve foreign investor interest in the economy and positive FDI flows have been restored.
Political gridlock after the national elections in December
2015 and June 2016 and ensuing government formation process constrained the caretaker
government’s ability to implement needed labor, pension, health care, tax, and
education reforms— in 2016. The European Commission criticized Spain’s 2016
budget for easing austerity measures and for its alleged overly optimistic growth and deficit projections. Spain’s
borrowing costs are dramatically lower since their peak in mid-2012, and
despite the recent uptick in economic activity, inflation has dropped sharply,
from 1.5% in 2013 to a negative 0.3% in 2016.
|
Source
: CIA |
EXECUTIVE
SUMMARY
|
|
|
|
|
|
Name: |
AT
LEAST SA |
|
NIF
/ Fiscal code: |
A80915804 |
|
Status: |
ACTIVE |
|
Incorporation
Date: |
09/06/1994 |
|
Register Data |
Register
Section 8 Sheet 133581 |
|
Last Publication in BORME: |
10/10/2017
[Appointments] |
|
Last
Published Account Deposit: |
2015 |
|
Share
Capital: |
1.843.267 |
|
|
|
|
Localization: |
C/
PANTOJA, 14. - MADRID - 28002 - MADRID |
|
Telephone
- Fax - Email - Website: |
Telephone.
913993112 |
|
Number
of Branches |
21 |
|
|
|
|
Activity: |
|
|
NACE: |
4641
- Wholesale of textiles |
|
Registered
Trademarks: |
|
|
Audited
/ Opinion: |
Si
/ |
|
Tenders
and Awards: |
|
|
Subsidies: |
0
for a total cost of 0 |
|
Quality
Certificate: |
No |
|
|
|
|
|
|
|
Defaults, Legal Claims and Insolvency
Proceedings : |
|
|
|
|
|
|
|
Number |
Amount
(€) |
Most
Recent Entry |
|
Insolvency
Proceedings, Bankruptcy and Suspension of Payments |
|
Unpublished |
--- |
--- |
|
Defaults
on debt with Financial Institutions and Large Companies |
|
10 |
682.591,06 |
--- |
|
Judicial
Claims (Notices, Executive Proceedings, Attachments, Auctions, Bad Debt) |
|
4 |
0 |
--- |
|
Proceedings
heard by the Civil Court |
|
Unpublished |
0 |
--- |
|
Proceedings
heard by the Labour Court |
|
1 |
0 |
--- |
|
|
|
Partners: |
|
|
|
COBEGA
BV (PAISES BAJOS) |
30.43
% |
|
|
EXPLOTACIONES
AGRARIAS LAS MESAS SL |
10.45
% |
|
|
JAVERTRANS
BV (PAISES BAJOS) |
35.51
% |
|
|
Shares: |
4 |
|
|
Other
Links: |
2 |
|
|
No.
of Active Corporate Bodies: |
CHIEF
EXECUTIVE OFFICER 1 |
|
|
Ratios |
2015 |
2014 |
Change |
|
|
|
|
|
Guarantees: |
|
|
Properties
Registered: |
Company
NO, Administrator NO |
|
Financing
/ Guarantee Sources : |
Sources
YES, Guarantees YES |
|
|
|
|
INVESTIGATION
SUMMARY |
|
|
|
|
|
Enquiry Details |
|
|
|
Identification
|
|
|
Social Denomination: |
AT LEAST SA |
|
NIF / Fiscal code: |
A80915804 |
|
Corporate Status: |
ACTIVE |
|
Start of activity: |
1994 |
|
Registered Office: |
C/ PANTOJA, 14. |
|
Locality: |
MADRID |
|
Province: |
MADRID |
|
Postal Code: |
28002 |
|
Telephone: |
913993112 |
|
Fax: |
913391953 |
|
|
|
|
Branch
Offices
|
|
|
|
|
|
Address |
Postal Code |
City |
Province |
|
CALLE LA PAZ 999 |
01004 |
VITORIA-GASTEIZ |
ALAVA |
|
AVENIDA DIAGONAL 557 30 4 |
08029 |
BARCELONA |
BARCELONA |
|
CALLE GRACIA 89 |
08008 |
BARCELONA |
BARCELONA |
|
CALLE INDUSTRIAL CAN MASSAGUER 15 B |
08430 |
ROCA DEL VALLES (LA) |
BARCELONA |
|
PLAZA LUGO 12 |
15004 |
CORUÑA (A) |
LA CORUÑA |
|
CALLE FUENCARRAL 16 |
28004 |
MADRID |
MADRID |
|
CALLE JOSE ABASCAL 55 |
28003 |
MADRID |
MADRID |
|
CALLE JAVIER FERRERO 12 1 B |
28002 |
MADRID |
MADRID |
|
CALLE SERRANO 18 |
28001 |
MADRID |
MADRID |
|
CALLE TETUAN 19 |
28013 |
MADRID |
MADRID |
|
CALLE JUAN RAMON JIMENEZ 3 |
28232 |
ROZAS DE MADRID (LAS) |
MADRID |
|
PLAZA CONSTITUCION 3 |
29005 |
MALAGA |
MALAGA |
|
CALLE SERRANO ALCAZAR 1 |
30001 |
MURCIA |
MURCIA |
|
CALLE DEAN POLO BENITO 3 |
37002 |
SALAMANCA |
SALAMANCA |
|
CALLE O'DONNELL 16 |
41001 |
SEVILLA |
SEVILLA |
|
CALLE COLON 66 |
46004 |
VALENCIA |
VALENCIA |
|
CALLE HEROES DE ALCANTARA 3 |
47001 |
VALLADOLID |
VALLADOLID |
|
CALLE ELCANO 13 PB |
48008 |
BILBAO |
VIZCAYA |
|
GRAN VIA GRAN DIEGO LOPEZ DE HARO 15 U PB 2I |
48001 |
BILBAO |
VIZCAYA |
|
PARQUE VP COMERCIAL ARTEA 33 |
48940 |
LEIOA |
VIZCAYA |
|
CALLE SAN IGNACIO DE LOYOLA 1 LC |
50008 |
ZARAGOZA |
ZARAGOZA |
|
|
|
|
|
|
Activity
|
|
|
NACE: |
4641 |
|
Corporate Purpose: |
DISEÑO, FABRICACION,
IMPORTACION, EXPORTACION, COMPRAVENTA Y DISTRIBUCION DE PRENDAS Y COMPLEMENTOS
DE VESTIR, EN SU MAS AMPLIO SENTIDO. |
|
Additional Information: |
Plant, warehouse and
offices located on |
|
Import / export: |
EXPORTS |
|
|
|
|
Chronological
Summary
|
|||
|
|
|
|
|
|
|
Year |
Act |
|
|
|
1994 |
Appointments/ Re-elections (1) Company Formation (1) |
|
|
|
1995 |
Accounts deposit (year 1994) Appointments/ Re-elections (1) Change of
Social address (1) |
|
|
|
1996 |
Accounts deposit (year 1995) Increase of Capital (1) |
|
|
|
1997 |
Accounts deposit (year 1996) Change of Social address (1) Increase of
Capital (1) Statutory Modifications (1) |
|
|
|
1998 |
Accounts deposit (year 1997) Appointments/ Re-elections (1)
Cessations/ Resignations/ Reversals (1) Increase of Capital (1) |
|
|
|
1999 |
Accounts deposit (year 1998) |
|
|
|
2000 |
Accounts deposit (year 1999) Appointments/ Re-elections (2)
Cessations/ Resignations/ Reversals (1) |
|
|
|
2001 |
Appointments/ Re-elections (3) Cessations/ Resignations/ Reversals (1) |
|
|
|
2002 |
Accounts deposit (year 2000) Appointments/ Re-elections (1)
Cessations/ Resignations/ Reversals (1) Increase of Capital (1) |
|
|
|
2003 |
Accounts deposit (year 2001, 2002) Appointments/ Re-elections (5)
Cessations/ Resignations/ Reversals (2) Increase of Capital (1) Statutory
Modifications (1) |
|
|
|
2004 |
Accounts deposit (year 2003) Appointments/ Re-elections (1) Increase of
Capital (1) |
|
|
|
2005 |
Accounts deposit (year 2004) |
|
|
|
2006 |
Appointments/ Re-elections (3) |
|
|
|
2007 |
Accounts deposit (year 2005) Appointments/ Re-elections (1) |
|
|
|
2008 |
Accounts deposit (year 2006, 2007) Appointments/ Re-elections (4)
Board Meeting (1) Cessations/ Resignations/ Reversals (2) |
|
|
|
2009 |
Accounts deposit (year 2007 consolidated) Appointments/ Re-elections (1)
Cessations/ Resignations/ Reversals (1) |
|
|
|
2010 |
Accounts deposit (year 2009 consolidated, 2008, 2009) Appointments/
Re-elections (3) Change of Social address (1) |
|
|
|
2011 |
Accounts deposit (year 2010) Board Meeting (1) |
|
|
|
2012 |
Accounts deposit (year 2010 consolidated, 2011) Appointments/
Re-elections (2) |
|
|
|
2013 |
Accounts deposit (year 2011 consolidated, 2012 consolidated)
Appointments/ Re-elections (2) Cessations/ Resignations/ Reversals (1) Other Concepts/
Events (1) Statutory Modifications (1) |
|
|
|
2014 |
Accounts deposit (year 2013 consolidated, 2012, 2013) Cessations/
Resignations/ Reversals (2) |
|
|
|
2015 |
Accounts deposit (year 2014 consolidated, 2014) Appointments/ Re-elections
(4) Cessations/ Resignations/ Reversals (2) |
|
|
|
2016 |
Accounts deposit (year 2015 consolidated) Appointments/ Re-elections
(1) Cessations/ Resignations/ Reversals (1) |
|
|
|
2017 |
Accounts deposit (year 2015) Appointments/ Re-elections (2) Increase
of Capital (1) Other Concepts/ Events (1) |
|
|
|
|
|
|
|
Breakdown
of Owners' Equity
|
|
|
Registered Capital: |
1.843.267 |
|
Paid up capital: |
1.843.267 |
|
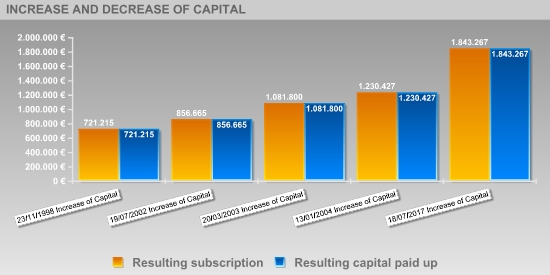
Updated Evolution of the Subscribed and Paid-in Capital |
|||||
|
|
|
|
|
|
|
|
|
|||||
|
|
|
|
|
|
|
|
Publishing Date |
Registration Type |
Capital Subscribed |
Paid up capital |
Underwritten result |
Disbursed Result |
|
18/07/1994 |
Company Formation |
60.101 |
60.101 |
60.101 |
60.101 |
|
27/05/1996 |
Increase of Capital |
66.111 |
66.111 |
126.213 |
126.213 |
|
13/05/1997 |
Increase of Capital |
54.091 |
54.091 |
180.304 |
180.304 |
|
23/11/1998 |
Increase of Capital |
540.911 |
540.911 |
721.215 |
721.215 |
|
19/07/2002 |
Increase of Capital |
135.465 |
135.465 |
856.665 |
856.665 |
|
20/03/2003 |
Increase of Capital |
225.135 |
225.135 |
1.081.800 |
1.081.800 |
|
13/01/2004 |
Increase of Capital |
148.627 |
148.627 |
1.230.427 |
1.230.427 |
|
18/07/2017 |
Increase of Capital |
612.840 |
612.840 |
1.843.267 |
1.843.267 |
|
|
|
|
|
|
|
|
Active
Social Bodies
|
|
|
|
|
|
Post published |
Social Body's Name |
Appointment Date |
Other Positions in this Company |
|
PRESIDENT |
HERNANDEZ DURAN CONSTANTINO |
19/08/2013 |
15 |
|
MEMBER OF THE BOARD |
VEGA WERLEN EDUARDO |
19/08/2013 |
1 |
|
|
VALERO QUIROS JUAN CARLOS |
19/08/2013 |
10 |
|
|
MAIER ALLENDE CARLOS |
19/08/2013 |
4 |
|
|
HERNANDEZ DURAN CONSTANTINO |
19/08/2013 |
15 |
|
|
FAGALDE MATEOS IGNACIO JOSE |
19/08/2013 |
2 |
|
PROXY |
ALGUACIL AMORES RAFAEL |
02/10/2017 |
1 |
|
|
SUAREZ CANTON PEÑA NICOLAS RAFAEL |
02/12/2016 |
1 |
|
|
GARCIA FERNANDEZ CRISTINA |
12/05/2015 |
2 |
|
|
VERA ZAMBRANA ANTONIO |
29/04/2015 |
1 |
|
|
RODRIGUEZ POZO ANTONIO |
07/06/2002 |
1 |
|
|
VALERO QUIROS JUAN CARLOS |
24/03/2000 |
10 |
|
CHIEF EXECUTIVE OFFICER |
HERNANDEZ DURAN CONSTANTINO |
19/08/2013 |
15 |
|
SECRETARY |
VALERO QUIROS JUAN CARLOS |
19/08/2013 |
10 |
|
ACCOUNTS' AUDITOR / HOLDER |
KPMG AUDITORES SL |
17/01/2017 |
22 |
|
CONSOLIDATED ACCOUNTS' AUDITOR |
KPMG AUDITORES SL |
17/01/2017 |
22 |
|
|
|
|
|
|
Historical
Social Bodies
|
|
|
|
|
|
Social Body's Name |
Post published |
End Date |
Other Positions in this Company |
|
ABITBOL OEVERMANN RAFAEL |
MEMBER OF THE BOARD |
09/10/2008 |
4 |
|
|
MEMBER OF THE BOARD |
19/08/2013 |
|
|
|
MEMBER OF THE BOARD |
25/02/2014 |
|
|
|
PROXY |
16/06/2014 |
|
|
BARRANCA PITEL MANUEL |
PROXY |
29/04/2015 |
1 |
|
BERGEL SAINZ DE BARANDA JAIME ISIDORO |
MEMBER OF THE BOARD |
09/10/2008 |
3 |
|
|
MEMBER OF THE BOARD |
19/08/2013 |
|
|
|
MEMBER OF THE BOARD |
11/11/2015 |
|
|
BONILLA VILLALONGA NICOLAS |
MEMBER OF THE BOARD |
30/08/2002 |
1 |
|
DE SALVADOR Y ARANA DIEGO |
PROXY |
02/12/2016 |
1 |
|
DE VILLAR DE LOS SANTOS CRISTINA |
MEMBER OF THE BOARD |
18/11/1998 |
6 |
|
|
JOINT CHIEF EXECUTIVE OFFICER |
18/11/1998 |
|
|
|
SECRETARY |
18/11/1998 |
|
|
|
SECRETARY |
09/03/2000 |
|
|
|
JOINT CHIEF EXECUTIVE OFFICER |
23/01/2001 |
|
|
|
MEMBER OF THE BOARD |
23/01/2001 |
|
|
FAGALDE MATEOS IGNACIO |
MEMBER OF THE BOARD |
18/11/1998 |
1 |
|
FAGALDE MATEOS IGNACIO JOSE |
MEMBER OF THE BOARD |
19/08/2013 |
2 |
|
GARCIA FERNANDEZ CRISTINA |
PROXY |
12/05/2015 |
2 |
|
GUILLAMOT BERNARDO ANDRES |
MEMBER OF THE BOARD |
17/10/2003 |
2 |
|
|
MEMBER OF THE BOARD |
19/09/2008 |
|
|
HERNANDEZ DURAN CONSTANTINO |
MEMBER OF THE BOARD |
18/11/1998 |
15 |
|
|
MEMBER OF THE BOARD |
17/10/2003 |
|
|
|
MEMBER OF THE BOARD |
09/10/2008 |
|
|
|
MEMBER OF THE BOARD |
19/08/2013 |
|
|
|
JOINT CHIEF EXECUTIVE OFFICER |
18/11/1998 |
|
|
|
PRESIDENT |
18/11/1998 |
|
|
|
PRESIDENT |
17/10/2003 |
|
|
|
JOINT CHIEF EXECUTIVE OFFICER |
17/10/2003 |
|
|
|
CHIEF EXECUTIVE OFFICER |
09/10/2008 |
|
|
|
PRESIDENT |
09/10/2008 |
|
|
|
PRESIDENT |
19/08/2013 |
|
|
|
CHIEF EXECUTIVE OFFICER |
19/08/2013 |
|
|
KPMG AUDITORES SL |
ACCOUNTS' AUDITOR / HOLDER |
06/09/2004 |
22 |
|
|
ACCOUNTS' AUDITOR / HOLDER |
11/01/2006 |
|
|
|
ACCOUNTS' AUDITOR / HOLDER |
16/10/2006 |
|
|
|
ACCOUNTS' AUDITOR / HOLDER |
09/10/2008 |
|
|
|
ACCOUNTS' AUDITOR / HOLDER |
20/05/2003 |
|
|
|
CONSOLIDATED ACCOUNTS' AUDITOR |
27/10/2008 |
|
|
|
ACCOUNTS' AUDITOR / HOLDER |
27/10/2008 |
|
|
|
ACCOUNTS' AUDITOR / HOLDER |
04/10/2010 |
|
|
|
ACCOUNTS' AUDITOR / HOLDER |
15/11/2010 |
|
|
|
CONSOLIDATED ACCOUNTS' AUDITOR |
15/11/2010 |
|
|
|
CONSOLIDATED ACCOUNTS' AUDITOR |
11/04/2012 |
|
|
|
ACCOUNTS' AUDITOR / HOLDER |
11/04/2012 |
|
|
|
ACCOUNTS' AUDITOR / HOLDER |
12/11/2012 |
|
|
|
CONSOLIDATED ACCOUNTS' AUDITOR |
12/11/2012 |
|
|
|
CONSOLIDATED ACCOUNTS' AUDITOR |
17/01/2017 |
|
|
|
ACCOUNTS' AUDITOR / HOLDER |
17/01/2017 |
|
|
|
CONSOLIDATED ACCOUNTS' AUDITOR |
03/10/2013 |
|
|
|
ACCOUNTS' AUDITOR / HOLDER |
03/10/2013 |
|
|
|
ACCOUNTS' AUDITOR / HOLDER |
09/02/2015 |
|
|
|
CONSOLIDATED ACCOUNTS' AUDITOR |
09/02/2015 |
|
|
LOHR MARCUS HERMANN VALENTIN |
PROXY |
10/02/2009 |
1 |
|
LOPEZ GARCIA CARLOS |
PROXY |
28/11/2001 |
2 |
|
|
PROXY |
04/11/2003 |
|
|
MAIER ALLENDE CARLOS |
MEMBER OF THE BOARD |
17/10/2003 |
4 |
|
|
MEMBER OF THE BOARD |
09/10/2008 |
|
|
|
MEMBER OF THE BOARD |
19/08/2013 |
|
|
VALERO QUIROS JUAN CARLOS |
MEMBER OF THE BOARD |
17/10/2003 |
10 |
|
|
SECRETARY |
17/10/2003 |
|
|
|
MEMBER OF THE BOARD |
09/10/2008 |
|
|
|
MEMBER OF THE BOARD |
09/03/2000 |
|
|
|
MEMBER OF THE BOARD |
19/08/2013 |
|
|
|
SECRETARY |
09/10/2008 |
|
|
|
SECRETARY |
19/08/2013 |
|
|
VEGA WERLER EDUARDO |
MEMBER OF THE BOARD |
19/08/2013 |
3 |
|
|
MEMBER OF THE BOARD |
17/10/2003 |
|
|
|
MEMBER OF THE BOARD |
09/10/2008 |
|
|
|
|
|
|
|
Executive
board
|
||
|
|
|
|
|
Post |
NIF |
Name |
|
COMPUTER SCIENCE DIRECTOR |
|
RICARDO FUSTER JUMQUERA |
|
FINANCIAL DIRECTOR |
|
DIEGO SALVADOR |
|
MANAGING DIRECTOR |
|
RAFAEL ABITBOL OVERMAN |
|
|
|
|
|
Defaults, Legal Claims and Insolvency Proceedings |
|
|
|
|
Section enabling assessment of the degree of compliance of the company
queried with its payment obligations. It provides information on the existence and
nature of all stages of Insolvency and Legal Proceedings published with
reference to the Company in the country's various Official Bulletins and
national newspapers, as well Defaults Registered in the main national credit
bureaus (ASNEF Industrial and RAI )
Chronological
summary
|
|
|
Number
of Publications |
Amount
(€) |
Start
date |
End
date |
|
Insolvency
Proceedings, Bankruptcy and Suspension of Payments |
|
Unpublished |
--- |
--- |
--- |
|
Request/Declaration |
|
0 |
--- |
date |
|
|
Proceedings |
|
--- |
--- |
|
--- |
|
Resolution |
|
--- |
--- |
|
--- |
|
Defaults
on debt with Financial Institutions and Large Companies |
Bank
and Commercial Delinquency |
10 |
0 |
28/03/2017 |
08/01/2018 |
|
Status:
Friendly |
|
10 |
682591.06 |
28/03/2017 |
04/07/2017 |
|
Status:
Pre-Litigation |
|
--- |
|
|
|
|
Status:
Litigation |
|
--- |
|
|
|
|
Status:
Non-performing |
|
--- |
|
|
|
|
Status:
insolvency proceedings, bankruptcy and suspension of payments |
|
--- |
|
|
|
|
Other
status |
|
--- |
|
|
|
|
Legal
and Administrative Proceedings |
|
4 |
--- |
04/05/2012 |
18/07/2017 |
|
Notices
of defaults and enforcement |
|
4 |
--- |
|
--- |
|
Seizures |
|
--- |
--- |
|
--- |
|
Auctions |
|
--- |
--- |
|
--- |
|
Declarations
of insolvency and bad debt |
|
--- |
--- |
|
--- |
|
Proceedings
heard by the Civil Court |
|
Unpublished |
--- |
|
|
|
Proceedings
heard by the Labour Court |
|
1 |
--- |
01/06/2016 |
01/06/2016 |
IMPAGOS
EN ENTIDADES FINANCIERAS Y GRANDES EMPRESAS
Section comprising a list of the instances of default recorded in the
ASNEF Industrial file under the name of .
|
All contract defaults are in amicable debt collection status; the
creditor entities have not initiated legal action for recovery. The total unpaid amount registered with ASNEF Empresas is the maximum
one among all of this debtor's reported defaults available. It must be noted that the total unpaid amount registered with ASNEF
Empresas has increased by 167.59% in the past six months. Indicate that the total unpaid amount involve contracts with the
financial system. |
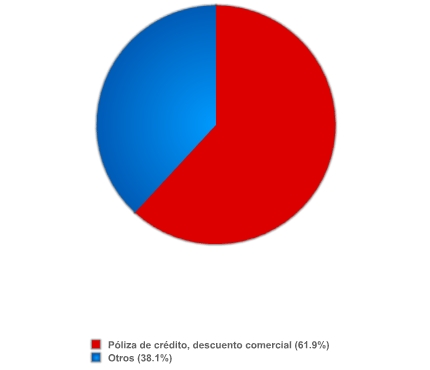
List
of current instances of default for each of the transactions in progress
|
Type
of creditor |
Product |
Value
of transactions (€) |
Status |
No.
of defaults |
Default
balance (€) |
Date
of first default |
Date
of last default |
|
COOPERATIVAS
DE CREDITO |
Póliza
de crédito, descuento comercial |
--- |
Amistoso |
1 |
422357.14 |
04/07/17 |
04/07/17 |
|
COOPERATIVAS
DE CREDITO |
Otros |
--- |
Amistoso |
--- |
151360.56 |
31/03/17 |
31/03/17 |
|
COOPERATIVAS
DE CREDITO |
Otros |
--- |
Amistoso |
--- |
40954.41 |
31/03/17 |
31/03/17 |
|
COOPERATIVAS
DE CREDITO |
Otros |
--- |
Amistoso |
--- |
18391.65 |
31/03/17 |
31/03/17 |
|
COOPERATIVAS
DE CREDITO |
Otros |
--- |
Amistoso |
--- |
13103.94 |
31/03/17 |
31/03/17 |
|
COOPERATIVAS
DE CREDITO |
Otros |
--- |
Amistoso |
--- |
11149.62 |
30/03/17 |
30/03/17 |
|
COOPERATIVAS
DE CREDITO |
Otros |
--- |
Amistoso |
--- |
9877.08 |
31/03/17 |
31/03/17 |
|
COOPERATIVAS
DE CREDITO |
Otros |
--- |
Amistoso |
--- |
5200.50 |
28/03/17 |
28/03/17 |
|
COOPERATIVAS
DE CREDITO |
Otros |
--- |
Amistoso |
--- |
5146.42 |
03/04/17 |
03/04/17 |
|
COOPERATIVAS
DE CREDITO |
Otros |
--- |
Amistoso |
--- |
5049.74 |
31/03/17 |
31/03/17 |
|
|
|
682.591,06 |
|
|
|
||
|
|
Default
by product
|
|
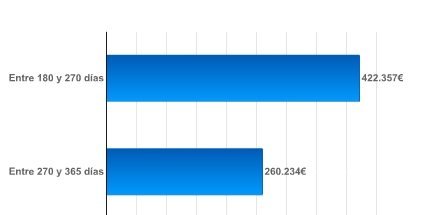
Age
of current debt
|
|
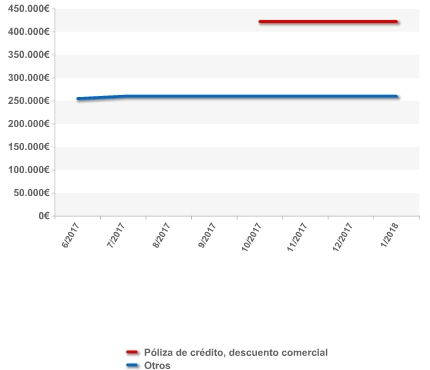
Change
in values of defaults and settled debts
|
Changes
in defaults by status |
Changes
in defaults by product
|
|
Change
in values of defaults and settled debts
|
Legal
Notice:
This
data has been obtained from consultation of the ASNEF Industrial register. It
may only be used for the purposes of awarding credit, monitoring credit and
managing loans. This data may not be reused or included in any database, and
may not be ceded .
Basis
for scoring
|
Positive Factors |
Adverse Factors |
|
|
It has been found to have irregular payment performance at the credit
bureaus and has not paid all of its debts in a timely manner. It does not have any economic profitability.. It has no return from the
necessary investments in the development of its main activity in comparison
with its assets. It does not have any financial profitability.. AT LEAST SAIt does not
obtain any financial return as a consequence of an investment in its own
resources which, a priori, might deteriorate its financial and economic
situation. Debts assumed by the company based on the volume of its own resources
have increased in the previous financial year. No Company's subsidiaries or branches are known. |
Probability
of default
|
> Estimated Probability of Default for the next 12 months: 62.857 %
|
Sector in which comparison is carried out: 464 Wholesale of household goods |
|
|
Relative Position:
|
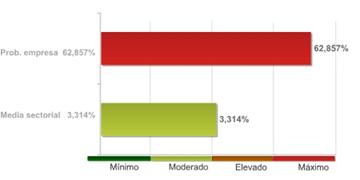
The company's comparative analysis with the rest of the companies that comprise the sector, shows the company holds a worse position with regard to the probability of non-compliance.
The 1.00% of the companies of the sector AT LEAST SA belongs to shows a lower probability of non-compliance.
The probability of the company's non-compliance with its payment obligations within deadlines estimated by our qualifications models is 62,857%.
In the event they fail to comply with the payment, the seriousness of the loss will depend on factors such as the promptness of the commencement of the charging management, the existence of executive documents which match the credit or the existence of guarantees and free debt assets under the name of the debtor. Therefore, the probability of non-compliance should not be solely interpreted as the total loss of the owed amount.
|
Result of query submitted to the
R.A.I. (Spanish Bad Debt Register) on |
|
|
LEGAL
CLAIMS
|
|
Summary
of Judicial Claims |
|
|
|
|
|
|
|
|
||
|
|
|
Not
published |
|
|
|
|
Not
published |
|
|
|
|
||
|
|
|
Not
published |
|
|
|
|
Not
published |
|
|
|
|
Not
published |
|
|
|
|
4
Legal Claims whose amounts have not been published |
|
|
|
|
||
|
|
|
Not
published |
|
|
|
|
Not
published |
|
|
|
|
||
|
|
|
1
Incidence the amount of which has not been published |
|
|
Incidences
Detailed |
|
Incidences
with the Local Administration |
|
|
|
Last
Published Stage: |
EXECUTION
NOTIFICATION |
|
Record
Number: |
20174801101RT09L000019 |
|
Requested
by: |
ADMINISTRACION
LOCAL |
|
Published
domicile: |
(DESCONOCIDA) |
|
Source: |
B.O.E.
Nº177, 2017 SUPLEMENTO 1 PAGINA 3737 |
|
|
|
Last
Published Stage: |
INFRINGEMENT
|
|
Record
Number: |
183/2016/00384 |
|
Requested
by: |
ADMINISTRACION
LOCALMADRID |
|
Published
domicile: |
MADRID |
|
Source: |
B.O.E.
Nº133, 2016 SUPLEMENTO 1 PAGINA 4480 |
|
|
|
Last
Published Stage: |
EXECUTION
NOTIFICATION |
|
Record
Number: |
8920009282572 |
|
Requested
by: |
ADMINISTRACION
LOCAL |
|
Published
domicile: |
(DESCONOCIDA) |
|
Source: |
B.O.P.
LEON Nº69, 2015 PAGINA 13 |
|
|
|
Last
Published Stage: |
EXECUTION
NOTIFICATION |
|
Record
Number: |
12117008651 |
|
Requested
by: |
ADMINISTRACION
LOCAL |
|
Published
domicile: |
(DESCONOCIDA) |
|
Source: |
BOLETIN
OFICIAL DEL AYUNTAMIENTO DE MADRID Nº6668, 2012 PAGINA 632 |
|
Guarantees |
|
References |
|
|
|
|
|
Link
List
|
|
IS RELATED WITH: |
2 Entities |
|
PARTICIPATES IN: |
4 Entities |
|
SHAREHOLDERS: |
3 Entities |
> Shareholders
|
Relationship |
Entity |
Province |
Shareholding stake |
|
SHAREHOLDERS |
COBEGA BV (PAISES BAJOS) |
|
30.43 |
|
|
EXPLOTACIONES AGRARIAS LAS
MESAS SL |
MADRID |
10.45 |
|
|
JAVERTRANS BV (PAISES
BAJOS) |
|
35.51 |
|
PARTICIPATES IN |
CLOTHES & DRESSES,
SOCIEDAD ANONIMA, (REINO UNIDO) |
|
100 |
|
|
AT LEAST DEUTCHLAND, SOCIEDAD
ANONIMA, (ALEMANIA) |
|
100 |
|
|
AT LEAST ITALIA, SOCIEDAD
LIMITADA, (ITALIA) |
|
100 |
|
|
AT LEAST USA LLC (ESTADOS
UNIDOS) |
|
100 |
> Other relationships
|
Relationship |
Entity |
Province |
Shareholding stake |
|
IS RELATED WITH |
| | |
|
|
|
|
AT LEAST USA LLC |
|
|
|
IS RELATED WITH |
MULTIMEGA SA |
MADRID |
|
|
|
|
|
|
|
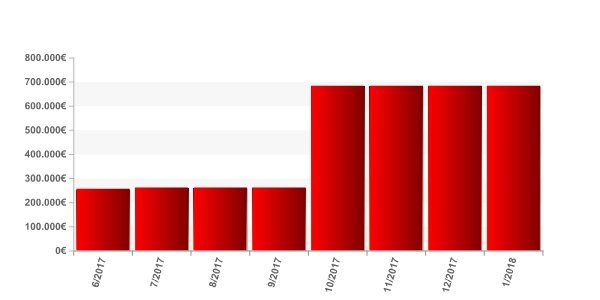
Turnover
|
|
|
Total Sales |
43.712.899 |
The sales data is from the latest
available financial statements. Failing that, are estimates data calculated by
statistical methods.
|
Financial
Accounts and Balance Sheets
|
|
|
|
|
|
Ejercicio |
Tipo
de Cuentas Anuales |
Fecha
Presentacion |
|
2015 |
Consolidadas |
October
2016 |
|
2015 |
Normales |
February
2017 |
|
2014 |
Consolidadas |
October
2015 |
|
2014 |
Normales |
October
2015 |
|
2013 |
Consolidadas |
October
2014 |
|
2013 |
Normales |
November
2014 |
|
2012 |
Consolidadas |
November
2013 |
|
2012 |
Normales |
April
2014 |
|
2011 |
Consolidadas |
February
2013 |
|
2011 |
Normales |
August
2012 |
|
2010 |
Consolidadas |
July
2012 |
|
2010 |
Normales |
December
2011 |
|
2009 |
Consolidadas |
December
2010 |
|
2009 |
Normales |
December
2010 |
|
2008 |
Consolidadas |
No
publicado en BORME |
|
2008 |
Normales |
December
2009 |
|
2007 |
Consolidadas |
June
2009 |
|
2007 |
Normales |
November
2008 |
|
2006 |
Normales |
March
2008 |
|
2005 |
Normales |
January
2007 |
|
2004 |
Normales |
October
2005 |
|
2003 |
Normales |
August
2004 |
|
2002 |
Normales |
August
2003 |
|
2001 |
Normales |
March
2003 |
|
2000 |
Normales |
September
2001 |
|
1999 |
Normales |
October
2000 |
|
1998 |
Normales |
October
1999 |
|
1997 |
Normales |
October
1998 |
|
1996 |
Normales |
September
1997 |
|
1995 |
Normales |
December
1996 |
|
1994 |
Normales |
September
1995 |
The data in the report regarding the
last Company Accounts submitted by the company is taken from the TRADE REGISTER
serving the region in which the company's address is located 31/12/2015
>
Normal format Balance in accordance with the New Accounting Plan 2007
Information corresponding to the
fiscal year 2015 2014 2013 2012 2011 is taken from
information submitted to the TRADE REGISTER. Data corresponding to fiscal years
before 2015 2014 2013 2012 2011 has been compiled
based on the equivalence criteria stipulated in Act JUS/206/2009. Where the
provisions of the Act did not establish relevant equivalence criteria. To view
details on the methodology.
|
|
ORIGINAL |
ORIGINAL |
ORIGINAL |
ORIGINAL |
ORIGINAL |
|
|
Assets |
2015 |
2014 |
2013 |
2012 |
2011 |
|
|
A)
NON-CURRENT ASSETS: 11000 |
12.317.380,00 |
11.061.524,00 |
13.903.569,00 |
10.933.467,00 |
10.951.635,00 |
|
|
I. Intangible fixed assets : 11100 |
2.843.541,00 |
1.787.985,00 |
637.428,00 |
774.126,00 |
737.629,00 |
|
|
1. Development: 11110 |
0,00 |
0,00 |
0,00 |
0,00 |
0,00 |
|
|
2. Concessions: 11120 |
0,00 |
0,00 |
0,00 |
0,00 |
0,00 |
|
|
3. Patents, licencing, trade marks and
similar: 11130 |
0,00 |
0,00 |
0,00 |
0,00 |
0,00 |
|
|
4. Goodwill: 11140 |
0,00 |
0,00 |
0,00 |
0,00 |
0,00 |
|
|
5. IT applications: 11150 |
91.350,00 |
178.203,00 |
232.145,00 |
318.392,00 |
190.139,00 |
|
|
6. Investigation: 11160 |
0,00 |
0,00 |
0,00 |
0,00 |
0,00 |
|
|
7. Intellectual property: 11180 |
0,00 |
0,00 |
0,00 |
0,00 |
0,00 |
|
|
8. Greenhouse gas emission allowance:
11190 |
0,00 |
0,00 |
0,00 |
0,00 |
0,00 |
|
|
9. Other intangible fixed assets. :
11170 |
2.752.191,00 |
1.609.782,00 |
405.283,00 |
455.734,00 |
547.490,00 |
|
|
II. Tangible fixed assets : 11200 |
3.648.976,00 |
3.713.470,00 |
3.936.275,00 |
4.107.588,00 |
4.668.464,00 |
|
|
1. Land and buildings: 11210 |
0,00 |
0,00 |
0,00 |
0,00 |
0,00 |
|
|
2. Technical installations and other
tangible fixed assets: 11220 |
3.563.809,00 |
3.675.352,00 |
3.935.714,00 |
3.967.751,00 |
4.359.907,00 |
|
|
3. Tangible asset in progress and
advances: 11230 |
85.167,00 |
38.118,00 |
561,00 |
139.837,00 |
308.557,00 |
|
|
III. Real estate investment: 11300 |
0,00 |
0,00 |
0,00 |
0,00 |
0,00 |
|
|
1. Land: 11310 |
0,00 |
0,00 |
0,00 |
0,00 |
0,00 |
|
|
2. Buildings: 11320 |
0,00 |
0,00 |
0,00 |
0,00 |
0,00 |
|
|
IV. Long-term investments in Group companies and associates :
11400 |
4.038.432,00 |
3.977.898,00 |
6.732.079,00 |
3.730.462,00 |
4.634.674,00 |
|
|
1. Equity instruments: 11410 |
2.007.617,00 |
3.070.547,00 |
5.386.703,00 |
3.730.462,00 |
4.634.674,00 |
|
|
2. Credits to businesses: 11420 |
2.030.815,00 |
907.351,00 |
1.345.376,00 |
0,00 |
0,00 |
|
|
3. Debt securities: 11430 |
0,00 |
0,00 |
0,00 |
0,00 |
0,00 |
|
|
4. Derivatives : 11440 |
0,00 |
0,00 |
0,00 |
0,00 |
0,00 |
|
|
5. Other financial assets : 11450 |
0,00 |
0,00 |
0,00 |
0,00 |
0,00 |
|
|
6. Other investments: 11460 |
0,00 |
0,00 |
0,00 |
0,00 |
0,00 |
|
|
V. Long-term financial investments: 11500 |
778.101,00 |
735.010,00 |
710.481,00 |
764.944,00 |
639.934,00 |
|
|
1. Equity instruments: 11510 |
0,00 |
0,00 |
0,00 |
0,00 |
0,00 |
|
|
2. Credits to third parties : 11520 |
0,00 |
0,00 |
0,00 |
0,00 |
0,00 |
|
|
3. Debt securities: 11530 |
0,00 |
0,00 |
0,00 |
0,00 |
0,00 |
|
|
4. Derivatives : 11540 |
61.488,00 |
0,00 |
0,00 |
0,00 |
0,00 |
|
|
5. Other financial assets : 11550 |
716.613,00 |
735.010,00 |
710.481,00 |
764.944,00 |
639.934,00 |
|
|
6. Other investments: 11560 |
0,00 |
0,00 |
0,00 |
0,00 |
0,00 |
|
|
VII. Non-current trade debts : 11700 |
0,00 |
0,00 |
0,00 |
0,00 |
0,00 |
|
|
VI. Assets for deferred tax : 11600 |
1.008.330,00 |
847.161,00 |
1.887.306,00 |
1.556.347,00 |
270.934,00 |
|
|
B)
CURRENT ASSETS: 12000 |
20.716.547,00 |
20.733.671,00 |
16.988.684,00 |
18.906.063,00 |
18.364.689,00 |
|
|
I. Non-current assets held for sale : 12100 |
0,00 |
0,00 |
0,00 |
0,00 |
0,00 |
|
|
II. Stocks: 12200 |
9.292.616,00 |
9.850.485,00 |
8.854.872,00 |
8.845.220,00 |
8.811.100,00 |
|
|
1. Commercial: 12210 |
9.249.835,00 |
9.765.445,00 |
8.707.832,00 |
8.766.978,00 |
8.654.933,00 |
|
|
2. Primary material and other supplies:
12220 |
42.781,00 |
85.040,00 |
147.040,00 |
76.200,00 |
153.868,00 |
|
|
a) Long-term primary
material and other supplies: 12221 |
0,00 |
0,00 |
0,00 |
0,00 |
0,00 |
|
|
b) Short-term primary
material and other supplies: 12222 |
0,00 |
0,00 |
0,00 |
0,00 |
0,00 |
|
|
3. Work in progress: 12230 |
0,00 |
0,00 |
0,00 |
0,00 |
0,00 |
|
|
a) Of long-term
production cycle : 12231 |
0,00 |
0,00 |
0,00 |
0,00 |
0,00 |
|
|
b) Of short-term
production cycle : 12232 |
0,00 |
0,00 |
0,00 |
0,00 |
0,00 |
|
|
4. Finished goods: 12240 |
0,00 |
0,00 |
0,00 |
0,00 |
0,00 |
|
|
a) Of long-term
production cycle : 12241 |
0,00 |
0,00 |
0,00 |
0,00 |
0,00 |
|
|
b) Of short-term
production cycle : 12242 |
0,00 |
0,00 |
0,00 |
0,00 |
0,00 |
|
|
5. By-products, residues and recycled materials:
12250 |
0,00 |
0,00 |
0,00 |
0,00 |
0,00 |
|
|
6. Advances to suppliers: 12260 |
0,00 |
0,00 |
0,00 |
2.042,00 |
2.299,00 |
|
|
III. Trade debtors and others receivable accounts: 12300 |
6.905.865,00 |
8.200.756,00 |
7.065.842,00 |
8.864.875,00 |
7.424.507,00 |
|
|
1. Trade debtors / accounts receivable:
12310 |
6.540.324,00 |
7.431.904,00 |
6.443.805,00 |
5.155.503,00 |
6.124.037,00 |
|
|
a) Long-term receivables
from sales and services supplied : 12311 |
0,00 |
0,00 |
0,00 |
0,00 |
0,00 |
|
|
b) Customers for
sales and provisions of services : 12312 |
6.540.324,00 |
7.431.904,00 |
6.443.805,00 |
5.155.503,00 |
6.124.037,00 |
|
|
2. Customers, Group companies and
associates : 12320 |
0,00 |
0,00 |
0,00 |
2.371.695,00 |
253.812,00 |
|
|
3. Other accounts receivable: 12330 |
205.140,00 |
130.971,00 |
167.701,00 |
162.956,00 |
38.603,00 |
|
|
4. Personnel: 12340 |
7.645,00 |
23.786,00 |
32.074,00 |
40.505,00 |
45.663,00 |
|
|
5. Assets for deferred tax: 12350 |
0,00 |
0,00 |
0,00 |
0,00 |
0,00 |
|
|
6. Other debtors, including tax and social
security: 12360 |
152.756,00 |
614.095,00 |
422.262,00 |
1.134.216,00 |
962.392,00 |
|
|
7. Called up share capital: 12370 |
0,00 |
0,00 |
0,00 |
0,00 |
0,00 |
|
|
IV. Short-term investments in Group companies and associates:
12400 |
0,00 |
0,00 |
0,00 |
350.316,00 |
430.759,00 |
|
|
1. Equity instruments: 12410 |
0,00 |
0,00 |
0,00 |
0,00 |
0,00 |
|
|
2. Credits to businesses: 12420 |
0,00 |
0,00 |
0,00 |
0,00 |
0,00 |
|
|
3. Debt securities: 12430 |
0,00 |
0,00 |
0,00 |
0,00 |
0,00 |
|
|
4. Derivatives : 12440 |
0,00 |
0,00 |
0,00 |
0,00 |
0,00 |
|
|
5. Other financial assets : 12450 |
0,00 |
0,00 |
0,00 |
350.316,00 |
430.759,00 |
|
|
6. Other investments: 12460 |
0,00 |
0,00 |
0,00 |
0,00 |
0,00 |
|
|
V. Short-term financial investments : 12500 |
635.758,00 |
2.015.879,00 |
189.827,00 |
181.476,00 |
1.117.145,00 |
|
|
1. Equity instruments: 12510 |
0,00 |
0,00 |
0,00 |
0,00 |
0,00 |
|
|
2. Credits to businesses: 12520 |
0,00 |
0,00 |
15.000,00 |
40.000,00 |
40.000,00 |
|
|
3. Debt securities: 12530 |
0,00 |
0,00 |
0,00 |
0,00 |
0,00 |
|
|
4. Derivatives : 12540 |
419.540,00 |
1.850.055,00 |
0,00 |
0,00 |
1.028.613,00 |
|
|
5. Other financial assets : 12550 |
216.218,00 |
165.824,00 |
174.827,00 |
141.476,00 |
48.532,00 |
|
|
6. Other investments: 12560 |
0,00 |
0,00 |
0,00 |
0,00 |
0,00 |
|
|
VI. Short-term accruals: 12600 |
284.946,00 |
208.323,00 |
225.240,00 |
260.175,00 |
267.745,00 |
|
|
VII. Cash and other equivalent liquid assets : 12700 |
3.597.362,00 |
458.228,00 |
652.903,00 |
404.001,00 |
313.433,00 |
|
|
1. Treasury: 12710 |
1.267.362,00 |
458.228,00 |
652.903,00 |
404.001,00 |
313.433,00 |
|
|
2. Other equivalent liquid assets:
12720 |
2.330.000,00 |
0,00 |
0,00 |
0,00 |
0,00 |
|
|
TOTAL
ASSETS (A + B) : 10000 |
33.033.927,00 |
31.795.195,00 |
30.892.253,00 |
29.839.530,00 |
29.316.324,00 |
|
|
|
ORIGINAL |
ORIGINAL |
ORIGINAL |
ORIGINAL |
ORIGINAL |
|
|
Liabilities
and Net Worth |
2015 |
2014 |
2013 |
2012 |
2011 |
|
|
A)
NET WORTH: 20000 |
13.061.481,00 |
15.075.475,00 |
13.158.639,00 |
13.536.610,00 |
15.963.621,00 |
|
|
A-1) Shareholders' equity: 21000 |
12.700.708,00 |
13.743.435,00 |
13.440.193,00 |
13.840.650,00 |
15.243.592,00 |
|
|
I. Capital: 21100 |
1.230.427,00 |
1.230.427,00 |
1.230.427,00 |
1.230.427,00 |
1.230.427,00 |
|
|
1. Registered capital : 21110 |
1.230.427,00 |
1.230.427,00 |
1.230.427,00 |
1.230.427,00 |
1.230.427,00 |
|
|
2. (Uncalled capital): 21120 |
0,00 |
0,00 |
0,00 |
0,00 |
0,00 |
|
|
II. Share premium: 21200 |
2.836.769,00 |
2.836.769,00 |
2.836.769,00 |
2.836.769,00 |
2.836.769,00 |
|
|
III. Reserves: 21300 |
9.896.118,00 |
9.592.876,00 |
9.993.333,00 |
11.396.275,00 |
10.014.672,00 |
|
|
1. Legal and statutory: 21310 |
0,00 |
0,00 |
299.417,00 |
299.417,00 |
10.014.672,00 |
|
|
2. Other reserves: 21320 |
0,00 |
0,00 |
9.693.916,00 |
11.096.858,00 |
0,00 |
|
|
3. Revaluation reserves: 21330 |
0,00 |
0,00 |
0,00 |
0,00 |
0,00 |
|
|
2. Capitalisation Reserves: 21350 |
0,00 |
0,00 |
0,00 |
0,00 |
0,00 |
|
|
IV. (Common stock equity): 21400 |
-219.879,00 |
-219.879,00 |
-219.879,00 |
-219.879,00 |
-219.879,00 |
|
|
V. Results from previous periods: 21500 |
0,00 |
0,00 |
0,00 |
0,00 |
0,00 |
|
|
1. Brought forward: 21510 |
0,00 |
0,00 |
0,00 |
0,00 |
0,00 |
|
|
2. (Negative results from previous
periods): 21520 |
0,00 |
0,00 |
0,00 |
0,00 |
0,00 |
|
|
VI. Other shareholders' contributions: 21600 |
0,00 |
0,00 |
0,00 |
0,00 |
0,00 |
|
|
VII. Result of the period: 21700 |
-1.042.727,00 |
303.242,00 |
-400.457,00 |
-1.402.942,00 |
1.381.603,00 |
|
|
VIII. (Interim dividend): 21800 |
0,00 |
0,00 |
0,00 |
0,00 |
0,00 |
|
|
IX. Other net worth instruments: 21900 |
0,00 |
0,00 |
0,00 |
0,00 |
0,00 |
|
|
A-2) Adjustments due to changes in value: 22000 |
360.773,00 |
1.332.040,00 |
-281.554,00 |
-304.040,00 |
720.029,00 |
|
|
I. Financial assets held for sale: 22100 |
0,00 |
0,00 |
0,00 |
0,00 |
0,00 |
|
|
II. Hedge operations: 22200 |
360.773,00 |
1.332.040,00 |
-281.554,00 |
-304.040,00 |
720.029,00 |
|
|
III. Linked non-current assets and liabilities held for sale :
22300 |
0,00 |
0,00 |
0,00 |
0,00 |
0,00 |
|
|
IV. Exchange rate difference: 22400 |
0,00 |
0,00 |
0,00 |
0,00 |
0,00 |
|
|
V. Other: 22500 |
0,00 |
0,00 |
0,00 |
0,00 |
0,00 |
|
|
A-3) Received subsidies, donations and legacies: 23000 |
0,00 |
0,00 |
0,00 |
0,00 |
0,00 |
|
|
B)
NON-CURRENT LIABILITIES: 31000 |
7.108.159,00 |
3.417.390,00 |
4.835.484,00 |
4.728.794,00 |
3.337.602,00 |
|
|
I. Long-term provisions: 31100 |
0,00 |
0,00 |
0,00 |
0,00 |
274.434,00 |
|
|
1. Long-term employee benefits liability:
31110 |
0,00 |
0,00 |
0,00 |
0,00 |
0,00 |
|
|
2. Environmental actions: 31120 |
0,00 |
0,00 |
0,00 |
0,00 |
0,00 |
|
|
3. Restructuring provisions: 31130 |
0,00 |
0,00 |
0,00 |
0,00 |
0,00 |
|
|
4. Other provisions: 31140 |
0,00 |
0,00 |
0,00 |
0,00 |
274.434,00 |
|
|
II Long-term creditors: 31200 |
6.297.346,00 |
2.030.292,00 |
2.898.184,00 |
2.828.047,00 |
1.801.103,00 |
|
|
1. Liabilities and other securities:
31210 |
0,00 |
0,00 |
0,00 |
0,00 |
0,00 |
|
|
2. Amounts owed to credit institutions:
31220 |
5.982.213,00 |
2.030.292,00 |
2.807.571,00 |
2.675.740,00 |
1.730.631,00 |
|
|
3. Creditors from financial leasing:
31230 |
315.133,00 |
0,00 |
18.379,00 |
43.696,00 |
70.472,00 |
|
|
4. Derivatives : 31240 |
0,00 |
0,00 |
72.234,00 |
108.611,00 |
0,00 |
|
|
5. Other financial liabilities :
31250 |
0,00 |
0,00 |
0,00 |
0,00 |
0,00 |
|
|
III. Long-term debts with Group companies and associates:
31300 |
0,00 |
0,00 |
0,00 |
0,00 |
0,00 |
|
|
IV. Liabilities for deferred tax: 31400 |
334.568,00 |
823.475,00 |
1.317.006,00 |
1.402.355,00 |
1.262.065,00 |
|
|
V. Long-term accruals: 31500 |
476.245,00 |
563.623,00 |
620.294,00 |
498.392,00 |
0,00 |
|
|
VI. Non-current trade creditors : 31600 |
0,00 |
0,00 |
0,00 |
0,00 |
0,00 |
|
|
VII. Special long-term debts : 31700 |
0,00 |
0,00 |
0,00 |
0,00 |
0,00 |
|
|
C)
CURRENT LIABILITIES : 32000 |
12.864.287,00 |
13.302.330,00 |
12.898.130,00 |
11.574.126,00 |
10.015.101,00 |
|
|
I. Liabilities linked to non-current assets held for sale:
32100 |
0,00 |
0,00 |
0,00 |
0,00 |
0,00 |
|
|
II. Short-term provisions: 32200 |
409.997,00 |
410.000,00 |
330.803,00 |
150.000,00 |
173.174,00 |
|
|
1. Provisions from greenhouse gas emission
allowance: 32210 |
0,00 |
0,00 |
0,00 |
0,00 |
0,00 |
|
|
2. Other provisions: 32220 |
0,00 |
410.000,00 |
330.803,00 |
0,00 |
0,00 |
|
|
III. Short-term creditors : 32300 |
4.706.297,00 |
3.159.180,00 |
4.960.750,00 |
5.602.536,00 |
2.625.869,00 |
|
|
1. Liabilities and other securities:
32310 |
0,00 |
0,00 |
0,00 |
0,00 |
0,00 |
|
|
2. Amounts owed to credit institutions:
32320 |
4.578.557,00 |
3.158.312,00 |
4.605.320,00 |
5.250.445,00 |
2.586.589,00 |
|
|
3. Creditors from financial leasing:
32330 |
127.740,00 |
868,00 |
25.444,00 |
26.359,00 |
39.280,00 |
|
|
4. Derivatives : 32340 |
0,00 |
0,00 |
329.986,00 |
325.732,00 |
0,00 |
|
|
5. Other financial liabilities : 32350 |
0,00 |
0,00 |
0,00 |
0,00 |
0,00 |
|
|
IV. Short-term debts with Group companies and associates:
32400 |
119.342,00 |
336.204,00 |
0,00 |
0,00 |
940,00 |
|
|
V. Trade creditors and other accounts payable: 32500 |
7.628.651,00 |
9.396.946,00 |
7.606.577,00 |
5.821.590,00 |
7.215.118,00 |
|
|
1. Suppliers: 32510 |
5.102.900,00 |
5.362.452,00 |
4.405.579,00 |
3.733.026,00 |
4.151.114,00 |
|
|
a) Long-term debts :
32511 |
0,00 |
0,00 |
0,00 |
0,00 |
0,00 |
|
|
b) Short-term debts :
32512 |
5.102.900,00 |
5.362.452,00 |
4.405.579,00 |
3.733.026,00 |
4.151.114,00 |
|
|
2. Suppliers, Group companies and
associates: 32520 |
0,00 |
0,00 |
0,00 |
0,00 |
0,00 |
|
|
3. Other creditors: 32530 |
1.582.148,00 |
2.904.355,00 |
2.572.585,00 |
1.487.358,00 |
1.715.210,00 |
|
|
4. Personnel (remuneration due):
32540 |
255.377,00 |
360.186,00 |
165.740,00 |
157.196,00 |
608.292,00 |
|
|
5. Liabilities for current tax:
32550 |
0,00 |
280.709,00 |
0,00 |
0,00 |
0,00 |
|
|
6. Other accounts payable to Public
Administrations.: 32560 |
682.354,00 |
481.271,00 |
439.139,00 |
437.021,00 |
433.945,00 |
|
|
7. Advances from clients: 32570 |
5.872,00 |
7.973,00 |
23.534,00 |
6.989,00 |
306.557,00 |
|
|
VI. Short-term accruals: 32600 |
0,00 |
0,00 |
0,00 |
0,00 |
0,00 |
|
|
VII. Special short-term debts : 32700 |
0,00 |
0,00 |
0,00 |
0,00 |
0,00 |
|
|
TOTAL
NET WORTH AND LIABILITIES (A + B + C) : 30000 |
33.033.927,00 |
31.795.195,00 |
30.892.253,00 |
29.839.530,00 |
29.316.324,00 |
|
|
|
ORIGINAL |
ORIGINAL |
ORIGINAL |
ORIGINAL |
ORIGINAL |
|
|
Profit
and Loss |
2015 |
2014 |
2013 |
2012 |
2011 |
|
|
1.
Net turnover: 40100 |
43.712.899,00 |
45.630.440,00 |
46.010.337,00 |
46.106.585,00 |
47.744.499,00 |
|
|
a) Sales: 40110 |
43.712.899,00 |
45.630.440,00 |
46.010.337,00 |
46.106.585,00 |
47.744.499,00 |
|
|
b) Rendering of services: 40120 |
0,00 |
0,00 |
0,00 |
0,00 |
0,00 |
|
|
c) Income of financial nature of holding companies: 40130 |
0,00 |
0,00 |
0,00 |
0,00 |
0,00 |
|
|
2.
Changes in stocks of finished goods and work in progress: 40200 |
0,00 |
0,00 |
0,00 |
0,00 |
0,00 |
|
|
3.
Works carried out by the company for its assets: 40300 |
20.000,00 |
20.000,00 |
0,00 |
0,00 |
0,00 |
|
|
4.
Supplies : 40400 |
-19.700.648,00 |
-19.997.744,00 |
-22.010.820,00 |
-21.408.933,00 |
-21.613.186,00 |
|
|
a) Stock consumption: 40410 |
-19.605.355,00 |
-19.704.380,00 |
-21.615.920,00 |
-21.227.891,00 |
-21.361.510,00 |
|
|
b) Consumption of raw materials and miscellaneous consumable
ones: 40420 |
-245.293,00 |
-229.638,00 |
-328.242,00 |
-301.042,00 |
-304.345,00 |
|
|
c) Works carried out by other companies: 40430 |
0,00 |
0,00 |
0,00 |
0,00 |
0,00 |
|
|
d) Impairment of stock, primary material and other supplies:
40440 |
150.000,00 |
-63.726,00 |
-66.658,00 |
120.000,00 |
52.669,00 |
|
|
5.
Other operating income: 40500 |
281.411,00 |
513.242,00 |
517.890,00 |
540.556,00 |
243.743,00 |
|
|
a) Auxiliary income and other from current management:
40510 |
262.013,00 |
509.367,00 |
510.196,00 |
514.831,00 |
222.282,00 |
|
|
b) Operation subsidies included in the Period's
result: 40520 |
19.398,00 |
3.875,00 |
7.694,00 |
25.725,00 |
21.461,00 |
|
|
6.
Personnel costs: 40600 |
-10.083.259,00 |
-10.665.141,00 |
-9.886.285,00 |
-9.848.513,00 |
-9.253.420,00 |
|
|
a) Wages, salaries et al.: 40610 |
-7.985.037,00 |
-8.584.108,00 |
-7.878.146,00 |
-7.884.437,00 |
-7.412.290,00 |
|
|
b) Social security costs: 40620 |
-2.098.222,00 |
-2.081.033,00 |
-2.008.139,00 |
-1.964.076,00 |
-1.841.130,00 |
|
|
c) Provisions : 40630 |
0,00 |
0,00 |
0,00 |
0,00 |
0,00 |
|
|
7.
Other operating costs: 40700 |
-12.520.017,00 |
-13.775.558,00 |
-13.771.544,00 |
-14.838.173,00 |
-14.336.746,00 |
|
|
a) External services: 40710 |
-12.349.583,00 |
-13.413.780,00 |
-13.300.362,00 |
-14.627.005,00 |
-14.288.319,00 |
|
|
b) Taxes: 40720 |
-136.828,00 |
-100.966,00 |
-123.530,00 |
-77.170,00 |
-113.804,00 |
|
|
c) Losses, impairments and variation in provisions from trade
operations : 40730 |
-32.043,00 |
-233.345,00 |
-327.400,00 |
-109.826,00 |
96.275,00 |
|
|
d) Other current management expenditure : 40740 |
-1.563,00 |
-27.467,00 |
-20.252,00 |
-24.172,00 |
-30.898,00 |
|
|
e) Expenses due to greenhouse gas emissions: 40750 |
0,00 |
0,00 |
0,00 |
0,00 |
0,00 |
|
|
8.
Amortisation of fixed assets: 40800 |
-1.058.701,00 |
-1.067.367,00 |
-989.225,00 |
-1.071.799,00 |
-945.545,00 |
|
|
9.
Allocation of subsidies of non-financial fixed assets and other: 40900 |
0,00 |
0,00 |
0,00 |
0,00 |
0,00 |
|
|
10.
Excess provisions : 41000 |
0,00 |
0,00 |
0,00 |
0,00 |
0,00 |
|
|
11.
Impairment and result of transfers of fixed assets: 41100 |
-124.192,00 |
-62.717,00 |
-36.975,00 |
-185.222,00 |
19.103,00 |
|
|
a) Impairment and losses : 41110 |
0,00 |
0,00 |
0,00 |
0,00 |
0,00 |
|
|
b) Results for transfers and other : 41120 |
0,00 |
-62.717,00 |
-36.975,00 |
-185.222,00 |
19.103,00 |
|
|
c) Impairment and profit due to disposals of assets of holding
companies: 41130 |
0,00 |
0,00 |
0,00 |
0,00 |
0,00 |
|
|
12.
Negative difference in combined businesses: 41200 |
0,00 |
0,00 |
0,00 |
0,00 |
0,00 |
|
|
13.
Other results : 41300 |
-307.103,00 |
430.599,00 |
0,00 |
0,00 |
44.091,00 |
|
|
A.1)
OPERATING INCOME (1 + 2 + 3 + 4 + 5 + 6 + 7 + 8 + 9 + 10 + 11 + 12 + 13) :
49100 |
220.390,00 |
1.025.754,00 |
-166.622,00 |
-705.499,00 |
1.902.539,00 |
|
|
14.
Financial income : 41400 |
85.251,00 |
63.355,00 |
61.390,00 |
36.782,00 |
58.906,00 |
|
|
a) Of shares in equity instruments : 41410 |
0,00 |
0,00 |
61.390,00 |
0,00 |
58.906,00 |
|
|
a 1) In Group companies and associates:
41411 |
0,00 |
0,00 |
37.500,00 |
0,00 |
0,00 |
|
|
a 2) In third parties: 41412 |
0,00 |
0,00 |
23.890,00 |
0,00 |
58.906,00 |
|
|
b) From negotiable securities and other financial instruments :
41420 |
85.251,00 |
63.355,00 |
0,00 |
36.782,00 |
0,00 |
|
|
b 1) From Group companies and associates :
41421 |
75.967,00 |
52.007,00 |
0,00 |
0,00 |
0,00 |
|
|
b 2) From third parties : 41422 |
9.284,00 |
11.348,00 |
0,00 |
36.782,00 |
0,00 |
|
|
c) Allocation of financial subsidies, donations and legacies :
41430 |
0,00 |
0,00 |
0,00 |
0,00 |
0,00 |
|
|
15.
Financial expenditure: 41500 |
-568.762,00 |
-540.445,00 |
-694.431,00 |
-285.863,00 |
-150.259,00 |
|
|
a) Amounts owed to Group companies and associates : 41510 |
-4.036,00 |
-9.842,00 |
0,00 |
0,00 |
0,00 |
|
|
b) For debts with third parties : 41520 |
-564.726,00 |
-530.603,00 |
-694.431,00 |
-285.863,00 |
-150.259,00 |
|
|
c) Stock renewal : 41530 |
0,00 |
0,00 |
0,00 |
0,00 |
0,00 |
|
|
16.
Changes in fair value of financial instruments : 41600 |
0,00 |
0,00 |
0,00 |
0,00 |
1.300,00 |
|
|
a) Trading book and other : 41610 |
0,00 |
0,00 |
0,00 |
0,00 |
1.300,00 |
|
|
b) Allocation of financial assets held for sale to the result
for the period: 41620 |
0,00 |
0,00 |
0,00 |
0,00 |
0,00 |
|
|
17.
Exchange rate differences : 41700 |
34.476,00 |
-34.167,00 |
-26.737,00 |
-34.114,00 |
7.888,00 |
|
|
18.
Impairment and result for transfers of financial instruments: 41800 |
-1.062.930,00 |
-21.349,00 |
0,00 |
-1.304.212,00 |
0,00 |
|
|
a) Impairment and losses : 41810 |
-1.062.930,00 |
-21.349,00 |
0,00 |
-1.304.212,00 |
0,00 |
|
|
b) Results for transfers and other : 41820 |
0,00 |
0,00 |
0,00 |
0,00 |
0,00 |
|
|
19.
Other financial income and expenditure: 42100 |
0,00 |
0,00 |
0,00 |
0,00 |
0,00 |
|
|
a) Incorporation of financial expenditure to assets:
42110 |
0,00 |
0,00 |
0,00 |
0,00 |
0,00 |
|
|
b) Financial income from arrangement with creditors:
42120 |
0,00 |
0,00 |
0,00 |
0,00 |
0,00 |
|
|
c) Other income and expenditure: 42130 |
0,00 |
0,00 |
0,00 |
0,00 |
0,00 |
|
|
A.2)
FINANCIAL REVENUE (14+15+16+17+18+19) : 49200 |
-1.511.965,00 |
-532.606,00 |
-659.778,00 |
-1.587.407,00 |
-82.165,00 |
|
|
A.3)
NET RESULT BEFORE TAXES (A.1+A.2) : 49300 |
-1.291.575,00 |
493.148,00 |
-826.400,00 |
-2.292.906,00 |
1.820.374,00 |
|
|
20.
Income taxes: 41900 |
248.848,00 |
-189.906,00 |
425.943,00 |
889.964,00 |
-438.771,00 |
|
|
A.4)
PROFIT AFTER TAXES (A.3+20) : 49400 |
-1.042.727,00 |
303.242,00 |
-400.457,00 |
-1.402.942,00 |
1.381.603,00 |
|
|
21.
Result of the year coming from interrupted operations : 42000 |
0,00 |
0,00 |
0,00 |
0,00 |
0,00 |
|
|
A.5)
RESULT OF THE PERIOD (A.4+21) : 49500 |
-1.042.727,00 |
303.242,00 |
-400.457,00 |
-1.402.942,00 |
1.381.603,00 |
|
>
Normal Balance Sheet under the rules of the 1990 General Accounting Plan
(repealed since 1st January of 2008)
Information corresponding to the
fiscal year 2015 2014 2013 2012 2011 has been
compiled based on the equivalence criteria stipulated in Act JUS/206/2009.
Where the provisions of the Act did not establish relevant equivalence
criteria. To view details on the methodology 2015 2014 2013 2012 2011
is taken from information submitted to the TRADE REGISTER.
|
|
EQUIVALENCIA |
EQUIVALENCIA |
EQUIVALENCIA |
EQUIVALENCIA |
EQUIVALENCIA |
|
|
ASSETS |
2015 |
2014 |
2013 |
2012 |
2011 |
|
|
A)
SHAREHOLDERS (PARTNERS) BY UNCALLED SUSCRIBED CAPITAL: |
0,00 |
0,00 |
0,00 |
0,00 |
0,00 |
|
|
B)
FIXED ASSETS: |
11.467.441,00 |
10.434.242,00 |
12.236.142,00 |
9.596.999,00 |
10.900.580,00 |
|
|
I. Formation expenses: |
0,00 |
0,00 |
0,00 |
0,00 |
0,00 |
|
|
II. Intangible fixed assets: |
2.843.541,00 |
1.787.985,00 |
637.428,00 |
774.126,00 |
737.629,00 |
|
|
1. Research and development costs: |
0,00 |
0,00 |
0,00 |
0,00 |
0,00 |
|
|
2. Concessions, patents, licences,
trademarks et al.: |
0,00 |
0,00 |
0,00 |
0,00 |
0,00 |
|
|
3. Goodwill: |
0,00 |
0,00 |
0,00 |
0,00 |
0,00 |
|
|
4. Key money paid for premises: |
2.752.191,00 |
1.609.782,00 |
405.283,00 |
455.734,00 |
547.490,00 |
|
|
5. Software: |
91.350,00 |
178.203,00 |
232.145,00 |
318.392,00 |
190.139,00 |
|
|
6. Assets under capital leases: |
0,00 |
0,00 |
0,00 |
0,00 |
0,00 |
|
|
7. Payments on account: |
0,00 |
0,00 |
0,00 |
0,00 |
0,00 |
|
|
8. Provisions: |
0,00 |
0,00 |
0,00 |
0,00 |
0,00 |
|
|
9. Accumulated depreciation: |
0,00 |
0,00 |
0,00 |
0,00 |
0,00 |
|
|
III. Tangible fixed assets: |
3.648.976,00 |
3.713.470,00 |
3.936.275,00 |
4.107.588,00 |
4.668.464,00 |
|
|
1. Land and construction: |
0,00 |
0,00 |
0,00 |
0,00 |
0,00 |
|
|
2. Technical installations and machinery:
|
0,00 |
0,00 |
0,00 |
0,00 |
0,00 |
|
|
3. Other installations, tools and
furniture: |
2.951.084,00 |
3.043.450,00 |
3.259.048,00 |
3.285.576,00 |
3.610.309,00 |
|
|
4. Payments on account and tangible fixed
assets under construction: |
85.167,00 |
38.118,00 |
561,00 |
139.837,00 |
308.557,00 |
|
|
5. Other tangible assets: |
612.725,00 |
631.902,00 |
676.666,00 |
682.175,00 |
749.598,00 |
|
|
6. Provisions: |
0,00 |
0,00 |
0,00 |
0,00 |
0,00 |
|
|
7. Accumulated depreciation: |
0,00 |
0,00 |
0,00 |
0,00 |
0,00 |
|
|
IV. Financial investments: |
4.755.045,00 |
4.712.908,00 |
7.442.560,00 |
4.495.406,00 |
5.274.608,00 |
|
|
1. Equity investments in group companies:
|
2.007.617,00 |
3.070.547,00 |
5.386.703,00 |
3.730.462,00 |
4.634.674,00 |
|
|
2. Receivables from group companies:
|
2.030.815,00 |
907.351,00 |
1.345.376,00 |
0,00 |
0,00 |
|
|
3. Equity investment in associated
companies: |
0,00 |
0,00 |
0,00 |
0,00 |
0,00 |
|
|
4. Credits to associated companies: |
0,00 |
0,00 |
0,00 |
0,00 |
0,00 |
|
|
5. Long-term securities portfolio: |
0,00 |
0,00 |
0,00 |
0,00 |
0,00 |
|
|
6. Other receivables: |
0,00 |
0,00 |
0,00 |
0,00 |
0,00 |
|
|
7. Long term guarantees and deposits:
|
716.613,00 |
735.010,00 |
710.481,00 |
764.944,00 |
639.934,00 |
|
|
8. Provisions: |
0,00 |
0,00 |
0,00 |
0,00 |
0,00 |
|
|
9. Long-term receivables from public
bodies: |
0,00 |
0,00 |
0,00 |
0,00 |
0,00 |
|
|
V. Own shares: |
219.879,00 |
219.879,00 |
219.879,00 |
219.879,00 |
219.879,00 |
|
|
VI. Long-term trade receivables: |
0,00 |
0,00 |
0,00 |
0,00 |
0,00 |
|
|
C)
Deferred expenses: |
0,00 |
0,00 |
0,00 |
0,00 |
0,00 |
|
|
D)
CURRENT ASSETS: |
21.305.337,00 |
19.730.777,00 |
18.875.990,00 |
20.462.410,00 |
17.607.010,00 |
|
|
I. Called-up share capital (not paid): |
0,00 |
0,00 |
0,00 |
0,00 |
0,00 |
|
|
II. Stocks: |
9.292.616,00 |
9.850.485,00 |
8.854.872,00 |
8.845.220,00 |
8.811.100,00 |
|
|
1. Goods for resale: |
9.249.835,00 |
9.765.445,00 |
8.707.832,00 |
8.766.978,00 |
8.654.933,00 |
|
|
2. Raw materials and other consumables:
|
42.781,00 |
85.040,00 |
147.040,00 |
76.200,00 |
153.868,00 |
|
|
3. Goods in process and semifinished ones:
|
0,00 |
0,00 |
0,00 |
0,00 |
0,00 |
|
|
4. Finished products: |
0,00 |
0,00 |
0,00 |
0,00 |
0,00 |
|
|
5. Byproducts, scrap and recovered
materials: |
0,00 |
0,00 |
0,00 |
0,00 |
0,00 |
|
|
6. Payments on account: |
0,00 |
0,00 |
0,00 |
2.042,00 |
2.299,00 |
|
|
7. Provisions: |
0,00 |
0,00 |
0,00 |
0,00 |
0,00 |
|
|
III. Debtors: |
7.914.195,00 |
9.047.917,00 |
8.953.148,00 |
10.421.222,00 |
7.695.441,00 |
|
|
1. Trade debtors / accounts receivable:
|
6.540.324,00 |
7.431.904,00 |
6.443.805,00 |
5.155.503,00 |
6.124.037,00 |
|
|
2. Accounts receivable, Group companies:
|
0,00 |
0,00 |
0,00 |
2.371.695,00 |
253.812,00 |
|
|
3. Accounts receivable, associated
companies: |
0,00 |
0,00 |
0,00 |
0,00 |
0,00 |
|
|
4. Other debtors: |
205.140,00 |
130.971,00 |
167.701,00 |
162.956,00 |
38.603,00 |
|
|
5. Staff: |
7.645,00 |
23.786,00 |
32.074,00 |
40.505,00 |
45.663,00 |
|
|
6. Public bodies: |
1.161.086,00 |
1.461.256,00 |
2.309.568,00 |
2.690.563,00 |
1.233.326,00 |
|
|
7. Provisions: |
0,00 |
0,00 |
0,00 |
0,00 |
0,00 |
|
|
IV. Short-term investments: |
2.546.218,00 |
165.824,00 |
189.827,00 |
531.792,00 |
519.291,00 |
|
|
1. Equity investments in group companies:
|
0,00 |
0,00 |
0,00 |
0,00 |
0,00 |
|
|
2. Receivables from group companies:
|
0,00 |
0,00 |
0,00 |
0,00 |
0,00 |
|
|
3. Equity investment in associated
companies: |
0,00 |
0,00 |
0,00 |
0,00 |
0,00 |
|
|
4. Credits to associated companies: |
0,00 |
0,00 |
0,00 |
0,00 |
0,00 |
|
|
5. Short term securities portfolio: |
2.330.000,00 |
0,00 |
0,00 |
0,00 |
0,00 |
|
|
6. Other receivables: |
0,00 |
0,00 |
15.000,00 |
390.316,00 |
470.759,00 |
|
|
7. Shor term guarantees and deposits:
|
216.218,00 |
165.824,00 |
174.827,00 |
141.476,00 |
48.532,00 |
|
|
8. Provisions: |
0,00 |
0,00 |
0,00 |
0,00 |
0,00 |
|
|
V. Short-term treasury shares: |
0,00 |
0,00 |
0,00 |
0,00 |
0,00 |
|
|
VI. Cash at bank and in hand: |
1.267.362,00 |
458.228,00 |
652.903,00 |
404.001,00 |
313.433,00 |
|
|
VII. Prepayments and accrued income: |
284.946,00 |
208.323,00 |
225.240,00 |
260.175,00 |
267.745,00 |
|
|
GENERAL
TOTAL (A + B + C + D): |
32.772.778,00 |
30.165.019,00 |
31.112.132,00 |
30.059.409,00 |
28.507.590,00 |
|
MERCANTILE REGISTRY.
|
|
EQUIVALENCIA |
EQUIVALENCIA |
EQUIVALENCIA |
EQUIVALENCIA |
EQUIVALENCIA |
|
|
LIABILITIES |
2015 |
2014 |
2013 |
2012 |
2011 |
|
|
A)
EQUITY: |
12.800.332,00 |
13.445.299,00 |
13.780.738,00 |
14.190.832,00 |
15.154.887,00 |
|
|
I. Subscribed capital: |
1.230.427,00 |
1.230.427,00 |
1.230.427,00 |
1.230.427,00 |
1.230.427,00 |
|
|
II. Share premium: |
2.836.769,00 |
2.836.769,00 |
2.836.769,00 |
2.836.769,00 |
2.836.769,00 |
|
|
III. Revaluation reserves: |
0,00 |
0,00 |
0,00 |
0,00 |
0,00 |
|
|
IV. Reserves: |
9.775.863,00 |
9.074.861,00 |
10.113.999,00 |
11.526.578,00 |
9.706.088,00 |
|
|
1. Legal reserve: |
9.896.118,00 |
9.592.876,00 |
299.417,00 |
299.417,00 |
10.014.672,00 |
|
|
2. Reserves for own shares: |
0,00 |
0,00 |
0,00 |
0,00 |
0,00 |
|
|
3. Reserves for shares of the controlling
company: |
0,00 |
0,00 |
0,00 |
0,00 |
0,00 |
|
|
4. Statutory reserves: |
0,00 |
0,00 |
0,00 |
0,00 |
0,00 |
|
|
5. Miscellaneous reserves: |
-120.255,00 |
-518.015,00 |
9.814.582,00 |
11.227.161,00 |
-308.584,00 |
|
|
6. Differences due to capital adjustment
to euros: |
0,00 |
0,00 |
0,00 |
0,00 |
0,00 |
|
|
V. Profit or loss brought forward: |
0,00 |
0,00 |
0,00 |
0,00 |
0,00 |
|
|
1. Retained earnings: |
0,00 |
0,00 |
0,00 |
0,00 |
0,00 |
|
|
2. Prior year losses: |
0,00 |
0,00 |
0,00 |
0,00 |
0,00 |
|
|
3. Partners' contributions so as
to compensate losses: |
0,00 |
0,00 |
0,00 |
0,00 |
0,00 |
|
|
VI. Profit or loss for the financial year: |
-1.042.727,00 |
303.242,00 |
-400.457,00 |
-1.402.942,00 |
1.381.603,00 |
|
|
VII. Interim dividend paid: |
0,00 |
0,00 |
0,00 |
0,00 |
0,00 |
|
|
VIII. Own shares for capital reduction: |
0,00 |
0,00 |
0,00 |
0,00 |
0,00 |
|
|
B)
Deferred income: |
0,00 |
0,00 |
0,00 |
0,00 |
0,00 |
|
|
1. Capital grants: |
0,00 |
0,00 |
0,00 |
0,00 |
0,00 |
|
|
2. Unrealised exchange gains: |
0,00 |
0,00 |
0,00 |
0,00 |
0,00 |
|
|
3. Other deferred income: |
0,00 |
0,00 |
0,00 |
0,00 |
0,00 |
|
|
4. Public revenues to distribute in
several financial years: |
0,00 |
0,00 |
0,00 |
0,00 |
0,00 |
|
|
C)
PROVISIONS FOR LIABILITIES AND CHARGES: |
0,00 |
0,00 |
0,00 |
0,00 |
274.434,00 |
|
|
1. Provisions for pension fund and other
similar obligations: |
0,00 |
0,00 |
0,00 |
0,00 |
0,00 |
|
|
2. Provisions for taxes: |
0,00 |
0,00 |
0,00 |
0,00 |
0,00 |
|
|
3. Other provisions: |
0,00 |
0,00 |
0,00 |
0,00 |
274.434,00 |
|
|
4. Reversion fund: |
0,00 |
0,00 |
0,00 |
0,00 |
0,00 |
|
|
D)
LONG TERM LIABILITIES: |
6.631.914,00 |
2.853.767,00 |
4.142.956,00 |
4.121.791,00 |
3.063.168,00 |
|
|
I. Issued debentures and other marketable securities: |
0,00 |
0,00 |
0,00 |
0,00 |
0,00 |
|
|
1. Non-convertible debentures: |
0,00 |
0,00 |
0,00 |
0,00 |
0,00 |
|
|
2. Convertible debentures: |
0,00 |
0,00 |
0,00 |
0,00 |
0,00 |
|
|
3. Other debt securities: |
0,00 |
0,00 |
0,00 |
0,00 |
0,00 |
|
|
II. Amounts owed to credit institutions: |
6.297.346,00 |
2.030.292,00 |
2.825.950,00 |
2.719.436,00 |
1.801.103,00 |
|
|
1. Loans and other liabilities: |
5.982.213,00 |
2.030.292,00 |
2.807.571,00 |
2.675.740,00 |
1.730.631,00 |
|
|
2. Long-term liabilities from capital
leases: |
315.133,00 |
0,00 |
18.379,00 |
43.696,00 |
70.472,00 |
|
|
III. Debts with companies of the group and affiliated ones:
|
0,00 |
0,00 |
0,00 |
0,00 |
0,00 |
|
|
1. Amounts owed to group companies: |
0,00 |
0,00 |
0,00 |
0,00 |
0,00 |
|
|
2. Amounts owed to associated companies:
|
0,00 |
0,00 |
0,00 |
0,00 |
0,00 |
|
|
IV. Other creditors: |
334.568,00 |
823.475,00 |
1.317.006,00 |
1.402.355,00 |
1.262.065,00 |
|
|
1. Long-term bills of exchange payable:
|
0,00 |
0,00 |
0,00 |
0,00 |
0,00 |
|
|
2. Other creditors: |
0,00 |
0,00 |
0,00 |
0,00 |
0,00 |
|
|
3. Long term guarantees and deposits
received: |
0,00 |
0,00 |
0,00 |
0,00 |
0,00 |
|
|
4. Long term payables to public bodies:
|
334.568,00 |
823.475,00 |
1.317.006,00 |
1.402.355,00 |
1.262.065,00 |
|
|
V. Unpaid portion of equity investment: |
0,00 |
0,00 |
0,00 |
0,00 |
0,00 |
|
|
1. Group companies: |
0,00 |
0,00 |
0,00 |
0,00 |
0,00 |
|
|
2. Associated companies: |
0,00 |
0,00 |
0,00 |
0,00 |
0,00 |
|
|
3. Third parties: |
0,00 |
0,00 |
0,00 |
0,00 |
0,00 |
|
|
VI. Long term trade creditors: |
0,00 |
0,00 |
0,00 |
0,00 |
0,00 |
|
|
E)
SHORT TERM CREDITORS: |
13.340.532,00 |
13.865.953,00 |
13.188.438,00 |
11.746.786,00 |
10.015.101,00 |
|
|
I. Issued debentures and other marketable securities: |
0,00 |
0,00 |
0,00 |
0,00 |
0,00 |
|
|
1. Non-convertible debentures: |
0,00 |
0,00 |
0,00 |
0,00 |
0,00 |
|
|
2. Convertible debentures: |
0,00 |
0,00 |
0,00 |
0,00 |
0,00 |
|
|
3. Other debt securities: |
0,00 |
0,00 |
0,00 |
0,00 |
0,00 |
|
|
4. Accrued interest on debentures and
other debt securities: |
0,00 |
0,00 |
0,00 |
0,00 |
0,00 |
|
|
II. Amounts owed to credit institutions: |
4.706.297,00 |
3.159.180,00 |
4.630.764,00 |
5.276.804,00 |
2.625.869,00 |
|
|
1. Loans and other liabilities: |
4.578.557,00 |
3.158.312,00 |
4.605.320,00 |
5.250.445,00 |
2.586.589,00 |
|
|
2. Accrued interest on liabilities with
credit institutions: |
0,00 |
0,00 |
0,00 |
0,00 |
0,00 |
|
|
3. Short-term liabilities from capital
leases: |
127.740,00 |
868,00 |
25.444,00 |
26.359,00 |
39.280,00 |
|
|
III. Short-term amounts owed to group and associated companies:
|
119.342,00 |
336.204,00 |
0,00 |
0,00 |
940,00 |
|
|
1. Amounts owed to group companies: |
119.342,00 |
336.204,00 |
0,00 |
0,00 |
940,00 |
|
|
2. Amounts owed to associated companies:
|
0,00 |
0,00 |
0,00 |
0,00 |
0,00 |
|
|
IV. Trade creditors: |
6.690.920,00 |
8.274.780,00 |
7.001.698,00 |
5.227.373,00 |
6.172.881,00 |
|
|
1. Advanced payments from customers:
|
5.872,00 |
7.973,00 |
23.534,00 |
6.989,00 |
306.557,00 |
|
|
2. Amounts owed for purchases of goods or
services: |
6.685.048,00 |
8.266.807,00 |
6.978.164,00 |
5.220.384,00 |
5.866.324,00 |
|
|
3. Debts represented by notes payable:
|
0,00 |
0,00 |
0,00 |
0,00 |
0,00 |
|
|
V. Other creditors: |
937.731,00 |
1.122.166,00 |
604.879,00 |
594.217,00 |
1.042.237,00 |
|
|
1. Public bodies: |
682.354,00 |
761.980,00 |
439.139,00 |
437.021,00 |
433.945,00 |
|
|
2. Bills of exchange payable: |
0,00 |
0,00 |
0,00 |
0,00 |
0,00 |
|
|
3. Miscellaneous debts: |
0,00 |
0,00 |
0,00 |
0,00 |
0,00 |
|
|
4. Wages and salaries payable: |
255.377,00 |
360.186,00 |
165.740,00 |
157.196,00 |
608.292,00 |
|
|
5. Guarantees and deposits received at
short term: |
0,00 |
0,00 |
0,00 |
0,00 |
0,00 |
|
|
VI. Provisions: |
409.997,00 |
410.000,00 |
330.803,00 |
150.000,00 |
173.174,00 |
|
|
VII. Prepayments and accrued income: |
476.245,00 |
563.623,00 |
620.294,00 |
498.392,00 |
0,00 |
|
|
F)
SHORT-TERM PROVISIONS FOR LIABILITIES AND CHARGES: |
0,00 |
0,00 |
0,00 |
0,00 |
0,00 |
|
|
GENERAL
TOTAL (A + B + C + D + E + F): |
32.772.778,00 |
30.165.019,00 |
31.112.132,00 |
30.059.409,00 |
28.507.590,00 |
|
MERCANTILE REGISTRY.
|
|
EQUIVALENCIA |
EQUIVALENCIA |
EQUIVALENCIA |
EQUIVALENCIA |
EQUIVALENCIA |
|
|
DEBIT |
2015 |
2014 |
2013 |
2012 |
2011 |
|
|
A)
CHARGES (A.1 to A.15): |
45.176.764,00 |
46.354.394,00 |
46.990.074,00 |
48.086.865,00 |
46.737.927,00 |
|
|
A.1. Stock reduction of both manufactured
goods and the ones in process: |
0,00 |
0,00 |
0,00 |
0,00 |
0,00 |
|
|
A.2. Supplies: |
19.850.648,00 |
19.934.018,00 |
21.944.162,00 |
21.528.933,00 |
21.665.855,00 |
|
|
a) Stock consumption:
|
19.605.355,00 |
19.704.380,00 |
21.615.920,00 |
21.227.891,00 |
21.361.510,00 |
|
|
b) Consumption of raw
materials and miscellaneous consumable ones: |
245.293,00 |
229.638,00 |
328.242,00 |
301.042,00 |
304.345,00 |
|
|
c) Miscellaneous
external expenditure: |
0,00 |
0,00 |
0,00 |
0,00 |
0,00 |
|
|
A.3. Staff costs: |
10.083.259,00 |
10.665.141,00 |
9.886.285,00 |
9.848.513,00 |
9.253.420,00 |
|
|
a) Wages, salaries et
al.: |
7.985.037,00 |
8.584.108,00 |
7.878.146,00 |
7.884.437,00 |
7.412.290,00 |
|
|
b) Social security
costs: |
2.098.222,00 |
2.081.033,00 |
2.008.139,00 |
1.964.076,00 |
1.841.130,00 |
|
|
A.4. Depreciation expense: |
1.058.701,00 |
1.067.367,00 |
989.225,00 |
1.071.799,00 |
945.545,00 |
|
|
A.5. Variation of trade provisions and
losses of unrecovered receivables: |
-117.957,00 |
297.071,00 |
394.058,00 |
-10.174,00 |
-148.944,00 |
|
|
a) Stock provision
variation: |
-150.000,00 |
63.726,00 |
66.658,00 |
-120.000,00 |
-52.669,00 |
|
|
b) Variation in provision
and bad debt losses: |
9.144,00 |
66.590,00 |
93.430,00 |
31.341,00 |
-27.474,00 |
|
|
c) Variation of other
trade provisions: |
22.899,00 |
166.755,00 |
233.970,00 |
78.485,00 |
-68.801,00 |
|
|
A.6. Other operating charges: |
12.487.974,00 |
13.542.213,00 |
13.444.144,00 |
14.728.347,00 |
14.433.021,00 |
|
|
a) External services:
|
12.349.583,00 |
13.413.780,00 |
13.300.362,00 |
14.627.005,00 |
14.288.319,00 |
|
|
b) Taxes: |
136.828,00 |
100.966,00 |
123.530,00 |
77.170,00 |
113.804,00 |
|
|
c) Other operating
expenses: |
1.563,00 |
27.467,00 |
20.252,00 |
24.172,00 |
30.898,00 |
|
|
d) Allocation to
revision fund: |
0,00 |
0,00 |
0,00 |
0,00 |
0,00 |
|
|
A.I. OPERATING BENEFITS
(B.1+B.2+B.3+B.4-A.1-A.2-A.3-A.4-A.5-A.6): |
651.685,00 |
657.872,00 |
0,00 |
0,00 |
1.839.345,00 |
|
|
A.7. Financial and similar charges: |
568.762,00 |
540.445,00 |
694.431,00 |
285.863,00 |
150.259,00 |
|
|
a) Due to liabilities
with companies of the group: |
4.036,00 |
9.842,00 |
0,00 |
0,00 |
0,00 |
|
|
b) Due to liabilities
with associated companies: |
0,00 |
0,00 |
0,00 |
0,00 |
0,00 |
|
|
c) Due to other
debts.: |
564.726,00 |
530.603,00 |
694.431,00 |
285.863,00 |
150.259,00 |
|
|
d) Losses from financial
investments: |
0,00 |
0,00 |
0,00 |
0,00 |
0,00 |
|
|
A.8. Changes in financial investment
provisions: |
1.062.930,00 |
21.349,00 |
0,00 |
1.304.212,00 |
0,00 |
|
|
A.9. Exchange losses: |
0,00 |
34.167,00 |
26.737,00 |
34.114,00 |
0,00 |
|
|
A.II. NET FINANCIAL INCOME (B.5+B.6+B.7+B.8-A.7-A.8-A.9):
|
0,00 |
0,00 |
0,00 |
0,00 |
0,00 |
|
|
A.III. PROFIT FROM ORDINARY ACTIVITIES (A.I+A.II-B.I-B.II):
|
0,00 |
125.266,00 |
0,00 |
0,00 |
1.757.180,00 |
|
|
A.10. Changes in provisions for
intangible, tangible and securities portfolio: |
0,00 |
0,00 |
0,00 |
0,00 |
0,00 |
|
|
A.11. Losses from tangible and intangible fixed
assets and securities portfolio: |
124.192,00 |
62.717,00 |
36.975,00 |
185.222,00 |
0,00 |
|
|
A.12. Losses from transactions with own
shares and debentures: |
0,00 |
0,00 |
0,00 |
0,00 |
0,00 |
|
|
A.13. Extraordinary expenses: |
307.103,00 |
0,00 |
0,00 |
0,00 |
0,00 |
|
|
A.14. Expenses and losses of former
financial years: |
0,00 |
0,00 |
0,00 |
0,00 |
0,00 |
|
|
A.IV. EXTRAORDINARY PROFIT (B.9+B.10+B.11+B.12+B.13-A.10-A.11-A.12-A.13-A.14):
|
0,00 |
367.882,00 |
0,00 |
0,00 |
63.194,00 |
|
|
A.V. PROFIT BEFORE TAXES (A.III+A.IV-B.III-B.IV): |
0,00 |
493.148,00 |
0,00 |
0,00 |
1.820.374,00 |
|
|
A.15. Corporation tax: |
-248.848,00 |
189.906,00 |
-425.943,00 |
-889.964,00 |
438.771,00 |
|
|
A.16. Miscellaneous taxes: |
0,00 |
0,00 |
0,00 |
0,00 |
0,00 |
|
|
A.VI. FINANCIAL YEAR RESULTS (PROFIT) (A.V-A.15-A.16): |
0,00 |
303.242,00 |
0,00 |
0,00 |
1.381.603,00 |
|
MERCANTILE REGISTRY.
|
|
EQUIVALENCIA |
EQUIVALENCIA |
EQUIVALENCIA |
EQUIVALENCIA |
EQUIVALENCIA |
|
|
CREDIT |
2015 |
2014 |
2013 |
2012 |
2011 |
|
|
B)
INCOME ( B.1 to B.13): |
44.134.037,00 |
46.657.636,00 |
46.589.617,00 |
46.683.923,00 |
48.119.530,00 |
|
|
B.1. Net total sales: |
43.712.899,00 |
45.630.440,00 |
46.010.337,00 |
46.106.585,00 |
47.744.499,00 |
|
|
a) Sales: |
46.138.850,00 |
48.162.809,00 |
48.563.790,00 |
48.665.379,00 |
50.394.193,00 |
|
|
b) Rendering of
services: |
0,00 |
0,00 |
0,00 |
0,00 |
0,00 |
|
|
Returns and Rappel on
sales: |
-2.425.951,00 |
-2.532.369,00 |
-2.553.453,00 |
-2.558.794,00 |
-2.649.694,00 |
|
|
B.2. Stock increase of manufactured goods
and products in process: |
0,00 |
0,00 |
0,00 |
0,00 |
0,00 |
|
|
B.3. Works performed by the company for fixed
assets: |
20.000,00 |
20.000,00 |
0,00 |
0,00 |
0,00 |
|
|
B.4. Miscellaneous operating income:
|
281.411,00 |
513.242,00 |
517.890,00 |
540.556,00 |
243.743,00 |
|
|
a) Auxiliary income and
other from current management: |
262.013,00 |
509.367,00 |
510.196,00 |
514.831,00 |
222.282,00 |
|
|
b) Grants: |
19.398,00 |
3.875,00 |
7.694,00 |
25.725,00 |
21.461,00 |
|
|
c) Liabilities and charges
provisions surplus: |
0,00 |
0,00 |
0,00 |
0,00 |
0,00 |
|
|
B.I. PÉRDIDAS DE EXPLOTACIÓN
(A.1+A.2+A.3+A.4+A.5-A.6-B.1-B.2-B.3-B.4): |
0,00 |
0,00 |
129.647,00 |
520.277,00 |
0,00 |
|
|
B.5. Income from equity investment: |
0,00 |
0,00 |
61.390,00 |
0,00 |
58.906,00 |
|
|
a) In companies of
the group: |
0,00 |
0,00 |
37.500,00 |
0,00 |
0,00 |
|
|
b) In associated
companies: |
0,00 |
0,00 |
0,00 |
0,00 |
0,00 |
|
|
c) Third parties:
|
0,00 |
0,00 |
23.890,00 |
0,00 |
58.906,00 |
|
|
B.6. Income from other marketable
securities and long-term receivables: |
0,00 |
0,00 |
0,00 |
0,00 |
0,00 |
|
|
a) From companies of
the group: |
0,00 |
0,00 |
0,00 |
0,00 |
0,00 |
|
|
b) From associated
companies: |
0,00 |
0,00 |
0,00 |
0,00 |
0,00 |
|
|
c) From companies out
of the group: |
0,00 |
0,00 |
0,00 |
0,00 |
0,00 |
|
|
B.7. Miscellaneous interests or similar
income: |
85.251,00 |
63.355,00 |
0,00 |
36.782,00 |
1.300,00 |
|
|
a) From companies of
the group: |
75.967,00 |
52.007,00 |
0,00 |
0,00 |
0,00 |
|
|
b) From associated
companies: |
0,00 |
0,00 |
0,00 |
0,00 |
0,00 |
|
|
c) Miscellaneous
interests: |
9.284,00 |
11.348,00 |
0,00 |
36.782,00 |
0,00 |
|
|
d) Profit on
financial investment: |
0,00 |
0,00 |
0,00 |
0,00 |
1.300,00 |
|
|
B.8. Exchange positive differences: |
34.476,00 |
0,00 |
0,00 |
0,00 |
7.888,00 |
|
|
B.II. NEGATIVE FINANCIAL RESULTS (A.7+A.8+A.9-B.5-B.6-B.7-B.8):
|
1.511.965,00 |
532.606,00 |
659.778,00 |
1.587.407,00 |
82.165,00 |
|
|
B.III. LOSSES ON ORDINARY ACTIVITIES ( B.I + B.II - A.I - A.II
): |
860.280,00 |
0,00 |
789.425,00 |
2.107.684,00 |
0,00 |
|
|
B.9.Profit on disposal of both tangible
and intangible fixed assets and securities portfolio: |
0,00 |
0,00 |
0,00 |
0,00 |
19.103,00 |
|
|
B.10. Profit on transactions with own shares
and debentures: |
0,00 |
0,00 |
0,00 |
0,00 |
0,00 |
|
|
B.11. Capital grants transferred to profit
and loss: |
0,00 |
0,00 |
0,00 |
0,00 |
0,00 |
|
|
B.12. Extraordinary income: |
0,00 |
430.599,00 |
0,00 |
0,00 |
44.091,00 |
|
|
B.13. Income and profit of former
financial years: |
0,00 |
0,00 |
0,00 |
0,00 |
0,00 |
|
|
B.IV. NEGATIVE EXTRAORDINARY RESULTS
(A.10+A.11+A.12+A.13+A.14-B.9-B.10-B.11-B.12-B.13): |
431.295,00 |
0,00 |
36.975,00 |
185.222,00 |
0,00 |
|
|
B.V. LOSSES BEFORE TAXES (B.III+B.IV-A.III-A.IV): |
1.291.575,00 |
0,00 |
826.400,00 |
2.292.906,00 |
0,00 |
|
|
B.VI. RESULT OF THE PERIOD (LOSSES) (B.V+A.15+A.16): |
1.042.727,00 |
0,00 |
400.457,00 |
1.402.942,00 |
0,00 |
|
MERCANTILE REGISTRY.
|
CASHFLOW
STATEMENT
|
|
|
|
|
Model: Normal
>
Source of information: Data contained in this section is taken from the information
declared in the Annual Accounts submitted to the Trade Register.
|
Net
Rights Granted |
2015 |
2014 |
2013 |
2012 |
2011 |
|
|
1.
Fiscal year result before taxes.: 61100 |
-1.291.575,00 |
493.148,00 |
-826.400,00 |
-2.292.906,00 |
1.820.374,00 |
|
|
2.
Results adjustments.: 61200 |
2.576.901,00 |
1.959.761,00 |
2.080.035,00 |
3.058.212,00 |
1.031.759,00 |
|
|
a) Fixed Assets Amortization (+).: 61201 |
1.058.701,00 |
1.067.367,00 |
989.225,00 |
1.071.799,00 |
945.545,00 |
|
|
b) Obsolescence Allowances (+/-). : 61202 |
-150.000,00 |
63.726,00 |
213.254,00 |
-10.174,00 |
-202.942,00 |
|
|
c) Variation in Provision (+/-). : 61203 |
1.094.973,00 |
254.694,00 |
180.803,00 |
1.528.170,00 |
224.794,00 |
|
|
e) Results on disposal of fixed assets (+/-). : 61205 |
124.192,00 |
62.717,00 |
36.975,00 |
0,00 |
-19.103,00 |
|
|
f) Results on disposal of financial instruments (+/-).:
61206 |
0,00 |
0,00 |
0,00 |
185.222,00 |
0,00 |
|
|
g) Financial income (-).: 61207 |
-85.251,00 |
-63.355,00 |
-61.390,00 |
-36.782,00 |
-58.906,00 |
|
|
h) Financial Expenses (+). : 61208 |
568.762,00 |
540.445,00 |
694.431,00 |
285.863,00 |
150.259,00 |
|
|
i) Exchange differences (+/-). : 61209 |
-34.476,00 |
34.167,00 |
26.737,00 |
34.114,00 |
-7.888,00 |
|
|
3.
Changes in current capital equity.: 61300 |
315.657,00 |
-878.493,00 |
1.196.473,00 |
-3.310.153,00 |
-2.411.834,00 |
|
|
a) Stock (+/-).: 61301 |
707.869,00 |
-1.059.339,00 |
-76.310,00 |
85.880,00 |
786.023,00 |
|
|
d) Debtors and other accounts receivable (+/-). : 61302 |
1.322.845,00 |
-1.289.062,00 |
-669.041,00 |
-1.412.624,00 |
-554.383,00 |
|
|
c) Other current assets (+/-). : 61303 |
-76.623,00 |
16.909,00 |
34.935,00 |
-4.931,00 |
101.710,00 |
|
|
d) Creditors and other accounts payable (+/-). : 61304 |
-1.487.583,00 |
1.509.670,00 |
1.784.987,00 |
-1.393.528,00 |
-2.529.652,00 |
|
|
e) Other current liabilities (+/-).: 61305 |
-60.000,00 |
0,00 |
0,00 |
0,00 |
-2.826,00 |
|
|
f) Other non-current assets and liabilities (+/-).: 61306 |
-90.851,00 |
-56.671,00 |
121.902,00 |
-584.950,00 |
-212.706,00 |
|
|
4.
Cash Flows from Other Operating Activities: 61400 |
-764.220,00 |
-478.357,00 |
-683.259,00 |
-167.097,00 |
-956.793,00 |
|
|
a) Interest payments (-). : 61401 |
-568.762,00 |
-540.445,00 |
-694.431,00 |
-285.863,00 |
-150.259,00 |
|
|
c) Interest collection (+). : 61403 |
85.251,00 |
63.355,00 |
61.390,00 |
36.782,00 |
58.906,00 |
|
|
d) Income tax payment collection (payments) (+/-).: 61404 |
-280.709,00 |
-1.267,00 |
-50.218,00 |
81.984,00 |
-865.440,00 |
|
|
5.
Cash Flows from Operating Activities (1 + 2 + 3 + 4) : 61500 |
836.763,00 |
1.096.059,00 |
1.766.849,00 |
-2.711.944,00 |
-516.494,00 |
|
|
6.
Payments for investment (-).: 62100 |
-3.330.714,00 |
-2.093.518,00 |
-1.005.087,00 |
-746.201,00 |
-3.423.314,00 |
|
|
a) Companies of the group and affiliates. : 62101 |
-1.123.464,00 |
0,00 |
-279.606,00 |
0,00 |
-430.759,00 |
|
|
b) Intangible fixed assets. : 62102 |
-1.220.776,00 |
-1.318.370,00 |
-22.320,00 |
-220.954,00 |
-117.501,00 |
|
|
c) Fixed assets. : 62103 |
-954.477,00 |
-775.148,00 |
-703.161,00 |
-525.247,00 |
-2.875.054,00 |
|
|
e) Other financial assets. : 62105 |
-31.997,00 |
0,00 |
0,00 |
0,00 |
0,00 |
|
|
7.
Divestment payment collection (+). : 62200 |
1.300,00 |
2.767.989,00 |
53.403,00 |
13.559,00 |
455.251,00 |
|
|
a) Companies of the group and affiliates. : 62201 |
0,00 |
2.732.832,00 |
0,00 |
0,00 |
0,00 |
|
|
c) Fixed assets. : 62203 |
1.300,00 |
35.684,00 |
7.291,00 |
13.559,00 |
455.251,00 |
|
|
e) Other financial assets. : 62205 |
0,00 |
-527,00 |
46.112,00 |
0,00 |
0,00 |
|
|
8.
Cash Flow from Investing Activities (6+7) less Amortization: 62300 |
-3.329.414,00 |
674.471,00 |
-951.684,00 |
-732.642,00 |
-2.968.063,00 |
|
|
9.
Payment collection and payments for equity instruments. : 63100 |
0,00 |
0,00 |
0,00 |
0,00 |
-951.069,00 |
|
|
c) Acquisition of own equity instruments (-). : 63103 |
0,00 |
0,00 |
0,00 |
0,00 |
-951.069,00 |
|
|
10.
Payment collection and payments for financial liabilities instruments.:
63200 |
5.597.309,00 |
-1.931.038,00 |
-539.526,00 |
3.569.268,00 |
1.601.693,00 |
|
|
a) Issuance : 63201 |
9.341.363,00 |
336.204,00 |
0,00 |
6.460.702,00 |
940,00 |
|
|
2. Debts incurred with credit institutions (+). : 63203 |
9.558.225,00 |
0,00 |
0,00 |
6.460.702,00 |
0,00 |
|
|
3. Debts incurred with companies of the group and affiliates
(+).: 63204 |
-216.862,00 |
336.204,00 |
0,00 |
0,00 |
940,00 |
|
|
b) Repayment and amortization of : 63207 |
-3.744.054,00 |
-2.267.242,00 |
-539.526,00 |
-2.891.434,00 |
1.600.753,00 |
|
|
2. Debts incurred with credit institutions (-).: 63209 |
-3.744.054,00 |
-2.267.242,00 |
-539.526,00 |
-2.891.434,00 |
1.600.753,00 |
|
|
11.
Payments from dividends and remunerations from other assets instruments. :
63300 |
0,00 |
0,00 |
0,00 |
0,00 |
-500.000,00 |
|
|
a) Dividends (-).: 63301 |
0,00 |
0,00 |
0,00 |
0,00 |
-500.000,00 |
|
|
12.
Cash Flows from Financing Activities (9+10+11): 63400 |
5.597.309,00 |
-1.931.038,00 |
-539.526,00 |
3.569.268,00 |
150.624,00 |
|
|
D)
EFFECT OF EXCHANGE RATE CHANGES: 64000 |
34.476,00 |
-34.167,00 |
-26.737,00 |
0,00 |
7.888,00 |
|
|
E)
NET INCREASE/DECREASE OF CASH OR EQUIVALENT ASSETS (+/-5+/-8+/12+/-D) :
65000 |
3.139.134,00 |
-194.675,00 |
248.902,00 |
124.682,00 |
-3.326.045,00 |
|
|
Cash or equivalent assets as of beginning of the fiscal year.:
65100 |
458.228,00 |
652.903,00 |
404.001,00 |
313.433,00 |
3.639.478,00 |
|
|
Cash or equivalent assets as of end of the fiscal year.:
65200 |
3.597.362,00 |
458.228,00 |
652.903,00 |
404.001,00 |
313.433,00 |
|
|
FINANCIAL
DIAGNOSIS
|
> Economic-Financial Comparative Analysis
Data used in the following ratios and indicators is taken from the
Annual Accounts submitted by the company to the TRADE REGISTER.
>
Comparison within the Sector
|
Cash
Flow |
2015 |
2014 |
Variación 2015 - 2014 |
|
|||
|
|
Empresa |
Sector |
Empresa |
Sector |
Empresa |
Sector |
|
|
Cash
Flow over Sales: |
0,07 % |
0,06 % |
0,00 % |
0,00 % |
|
|
|
|
Net
Financial Debt: |
3,96 |
2,83 |
1,57 |
13,94 |
151,51 |
-79,71 |
|
|
Cash
Flow Yield: |
0,10 % |
0,03 % |
-0,01 % |
0,00 % |
1.651,98 % |
|
|
|
EBITDA
over Sales: |
3,91 % |
10,45 % |
3,78 % |
2,23 % |
3,49 % |
367,98 % |
|
|
Profitability |
2015 |
2014 |
Variación 2015 - 2014 |
|
|||
|
|
Empresa |
Sector |
Empresa |
Sector |
Empresa |
Sector |
|
|
Operating
economic profitability: |
1,91 % |
6,93 % |
2,37 % |
-2,03 % |
-19,45 % |
441,89 % |
|
|
Total
economic profitability: |
-2,19 % |
3,19 % |
3,25 % |
0,16 % |
-167,31 % |
1.929,26 % |
|
|
Financial
profitability: |
-8,21 % |
4,13 % |
2,21 % |
-4,61 % |
-472,09 % |
189,54 % |
|
|
Margin:
|
1,20 % |
6,34 % |
1,29 % |
-1,85 % |
-7,04 % |
442,42 % |
|
|
Mark-up:
|
-2,24 % |
3,76 % |
0,14 % |
-2,69 % |
-1.750,78 % |
239,94 % |
|
|
Solvency |
2015 |
2014 |
Variación 2015 - 2014 |
|
|||
|
|
Empresa |
Sector |
Empresa |
Sector |
Empresa |
Sector |
|
|
Liquidity:
|
0,28 |
0,14 |
0,03 |
0,14 |
716,96 |
2,11 |
|
|
Acid
Test: |
0,86 |
0,87 |
0,79 |
0,86 |
8,59 |
0,78 |
|
|
Working
Capital / Investment: |
0,24 |
0,03 |
0,23 |
0,02 |
1,70 |
23,59 |
|
|
Solvency:
|
1,68 |
1,19 |
1,60 |
1,17 |
4,76 |
1,32 |
|
|
Indebtedness |
2015 |
2014 |
Variación 2015 - 2014 |
|
|||
|
|
Empresa |
Sector |
Empresa |
Sector |
Empresa |
Sector |
|
|
Indebtedness
level: |
1,54 |
1,31 |
1,19 |
1,37 |
29,79 |
-4,68 |
|
|
Borrowing
Composition: |
0,51 |
1,04 |
0,21 |
1,04 |
141,83 |
0,22 |
|
|
Repayment
Ability: |
11,44 |
11,04 |
9,45 |
52,99 |
20,99 |
-79,17 |
|
|
Warranty:
|
1,69 |
1,78 |
1,95 |
1,73 |
-13,38 |
2,69 |
|
|
Generated
resources / Total creditors: |
0,05 |
0,08 |
0,09 |
0,00 |
-46,80 |
|
|
|
Efficiency |
2015 |
2014 |
Variación 2015 - 2014 |
|
|||
|
|
Empresa |
Sector |
Empresa |
Sector |
Empresa |
Sector |
|
|
Productivity:
|
1,17 |
1,80 |
1,16 |
1,10 |
0,68 |
62,78 |
|
|
Turnover
of Collection Rights : |
6,37 |
5,23 |
5,63 |
5,13 |
13,22 |
1,92 |
|
|
Turnover
of Payment Entitlements: |
4,22 |
3,69 |
3,59 |
3,50 |
17,52 |
5,43 |
|
|
Stock
rotation: |
4,67 |
7,80 |
4,62 |
8,34 |
1,01 |
-6,46 |
|
|
Assets
turnover: |
1,60 |
1,09 |
1,84 |
1,09 |
-13,35 |
-0,15 |
|
|
Borrowing
Cost: |
2,91 |
2,46 |
3,31 |
2,81 |
-12,26 |
-12,75 |
|
>
Trend of indicators under the General Accounting Plan of 2007 (2015, 2014,
2013, 2012, 2011)
|
Cash
Flow |
2015 |
2014 |
2013 |
2012 |
2011 |
|
|
Cash
Flow over Sales: |
0,07 % |
0,00 % |
0,01 % |
0,00 % |
-0,07 % |
|
|
Net
Financial Debt: |
3,96 |
1,57 |
8,16 |
14,22 |
1,08 |
|
|
Cash
Flow Yield: |
0,10 % |
-0,01 % |
0,01 % |
0,00 % |
-0,11 % |
|
|
EBITDA
over Sales: |
3,91 % |
3,78 % |
1,87 % |
1,20 % |
5,83 % |
|
|
Profitability |
2015 |
2014 |
2013 |
2012 |
2011 |
|
|
Operating
economic profitability: |
1,91 % |
2,37 % |
-0,72 % |
-2,84 % |
8,26 % |
|
|
Total
economic profitability: |
-2,19 % |
3,25 % |
-0,43 % |
-6,73 % |
6,72 % |
|
|
Financial
profitability: |
-8,21 % |
2,21 % |
-2,98 % |
-10,14 % |
9,06 % |
|
|
Margin:
|
1,20 % |
1,29 % |
-0,36 % |
-1,51 % |
3,87 % |
|
|
Mark-up:
|
-2,24 % |
0,14 % |
-1,78 % |
-4,92 % |
3,70 % |
|
|
Solvency |
2015 |
2014 |
2013 |
2012 |
2011 |
|
|
Liquidity:
|
0,28 |
0,03 |
0,05 |
0,03 |
0,03 |
|
|
Acid
Test: |
0,86 |
0,79 |
0,60 |
0,82 |
0,94 |
|
|
Working
Capital / Investment: |
0,24 |
0,23 |
0,13 |
0,25 |
0,28 |
|
|
Solvency:
|
1,68 |
1,60 |
1,43 |
1,72 |
1,89 |
|
|
Indebtedness |
2015 |
2014 |
2013 |
2012 |
2011 |
|
|
Indebtedness
level: |
1,54 |
1,19 |
1,29 |
1,17 |
0,83 |
|
|
Borrowing
Composition: |
0,51 |
0,21 |
0,32 |
0,35 |
0,31 |
|
|
Repayment
Ability: |
11,44 |
9,45 |
20,25 |
29,29 |
4,63 |
|
|
Warranty:
|
1,69 |
1,95 |
1,78 |
1,85 |
2,27 |
|
|
Generated
resources / Total creditors: |
0,05 |
0,09 |
0,04 |
0,05 |
0,18 |
|
|
Efficiency |
2015 |
2014 |
2013 |
2012 |
2011 |
|
|
Productivity:
|
1,17 |
1,16 |
1,09 |
1,06 |
1,30 |
|
|
Turnover
of Collection Rights : |
6,37 |
5,63 |
6,58 |
5,26 |
6,46 |
|
|
Turnover
of Payment Entitlements: |
4,22 |
3,59 |
4,70 |
6,23 |
4,98 |
|
|
Stock
rotation: |
4,67 |
4,62 |
5,27 |
5,33 |
5,24 |
|
|
Assets
turnover: |
1,60 |
1,84 |
2,00 |
1,88 |
2,13 |
|
|
Borrowing
Cost: |
2,91 |
3,31 |
3,99 |
1,77 |
1,16 |
|
COMPARATIVE
SECTORIAL BALANCE
|
Sector-based Comparison under the rules
of the New General Accounting Plan.
|
Net
Rights Granted |
Variación - |
|
|
|
Empresa |
Sector |
|
Net
Rights Granted |
Variación - |
|
|
|
Empresa |
Sector |
|
Net
Rights Granted |
Variación - |
|
|
|
Empresa |
Sector |
|
News
|
|
Public
Tenders and Works Won
|
No Public Tenders assigned to the
name of the company.
|
Sources
|
|
Registry of Commerce's Official Gazette. Own and external data bases
Company References |
FOREIGN EXCHANGE RATES
|
Currency |
Unit
|
Indian Rupees |
|
US Dollar |
1 |
INR 63.98 |
|
|
1 |
INR 88.13 |
|
Euro |
1 |
INR 78.35 |
|
Euro |
1 |
INR 77.92 |
Note :
Above are approximate rates obtained from sources believed to be correct
INFORMATION DETAILS
|
Analysis Done by
: |
VAR |
|
|
|
|
Report Prepared
by : |
SYL |
RATING EXPLANATIONS
|
Credit Rating |
Explanation |
Rating Comments |
|
A++ |
Minimum Risk |
Business dealings permissible with minimum
risk of default |
|
A+ |
Low Risk |
Business dealings permissible with low
risk of default |
|
A |
Acceptable Risk |
Business dealings permissible with
moderate risk of default |
|
B |
Medium Risk |
Business dealings permissible on a regular
monitoring basis |
|
C |
Medium High Risk |
Business dealings permissible preferably
on secured basis |
|
D |
High Risk |
Business dealing not recommended or on
secured terms only |
|
NB |
New Business |
No recommendation can be done due to
business in infancy stage |
|
NT |
No Trace |
No recommendation can be done as the
business is not traceable |
NB is stated where there is insufficient information to facilitate rating. However, it is not to be considered as unfavourable.
This score serves as a reference to assess
SC’s credit risk and to set the amount of credit to be extended. It is
calculated from a composite of weighted scores obtained from each of the major
sections of this report. The assessed factors are as follows:
·
Financial
condition covering various ratios
·
Company
background and operations size
·
Promoters
/ Management background
·
Payment
record
·
Litigation
against the subject
·
Industry
scenario / competitor analysis
·
Supplier
/ Customer / Banker review (wherever available)
This report is issued at
your request without any risk and responsibility on the part of MIRA INFORM
PRIVATE LIMITED (MIPL) or its officials.