|
|
|


MIRA INFORM REPORT
|
Report No. : |
488103 |
|
Report Date : |
24.01.2018 |
IDENTIFICATION DETAILS
|
Name : |
PANAMA PETROCHEM LIMITED |
|
|
|
|
Registered
Office : |
Plot No.3303, G.I.D.C. Estate, Ankleshwar – 393002, Gujarat |
|
Tel. No.: |
91-2646-221068/ 250281 |
|
|
|
|
Country : |
India |
|
|
|
|
Financials (as
on) : |
31.03.2017 |
|
|
|
|
Date of
Incorporation : |
09.03.1982 |
|
|
|
|
Com. Reg. No.: |
04-005062 |
|
|
|
|
Capital
Investment / Paid-up Capital : |
INR 80.658 Million |
|
|
|
|
CIN No.: [Company Identification
No.] |
L23209GJ1982PLC005062 |
|
|
|
|
IEC No.: |
Not Divulged |
|
|
|
|
GSTIN: |
Not Divulged |
|
|
|
|
TAN No.: [Tax Deduction &
Collection Account No.] |
Not Available |
|
|
|
|
PAN No.: [Permanent Account No.] |
AACCP4358D |
|
|
|
|
Legal Form : |
A Public Limited Liability Company. The Company’s Shares are Listed on
the Stock Exchanges. |
|
|
|
|
Line of Business
: |
Subject
is engaged in the manufacturer and exporters of specialty petroleum products
for diverse user industries like printing, textiles, rubber, pharmaceuticals,
cosmetics, power and other industrial oil. (Registered Activity) |
|
|
|
|
No. of Employees
: |
133 (Approximately) |
|
MIRA’s Rating : |
A + |
|
Credit Rating |
Explanation |
Rating Comments |
|
A+ |
Low Risk |
Business dealings permissible with low risk
of default |
|
Maximum Credit Limit : |
USD 8300000 |
|
|
|
|
Status : |
Good |
|
|
|
|
Payment Behaviour : |
Regular |
|
|
|
|
Litigation : |
Clear |
|
|
|
|
Comments : |
Panama Petrochem Limited (PPL), a company incorporated in the year 1982 having good track record. It is engaged in manufacturing of speciality petrochemical products such as liquid paraffin oils, petroleum jelly, ink oils, antistatic coning oil, rubber process oil, etc. For the financial year 2017, the company has achieved decent sales growth of 9.47% compared to its previous year along with fair profitability margin during the year. Rating takes into consideration, the sound financial risk profile marked by adequate net worth base along with strong debt protection metrics and comfortable cash accrual. Rating continue to derive strength from the long and established track record of its business operation backed by extensive experience promoters and well organized management team of the company. Moreover, PPL manufactures over 80 product variant which gives the company a fairly broad customers base and reputed clients in domestic as well as international markets this benefits the company to improve its profit margins amidst increasingly competitive environment. Further, as quarterly results till September 2017, the company has registered steady operating margins and fair growth in revenues. However, rating strengths get partially offset by susceptibility to volatility in oil base prices which is affected by the factors like global demand, global production, geo-political and government regulation. Trade relations are fair. Business is active. Payments are reported to be regular and as per commitments. In view of aforesaid, the company can be considered for normal business dealings with usual trade terms and conditions. |
NOTES:
Any query related to this report can be made
on e-mail: infodept@mirainform.com
while quoting report number, name and date.
ECGC Country Risk Classification List
|
Country Name |
Previous Rating (30.06.2017) |
Current Rating (30.09.2017) |
|
India |
A1 |
A1 |
|
Risk Category |
ECGC
Classification |
|
Insignificant |
A1 |
|
Low Risk |
A2 |
|
Moderately Low Risk |
B1 |
|
Moderate Risk |
B2 |
|
Moderately High Risk |
C1 |
|
High Risk |
C2 |
|
Very High Risk |
D |
EXTERNAL AGENCY RATING
|
Rating Agency Name |
CARE |
|
Rating |
Long term rating= A+ |
|
Rating Explanation |
Adequate degree of safety and low credit
risk. |
|
Date |
08.01.2018 |
|
Rating Agency Name |
CARE |
|
Rating |
Short term rating= A1 |
|
Rating Explanation |
Very strong degree of safety and carry
lowest credit risk. |
|
Date |
08.01.2018 |
RBI DEFAULTERS’ LIST STATUS
Subject’s name is not enlisted as a defaulter
in the publicly available RBI Defaulters’ list.
EPF (Employee Provident Fund) DEFAULTERS’ LIST STATUS
Subject’s name is not enlisted as a defaulter
in the publicly available EPF (Employee Provident Fund) Defaulters’ list as of
31-03-2016.
BIFR (Board for Industrial & Financial Reconstruction) LISTING
STATUS
Subject’s name is not listed as a Sick Unit in
the publicly available BIFR (Board for Industrial & Financial Reconstruction)
list as of 24.01.2018
IBBI (Insolvency and Bankruptcy Board of India) LISTING STATUS
Subject’s name is not listed in the publicly
available IBBI (Insolvency and Bankruptcy Board of India) list as of report
date.
INFORMATION DECLINED
Management non-cooperative (Tel No.:91-2646-221068)
LOCATIONS
|
Registered Office/ Plant 1: |
Plot No.3303, G.I.D.C. Industrial Estate, Ankleshwar – 393002,
Gujarat, India |
|
Tel. No.: |
91-2646-221068/ 250281 |
|
Fax No.: |
91-2646-250281/ 225907 |
|
E-Mail : |
|
|
Website : |
|
|
|
|
|
Corporate Office
: |
401, Aza House, 24, Turner Road, Next to Andhra Bank, Bandra (West),
Mumbai – 400050, Maharashtra, India |
|
Tel. No.: |
91-22-42177777 |
|
Fax No.: |
91-22-42177788 |
|
E-Mail : |
|
|
|
|
|
Plant 2 : |
Survey No.78/2, Daman Industrial Estate, Unit III, Poly Cab Road, Village Kadaiya, District Daman – 396210, Daman and Diu (UT), India |
|
Tel. No.: |
91-260-3091311 |
|
Fax No.: |
91-260-2220449 |
|
E-Mail : |
|
|
|
|
|
Plant 3 : |
Plot No. Z 23 and
24 SEZ, Dahej, District: Bharuch – 392110, Gujarat, India |
|
E-Mail : |
|
|
|
|
|
Plant 4 : |
Plot
No. H-12, M.I.D.C., Taloja, Navi Mumbai – 410208, Maharashtra, India |
|
Tel. No.: |
91-22-27411456 |
|
E-Mail : |
DIRECTORS
AS ON 2017
|
Name : |
Mr. Amin Amirali Rayani |
|
Designation : |
Managing Director |
|
Address : |
601, Rayani House, 30, Mount Mary Road, Bandra (West), Mumbai – 400050, Maharashtra, India |
|
Date of Birth/Age : |
17.05.1972 |
|
Qualification : |
Bachelor’s degree in commerce |
|
Date of Appointment : |
01.12.2000 |
|
DIN No.: |
00002652 |
|
|
|
|
Name : |
Mr. Hussein Vazirali Rayani |
|
Designation : |
Joint Managing Director |
|
Address : |
Rayani House, 30, Mount Mary Road, Bandra
(West), Mumbai – 400050, Maharashtra, India |
|
Date of Birth/Age : |
16.01.1978 |
|
Qualification : |
Masters Degree in chemical engineering from University of Southern California |
|
Date of Appointment : |
31.10.2015 |
|
DIN No.: |
00172165 |
|
|
|
|
Name : |
Mr. Amirali Essabhai Rayani |
|
Designation : |
Whole Time Director |
|
Address : |
Rayani House 30, Mount Mary Road, Bandra (West), Mumbai – 400050, Maharashtra, India |
|
Date of Appointment : |
01.06.2010 |
|
DIN No.: |
00002616 |
|
|
|
|
Name : |
Mr. Samir Akbarali Rayani |
|
Designation : |
Whole Time Director |
|
Address : |
5th Floor, Rayani House, 30
Mount Mary Road, Bandra (West), Mumbai – 400050, Maharashtra, India |
|
Date of Birth/Age : |
19.12.1975 |
|
Date of Appointment : |
01.06.2010 |
|
DIN No.: |
00002674 |
|
|
|
|
Name : |
Mr. Mukesh Trambaklal Mehta |
|
Designation : |
Independent Director |
|
Address : |
202/B, Olivia Apartments, G.P. Chaudhary
Marg, Off Juhu Church Road, Juhu, Mumbai – 400049, Maharashtra, India |
|
Date of Appointment : |
22.03.2003 |
|
DIN No.: |
00002702 |
|
|
|
|
Name : |
Mr. Dilip Sobhag Phatarphekar |
|
Designation : |
Director |
|
Address : |
B/502, Surya Apartments 53, Bhulabhai Desai
Road, Mumbai – 400026, Maharashtra, India |
|
Date of Appointment : |
29.09.2006 |
|
DIN No.: |
00002600 |
|
|
|
|
Name : |
Mr. Madan Mohan Jain |
|
Designation : |
Independent Director |
|
Address : |
2/302 Shakti Kunj B-9/3, Sector- 62, Noida
– 201307, Uttar Pradesh, India |
|
Date of Appointment : |
30.12.2005 |
|
DIN No.: |
00003580 |
|
|
|
|
Name : |
Ms. Nargis Mirza Kabani |
|
Designation : |
Independent Director |
|
Address : |
34,Al-Ayaz Apartments, 5 Dr. Peter Dias
Road, Bandra, Mumbai – 400050, Maharashtra, India |
|
Date of Birth/Age : |
14.05.1952 |
|
Date of Appointment : |
13.02.2015 |
|
DIN No.: |
07047788 |
KEY EXECUTIVES
|
Name : |
Mr. Pramod Kumar Maheshwari |
|
Designation : |
Chief Financial Officer |
|
Address : |
503/504, Ram Kutir Building, Inderlok Phase
V, Near Inderlok Police Station, Bhyander, Thane – 401105, Maharashtra, India |
|
Date of Appointment : |
21.05.2014 |
|
PAN No.: |
AGKPM2790B |
|
|
|
|
Name : |
Ms. Gayatri Sharma |
|
Designation : |
Company Secretary |
|
Address : |
401, Aza House, 24 Turner Road Next To
Andhra Bank, Bandra (West), Mumbai – 400050, Maharashtra, India |
|
Date of Appointment : |
08.12.2010 |
|
PAN No.: |
CCMPS8281H |
SHAREHOLDING PATTERN
AS ON 31.12.2017
|
Category of shareholder |
No. of fully paid up equity shares held |
Shareholding as a % of total no. of shares (calculated as per SCRR,
1957)As a % |
|
|
(A) Promoter & Promoter Group |
29920431 |
71.13 |
|
|
(B) Public |
12143080 |
28.87 |
|
|
Grand Total |
42063511 |
100.00 |

Statement showing shareholding pattern of the Promoter and
Promoter Group
|
Category of shareholder |
No. of fully paid up equity shares held |
Shareholding as a % of total no. of shares (calculated as per SCRR,
1957)As a % |
|
|
A1) Indian |
|
||
|
Individuals/Hindu undivided Family |
27757836 |
65.99 |
|
|
ARIF AMIRALI RAYANI |
1780029 |
4.23 |
|
|
SALIMALI ESSABHAI RAYANI |
1512150 |
3.59 |
|
|
SAPNA SAMIR RAYANI |
1522207 |
3.62 |
|
|
SERENA IQBAL RAYANI |
720000 |
1.71 |
|
|
NILIMA SHAHNAWAZ KHERAJ |
3000 |
0.01 |
|
|
NABAT AMIRALI RAYANI |
2219625 |
5.28 |
|
|
GULSHAN SALIMALI RAYANI |
142500 |
0.34 |
|
|
MALIKA VAZIRALI RAYANI |
1011342 |
2.40 |
|
|
VAZIRALI ESSABHAI RAYANI |
1072500 |
2.55 |
|
|
SHELINA ARIFALI RAYANI |
4182412 |
9.94 |
|
|
SAMIR AKBARALI RAYANI |
1638750 |
3.90 |
|
|
HUSSEIN VAZIRALI RAYANI |
830550 |
1.97 |
|
|
AKBARALI ESSABHAI RAYANI |
1504125 |
3.58 |
|
|
AMIRALI ESSABHAI RAYANI |
1536000 |
3.65 |
|
|
CHEMINE AMIN RAYANI |
1783794 |
4.24 |
|
|
IQBAL VAZIRALI RAYANI |
1832977 |
4.36 |
|
|
AMIN AMIRALI RAYANI |
1432500 |
3.41 |
|
|
BEGUMBANU AKBERALI RAYANI |
2144625 |
5.10 |
|
|
MUNIRA HUSSEIN RAYANI |
888750 |
2.11 |
|
|
Any Other (specify) |
2162595 |
5.14 |
|
|
ITTEFAQ ICE AND COLD STORAGE COMPANY
PRIVATE LIMITED |
2162595 |
5.14 |
|
|
Sub Total A1 |
29920431 |
71.13 |
|
|
A2) Foreign |
0.00 |
||
|
A=A1+A2 |
29920431 |
71.13 |
Statement showing shareholding pattern of the Public
shareholder
|
Category & Name of the
Shareholders |
No. of fully paid up
equity shares held |
Shareholding % calculated
as per SCRR, 1957 As a % of |
|
|
B1)
Institutions |
|
|
|
|
Mutual
Funds/ |
102000 |
0.24 |
|
|
Alternate
Investment Funds |
100000 |
0.24 |
|
|
Foreign
Portfolio Investors |
249810 |
0.59 |
|
|
Financial
Institutions/ Banks |
20024 |
0.05 |
|
|
Any
Other (specify) |
48813 |
0.12 |
|
|
FII
- ELARA INDIA OPPORTUNITIES FUND LIMITED |
48813 |
0.12 |
|
|
Sub
Total B1 |
520647 |
1.24 |
|
|
B2)
Central Government/ State Government(s)/ President of India |
0 |
0.00 |
|
|
Central
Government/ State Government(s)/ President of India |
183192 |
0.44 |
|
|
Sub
Total B2 |
183192 |
0.44 |
|
|
B3)
Non-Institutions |
0 |
0.00 |
|
|
Individual
share capital upto INR 0.200 million |
7331775 |
17.43 |
|
|
Individual
share capital in excess of INR 0.200 million |
2340666 |
5.56 |
|
|
ANIL
KUMAR GOEL |
868500 |
2.06 |
|
|
MADHUKAR
SHETH |
967451 |
2.30 |
|
|
NBFCs
registered with RBI |
500 |
0.00 |
|
|
Any
Other (specify) |
1766300 |
4.20 |
|
|
Bodies
Corporate |
1060565 |
2.52 |
|
|
Clearing
Members |
251609 |
0.60 |
|
|
NRI
– Non- Repat |
72146 |
0.17 |
|
|
NRI |
298804 |
0.71 |
|
|
NRI
– Repat |
51474 |
0.12 |
|
|
Trusts |
31702 |
0.08 |
|
|
Sub
Total B3 |
11439241 |
27.20 |
|
|
B=B1+B2+B3 |
12143080 |
28.87 |
BUSINESS DETAILS
|
Line of Business : |
Subject
is engaged in the manufacturer and exporters of specialty petroleum products
for diverse user industries like printing, textiles, rubber, pharmaceuticals,
cosmetics, power and other industrial oil. (Registered Activity) |
||||
|
|
|
||||
|
Products / Services
: |
|
||||
|
|
|
||||
|
Brand Names : |
Not Divulged |
||||
|
|
|
||||
|
Agencies Held : |
Not Divulged |
||||
|
|
|
||||
|
Exports : |
Not Divulged |
||||
|
|
|
||||
|
Imports : |
Not Divulged |
||||
|
|
|
||||
|
Terms : |
Not Divulged |
PRODUCTION STATUS – NOT AVAILABLE
GENERAL INFORMATION
|
Suppliers : |
|
||||||||||||||||||||||
|
|
|
||||||||||||||||||||||
|
Customers : |
|
||||||||||||||||||||||
|
|
|
||||||||||||||||||||||
|
No. of Employees : |
133 (Approximately) |
||||||||||||||||||||||
|
|
|
||||||||||||||||||||||
|
Bankers : |
· D C B Bank Limited, 601 and 602, Peninsula Business Park, 6th floor, Tower A, Senapati Bapat Marg, Lower Parel, Mumbai-400013, Maharashtra, India · Citibank N.A. · Standard Chartered Bank · IDBI Bank Limited · DBS Bank Limited · Yes Bank Limited ·
IDFC Bank |
||||||||||||||||||||||
|
|
|
||||||||||||||||||||||
|
Facilities : |
SHORT TERM BORROWINGS Terms of Securities
and repayment Cash credit from banks is secured against the hypothecation of Stocks, Book debts and Plant & Machineries (both present & future), Pledge of Fixed Deposit Receipts, Further secured by Equitable Mortgage of Company’s present Immovable Property situated at Ankleshwar, Daman,Marol industrial estate. The cash credit is repayable on demand and carried an interest rate of 11.75% to 13.75% p.a. |
|
Auditors : |
|
|
Name : |
Bhuta Shah and Company LLP Chartered Accountants |
|
Address : |
901/902, Regent Chambers, Nariman Point, Mumbai – 400021, Maharashtra,
India |
|
Tel. No.: |
91-22-43439191 / 22832626 |
|
Fax No.: |
91-22-22832727 |
|
E-Mail : |
|
|
Website : |
|
|
|
|
|
Memberships : |
Not Available |
|
|
|
|
Collaborators : |
Not Available |
|
|
|
|
Subsidiary : |
· Panol Industries RMC FZE, UAE |
|
|
|
|
Enterprises owned or
significantly influenced by key management personnel or their relatives : |
· Anirudh Distributors Private Limited |
CAPITAL STRUCTURE
After 18.09.2017
Authorised Capital : INR 255.500 Million
Issued, Subscribed & Paid-up Capital : INR 120.987
Million
AS ON 31.03.2017
Authorised Capital :
|
No. of Shares |
Type |
Value |
Amount |
|
|
|
|
|
|
127750000 |
Equity Shares |
INR 2/- each |
INR 255.500 Million |
|
|
|
|
|
Issued, Subscribed & Paid-up Capital :
|
No. of Shares |
Type |
Value |
Amount |
|
|
|
|
|
|
40329065 |
Equity Shares |
INR 2/- each |
INR 80.658 Million |
|
|
|
|
|
Reconciliation of the
shares outstanding at the beginning and at the end of the reporting period
|
Particular |
No. of shares |
INR in million |
|
Equity shares |
|
|
|
At the beginning of the year |
40329065 |
80.658 |
|
Outstanding at the end of the year |
40329065 |
80.658 |
Terms/rights attached
to equity shares
The Company has only one class of equity shares having a par value of INR 2 per share. Each holder of equity shares is entitled to one vote per share, however the holders of global depository receipts (GDR’s) do not have any voting rights in respect of shares represented by the GDR’s till the shares are held by the custodian bank. The company declares and pays dividends in Indian rupees. The dividend proposed by the Board of Directors is subject to the approval of the shareholders in the ensuing Annual General Meeting.
The amount of per share dividend recognized as distributions to equity shareholders is INR 1.00 (31 March 2016 : INR 0.50 )
In the event of liquidation of the company, the holders of equity shares will be entitled to receive assets in proportion to the number of equity shares held by the shareholders.
Details of
shareholders holding more than 5% shares in the company
|
Name of
Shareholder |
Number
of Shares |
% holding |
|
Equity Shares of INR 2 each fully paid up |
|
|
|
|
|
|
|
Ms. Shelina Arifali Rayani |
2788275 |
6.91% |
|
Shares held by Custodian as against which global depository receipts have been issued (Citi Bank N.A.) |
12286725 |
30.47% |
FINANCIAL DATA
[all figures are
INR Million]
ABRIDGED
BALANCE SHEET [STANDALONE]
|
SOURCES OF FUNDS |
31.03.2017 |
31.03.2016 |
31.03.2015 |
|
I.
EQUITY
AND LIABILITIES |
|
|
|
|
(1)Shareholders' Funds |
|
|
|
|
(a) Share Capital |
80.658 |
80.658 |
80.658 |
|
(b) Reserves & Surplus |
2828.585 |
2473.626 |
2296.305 |
|
(c) Money
received against share warrants |
0.000 |
0.000 |
0.000 |
|
|
|
|
|
|
(2) Share Application money pending
allotment |
0.000 |
0.000 |
0.000 |
|
Total
Shareholders’ Funds (1) + (2) |
2909.243 |
2554.284 |
2376.963 |
|
|
|
|
|
|
(3)
Non-Current Liabilities |
|
|
|
|
(a) long-term borrowings |
0.000 |
0.000 |
0.000 |
|
(b) Deferred tax liabilities (Net) |
54.107 |
38.495 |
29.789 |
|
(c) Other long term
liabilities |
0.000 |
0.000 |
0.000 |
|
(d) long-term
provisions |
0.000 |
0.000 |
0.000 |
|
Total Non-current
Liabilities (3) |
54.107 |
38.495 |
29.789 |
|
|
|
|
|
|
(4)
Current Liabilities |
|
|
|
|
(a) Short
term borrowings |
128.022 |
287.735 |
244.508 |
|
(b) Trade
payables |
2528.926 |
1444.687 |
1802.390 |
|
(c) Other current
liabilities |
63.870 |
31.742 |
49.588 |
|
(d) Short-term
provisions |
75.610 |
38.431 |
100.859 |
|
Total Current
Liabilities (4) |
2796.428 |
1802.595 |
2197.345 |
|
|
|
|
|
|
TOTAL |
5759.778 |
4395.374 |
4604.097 |
|
|
|
|
|
|
II.
ASSETS |
|
|
|
|
(1)
Non-current assets |
|
|
|
|
(a) Fixed
Assets |
|
|
|
|
(i)
Tangible assets |
816.910 |
794.616 |
763.918 |
|
(ii)
Intangible Assets |
0.000 |
0.000 |
0.000 |
|
(iii)
Capital work-in-progress |
42.892 |
1.955 |
0.000 |
|
(iv)
Intangible assets under development |
0.000 |
0.000 |
0.000 |
|
(b) Non-current Investments |
528.386 |
543.086 |
518.897 |
|
(c) Deferred tax assets (net) |
0.000 |
0.000 |
0.000 |
|
(d) Long-term Loan and Advances |
5.536 |
7.611 |
2.247 |
|
(e) Other Non-current
assets |
0.010 |
0.010 |
0.009 |
|
Total Non-Current
Assets |
1393.734 |
1347.278 |
1285.071 |
|
|
|
|
|
|
(2)
Current assets |
|
|
|
|
(a)
Current investments |
0.000 |
0.000 |
0.000 |
|
(b)
Inventories |
2298.012 |
1354.901 |
1529.901 |
|
(c) Trade
receivables |
1764.844 |
1348.988 |
1486.541 |
|
(d) Cash
and cash equivalents |
163.809 |
106.432 |
115.753 |
|
(e)
Short-term loans and advances |
131.777 |
235.982 |
184.671 |
|
(f) Other
current assets |
7.602 |
1.793 |
2.160 |
|
Total Current
Assets |
4366.044 |
3048.096 |
3319.026 |
|
|
|
|
|
|
TOTAL |
5759.778 |
4395.374 |
4604.097 |
PROFIT
& LOSS ACCOUNT [STANDALONE]
|
|
PARTICULARS |
31.03.2017 |
31.03.2016 |
31.03.2015 |
|
|
|
SALES |
|
|
|
|
|
|
|
Income |
7253.787 |
6646.138 |
7298.194 |
|
|
|
Other Income |
41.482 |
18.273 |
11.319 |
|
|
|
TOTAL |
7295.269 |
6664.411 |
7309.513 |
|
|
|
|
|
|
|
|
Less |
EXPENSES |
|
|
|
|
|
|
|
Cost of Materials Consumed |
5899.982 |
5613.833 |
6455.909 |
|
|
|
Purchase of traded goods |
240.897 |
132.793 |
115.961 |
|
|
|
(Increase)/decrease in inventories of traded goods and finished goods |
(75.067) |
(6.948) |
38.992 |
|
|
|
Employee Benefits Expenses |
59.781 |
46.201 |
40.159 |
|
|
|
Other Expenses |
444.720 |
463.462 |
383.680 |
|
|
|
TOTAL |
6570.313 |
6249.341 |
7034.701 |
|
|
|
|
|
|
|
|
|
PROFIT/(LOSS)
BEFORE INTEREST, TAX, DEPRECIATION AND AMORTISATION |
724.956 |
415.070 |
274.812 |
|
|
|
|
|
|
|
|
|
Less |
FINANCIAL
EXPENSES |
65.900 |
68.834 |
70.237 |
|
|
|
|
|
|
|
|
|
|
PROFIT/(LOSS)
BEFORE TAX, DEPRECIATION AND AMORTISATION |
659.056 |
346.236 |
204.575 |
|
|
|
|
|
|
|
|
|
Less |
DEPRECIATION/
AMORTISATION |
31.604 |
29.262 |
28.499 |
|
|
|
|
|
|
|
|
|
|
PROFIT/(LOSS)
BEFORE TAX |
627.452 |
316.974 |
176.076 |
|
|
|
|
|
|
|
|
|
Less |
TAX |
224.068 |
115.008 |
38.489 |
|
|
|
|
|
|
|
|
|
|
PROFIT/(LOSS)
AFTER TAX |
403.384 |
201.966 |
137.587 |
|
|
|
|
|
|
|
|
|
Add |
PREVIOUS
YEARS’ BALANCE BROUGHT FORWARD |
1415.626 |
1238.305 |
1212.013 |
|
|
|
|
|
|
|
|
|
Less |
APPROPRIATIONS |
|
|
|
|
|
|
|
Dividend Tax of previous year |
(0.114) |
0.261 |
0.000 |
|
|
|
Proposed final equity dividend |
40.329 |
20.165 |
80.658 |
|
|
|
Tax on proposed final equity dividend |
8.210 |
4.219 |
16.878 |
|
|
|
Transfer to general reserve |
0.000 |
0.000 |
13.759 |
|
|
|
Total
|
48.425 |
24.645 |
111.295 |
|
|
|
|
|
|
|
|
|
BALANCE CARRIED
TO THE B/S |
1770.585 |
1415.626 |
1238.305 |
|
|
|
|
|
|
|
|
|
|
EARNINGS IN
FOREIGN CURRENCY |
|
|
|
|
|
|
|
Exports at F.O.B Value |
2158.991 |
2332.544 |
2810.344 |
|
|
TOTAL EARNINGS |
2158.991 |
2332.544 |
2810.344 |
|
|
|
|
|
|
|
|
|
|
IMPORTS |
|
|
|
|
|
|
|
Raw materials (Includes Goods in transit) |
4993.885 |
3859.396 |
5070.563 |
|
|
|
Traded goods |
106.387 |
123.567 |
135.871 |
|
|
TOTAL IMPORTS |
5100.272 |
3982.963 |
5206.434 |
|
|
|
|
|
|
|
|
|
|
Earnings /
(Loss) Per Share (INR) |
10.00 |
5.01 |
3.41 |
|
CURRENT MATURITIES OF LONG TERM DEBT DETAILS
|
Particulars |
31.03.2017 |
31.03.2016 |
31.03.2015 |
|
Current Maturities of Long term debt |
NA |
NA |
NA |
|
Cash generated from/(used in) operations |
553.868 |
289.275 |
(16.368) |
|
Net cash flow from/(used in) operating activity |
360.035 |
202.744 |
(54.851) |
QUARTERLY
RESULTS
|
Particulars |
|
30.06.2017 (Unaudited) |
30.06.2017 (Unaudited) |
|
|
|
1st Quarter |
2nd
Quarter |
|
Net sales |
|
2560.160 |
2775.020 |
|
Total Expenditure |
|
2309.550 |
2551.490 |
|
PBIDT (Excluding Other Income) |
|
250.610 |
223.530 |
|
Other income |
|
4.760 |
1.240 |
|
Operating Profit |
|
255.370 |
224.770 |
|
Interest |
|
28.410 |
21.300 |
|
Exceptional Items |
|
NA |
NA |
|
PBDT |
|
226.960 |
203.470 |
|
Depreciation |
|
8.510 |
8.540 |
|
Profit Before Tax |
|
218.440 |
194.930 |
|
Tax |
|
78.150 |
69.500 |
|
Provisions and
contingencies |
|
NA |
NA |
|
Profit after tax |
|
140.300 |
125.430 |
|
Extraordinary Items |
|
NA |
NA |
|
Prior Period Expenses |
|
NA |
NA |
|
Other Adjustments |
|
NA |
NA |
|
Net Profit |
|
140.300 |
125.430 |
KEY
RATIOS
EFFICIENCY RATIOS
|
PARTICULARS |
31.03.2017 |
31.03.2016 |
31.03.2015 |
|
Average Collection Days (Sundry Debtors / Income * 365 Days) |
88.80 |
74.09 |
74.35 |
|
|
|
|
|
|
Account Receivables Turnover (Income / Sundry
Debtors) |
4.11 |
4.93 |
4.91 |
|
|
|
|
|
|
Average Payment Days (Sundry Creditors
/ Purchases * 365 Days) |
150.31 |
91.76 |
100.10 |
|
|
|
|
|
|
Inventory Turnover (Operating Income
/ Inventories) |
0.32 |
0.31 |
0.18 |
|
|
|
|
|
|
Asset Turnover (Operating Income
/ Net Fixed Assets) |
0.84 |
0.52 |
0.36 |
LEVERAGE RATIOS
|
PARTICULARS |
31.03.2017 |
31.03.2016 |
31.03.2015 |
|
Debt Ratio ((Borrowing + Current Liabilities) / Total
Assets) |
0.49 |
0.41 |
0.48 |
|
|
|
|
|
|
Debt Equity Ratio (Total Liability
/ Networth) |
0.04 |
0.11 |
0.10 |
|
|
|
|
|
|
Current Liabilities to Networth (Current
Liabilities / Net Worth) |
0.96 |
0.71 |
0.92 |
|
|
|
|
|
|
Fixed Assets to Networth (Net Fixed Assets
/ Networth) |
0.30 |
0.31 |
0.32 |
|
|
|
|
|
|
Interest Coverage Ratio (PBIT / Financial
Charges) |
11.00 |
6.03 |
3.91 |
PROFITABILITY RATIOS
|
PARTICULARS |
|
31.03.2017 |
31.03.2016 |
31.03.2015 |
|
Net Profit Margin ((PAT / Sales) *
100) |
% |
5.56 |
3.04 |
1.89 |
|
|
|
|
|
|
|
Return on Total Assets ((PAT / Total
Assets) * 100) |
% |
7.00 |
4.59 |
2.99 |
|
|
|
|
|
|
|
Return on Investment (ROI) ((PAT / Networth)
* 100) |
% |
13.87 |
7.91 |
5.79 |
SOLVENCY RATIOS
|
PARTICULARS |
31.03.2017 |
31.03.2016 |
31.03.2015 |
|
Current Ratio (Current Assets / Current Liabilities) |
1.56 |
1.69 |
1.51 |
|
|
|
|
|
|
Quick Ratio ((Current Assets
– Inventories) / Current Liabilities) |
0.74 |
0.94 |
0.81 |
|
|
|
|
|
|
G-Score Ratio Financial (Networth / Total
Assets) |
0.51 |
0.58 |
0.52 |
|
|
|
|
|
|
G-Score Ratio Debt (Debts / Equity
Capital) |
1.59 |
3.57 |
3.03 |
|
|
|
|
|
|
G-Score Ratio Liquidity (Total Current
Assets / Total Current Liabilities) |
1.56 |
1.69 |
1.51 |
Total Liability = Short-term Debt + Long-term
Debt + Current Maturities of Long-term debts
STOCK
PRICES
|
Face Value |
INR 2.00/- |
|
Market Value |
INR 154.40/- |
FINANCIAL ANALYSIS
[all figures are
INR Million]
DEBT EQUITY RATIO
|
Particular |
31.03.2015 |
31.03.2016 |
31.03.2017 |
|
|
INR In Million |
INR In Million |
INR In Million |
|
Share Capital |
80.658 |
80.658 |
80.658 |
|
Reserves & Surplus |
2296.305 |
2473.626 |
2828.585 |
|
Net worth |
2376.963 |
2554.284 |
2909.243 |
|
|
|
|
|
|
long-term borrowings |
0.000 |
0.000 |
0.000 |
|
Short term borrowings |
244.508 |
287.735 |
128.022 |
|
Total borrowings |
244.508 |
287.735 |
128.022 |
|
Debt/Equity ratio |
0.103 |
0.113 |
0.044 |

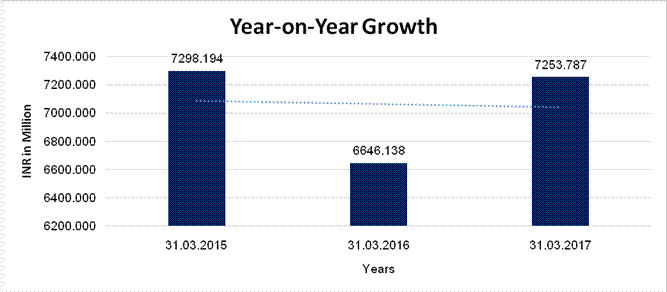
YEAR-ON-YEAR GROWTH
|
Year
on Year Growth |
31.03.2015 |
31.03.2016 |
31.03.2017 |
|
|
INR
In Million |
INR
In Million |
INR
In Million |
|
Sales |
7298.194 |
6646.138 |
7253.787 |
|
|
|
(8.934) |
9.143 |
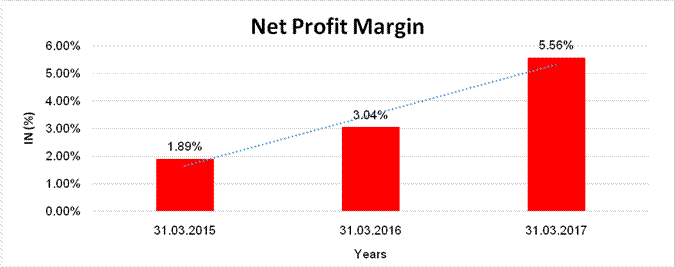
NET PROFIT MARGIN
|
Net
Profit Margin |
31.03.2015 |
31.03.2016 |
31.03.2017 |
|
|
INR
In Million |
INR
In Million |
INR
In Million |
|
Sales
|
7298.194 |
6646.138 |
7253.787 |
|
Profit/(Loss) |
137.587 |
201.966 |
403.384 |
|
|
1.89% |
3.04% |
5.56% |
ABRIDGED
BALANCE SHEET [CONSOLIDATED]
|
SOURCES OF FUNDS |
|
31.03.2017 |
31.03.2016 |
|
I.
EQUITY AND LIABILITIES |
|
|
|
|
(1)Shareholders' Funds |
|
|
|
|
(a) Share Capital |
|
80.658 |
80.658 |
|
(b) Reserves &
Surplus |
|
3013.270 |
2643.289 |
|
(c) Money received
against share warrants |
|
0.000 |
0.000 |
|
|
|
|
|
|
(2) Share Application
money pending allotment |
|
0.000 |
0.000 |
|
Total Shareholders’ Funds
(1) + (2) |
|
3093.928 |
2723.947 |
|
|
|
|
|
|
(3) Non-Current
Liabilities |
|
|
|
|
(a) long-term borrowings |
|
0.000 |
0.000 |
|
(b) Deferred tax
liabilities (Net) |
|
54.107 |
38.495 |
|
(c) Other long term liabilities |
|
0.000 |
0.000 |
|
(d) long-term provisions |
|
0.000 |
0.000 |
|
Total Non-current
Liabilities (3) |
|
54.107 |
38.495 |
|
|
|
|
|
|
(4) Current Liabilities |
|
|
|
|
(a) Short term borrowings |
|
325.815 |
574.259 |
|
(b) Trade payables |
|
3076.543 |
1509.276 |
|
(c) Other current
liabilities |
|
64.409 |
31.742 |
|
(d) Short-term provisions |
|
75.610 |
38.431 |
|
Total Current Liabilities
(4) |
|
3542.377 |
2153.708 |
|
|
|
|
|
|
TOTAL |
|
6690.412 |
4916.150 |
|
|
|
|
|
|
II.
ASSETS |
|
|
|
|
(1) Non-current assets |
|
|
|
|
(a) Fixed Assets |
|
|
|
|
(i) Tangible assets |
|
1253.161 |
1225.970 |
|
(ii) Intangible Assets |
|
0.000 |
0.000 |
|
(iii) Capital
work-in-progress |
|
42.892 |
1.955 |
|
(iv) Intangible assets
under development |
|
0.000 |
0.000 |
|
(b) Non-current
Investments |
|
9.824 |
24.524 |
|
(c) Deferred tax assets
(net) |
|
0.000 |
0.000 |
|
(d) Long-term Loan and Advances |
|
162.891 |
92.801 |
|
(e) Other Non-current
assets |
|
0.010 |
0.010 |
|
Total Non-Current Assets |
|
1468.778 |
1345.260 |
|
|
|
|
|
|
(2) Current assets |
|
|
|
|
(a) Current investments |
|
0.000 |
0.000 |
|
(b) Inventories |
|
3021.930 |
1647.703 |
|
(c) Trade receivables |
|
1829.574 |
1535.007 |
|
(d) Cash and cash
equivalents |
|
228.037 |
152.650 |
|
(e) Short-term loans and
advances |
|
134.215 |
233.638 |
|
(f) Other current assets |
|
7.878 |
1.892 |
|
Total Current Assets |
|
5221.634 |
3570.890 |
|
|
|
|
|
|
TOTAL |
|
6690.412 |
4916.150 |
PROFIT
& LOSS ACCOUNT [CONSOLIDATED]
|
|
PARTICULARS |
|
31.03.2017 |
31.03.2016 |
|
|
SALES |
|
|
|
|
|
Income |
|
8335.011 |
7517.219 |
|
|
Other Income |
|
41.332 |
18.371 |
|
|
TOTAL |
|
8376.343 |
7535.590 |
|
|
|
|
|
|
|
Less |
EXPENSES |
|
|
|
|
|
Cost of Materials
Consumed |
|
6035.643 |
5733.172 |
|
|
Purchases of
Stock-in-Trade |
|
1540.129 |
916.530 |
|
|
Changes in inventories of
finished goods, work-in-progress and Stock-in-Trade |
|
(533.665) |
(153.908) |
|
|
Employees benefits
expense |
|
70.607 |
55.351 |
|
|
Other expenses |
|
473.196 |
488.728 |
|
|
TOTAL |
|
7585.910 |
7039.873 |
|
|
|
|
|
|
|
|
PROFIT/ (LOSS) BEFORE INTEREST, TAX, DEPRECIATION AND
AMORTISATION |
|
790.433 |
495.717 |
|
|
|
|
|
|
|
Less |
FINANCIAL EXPENSES |
|
85.839 |
83.257 |
|
|
|
|
|
|
|
|
PROFIT / (LOSS) BEFORE
TAX, DEPRECIATION AND AMORTISATION |
|
704.594 |
412.460 |
|
|
|
|
|
|
|
Less/ Add |
DEPRECIATION/
AMORTISATION |
|
48.690 |
45.911 |
|
|
|
|
|
|
|
|
PROFIT/ (LOSS) BEFORE TAX |
|
655.904 |
366.549 |
|
|
|
|
|
|
|
Less |
TAX |
|
224.068 |
115.008 |
|
|
|
|
|
|
|
|
PROFIT/ (LOSS) AFTER TAX
|
|
431.836 |
251.541 |
|
|
|
|
|
|
|
|
Earnings / (Loss) Per
Share (INR) |
|
10.71 |
6.24 |
LOCAL AGENCY FURTHER INFORMATION
|
Sr. No. |
Check list by
info agents |
Available in
Report (Yes/No) |
|
1 |
Year of establishment |
Yes |
|
2 |
Constitution of the entity -Incorporation
details |
Yes |
|
3 |
Locality of the entity |
Yes |
|
4 |
Premises details |
No |
|
5 |
Buyer visit details |
-- |
|
6 |
Contact numbers |
Yes |
|
7 |
Name of the person contacted |
No |
|
8 |
Designation of contact person |
No |
|
9 |
Promoter’s background |
Yes |
|
10 |
Date of Birth of Proprietor / Partners /
Directors |
Yes |
|
11 |
Pan Card No. of Proprietor / Partners |
No |
|
12 |
Voter Id Card No. of Proprietor / Partners |
No |
|
13 |
Type of business |
Yes |
|
14 |
Line of Business |
Yes |
|
15 |
Export/import details (if applicable) |
No |
|
16 |
No. of employees |
Yes |
|
17 |
Details of sister concerns |
Yes |
|
18 |
Major suppliers |
No |
|
19 |
Major customers |
No |
|
20 |
Banking Details |
Yes |
|
21 |
Banking facility details |
Yes |
|
22 |
Conduct of the banking account |
-- |
|
23 |
Financials, if provided |
Yes |
|
24 |
Capital in the business |
Yes |
|
25 |
Last accounts filed at ROC, if applicable |
Yes |
|
26 |
Turnover of firm for last three years |
Yes |
|
27 |
Reasons for variation <> 20% |
-- |
|
28 |
Estimation for coming financial year |
No |
|
29 |
Profitability for last three years |
Yes |
|
30 |
Major shareholders, if available |
Yes |
|
31 |
External Agency Rating, if available |
Yes |
|
32 |
Litigations that the firm/promoter
involved in |
-- |
|
33 |
Market information |
-- |
|
34 |
Payments terms |
No |
|
35 |
Negative Reporting by Auditors in the
Annual Report |
No |
COMPANY
INFORMATION
The company is
a public limited Company domiciled in India. The registered office of the
Company is at Plot No. 3303, GIDC Estate, Ankleshwar 393002, Gujarat, India and
corporate office at 401, Aza House, Turner Road, Bandra West, Mumbai 400050.
The Company was incorporated on 9 March 1982. The Company is engaged in the
manufacture of specialty petroleum products for diverse user industries like
printing, textiles, rubber, pharmaceuticals, cosmetics, power and other
industrial oil.
OPERATIONAL
PERFORMANCE
• Earnings before Interest, Depreciation, and Tax & Amortization on a standalone basis increased by 74.66% to INR 724.956 million.
• Net Profit on a standalone basis increased by 99.73% to INR 403.384 million.
• Revenue from Operations on a standalone basis increased by 9.14% to INR 7253.787 million.
MANAGEMENT DISCUSSION AND ANALYSIS REPORT
ECONOMIC REVIEW
Increase in oil prices along with other major commodities aided recovery in global trade. The uptick in global trade was led by pickup in import demand in Asia and US which augurs well for underlying demand trends.
The Indian Economy saw a growth of about 7% for the year under review supported by strong consumption growth and government spending. Inflation eased sharply led by a decline in food inflation amidst government’s astute food management, facilitating a 50 basis points rate cut by the RBI in FY 2016-17 before it adopted a neutral stance.
During the year, the government passed two major initiatives i.e. passing of the Constitutional amendment paving the way for implementing the Goods and Services Tax (GST) and a bold action to demonetise the two highest denomination notes. GST is expected to rationalise indirect taxation structure, improve tax compliance and governance and boost long term investment and growth as well as eliminating multiple cascading taxes.
On the international front, the British Exit from the EU and the U.S. Presidential elections did have some volatile effects on the financial sector as well as other economies of the world. The world economy is expected to face challenging times in the coming year in view of major economic and other initiatives expected to be undertaken by certain western economies in the recent past.
The outlook for FY 2017-18 for India, continues to be positive. Financial liquidity coupled with relatively subdued crude prices augur well for the Indian economy. India continues to be and is expected to remain the fastest growing economy of the world.
INDUSTRY OVERVIEW
During the year, crude oil price was on recovery, it was largely supported by OPEC/non-OPEC production cut agreement. Brent crude oil prices were higher than the previous year. Oil prices rose on lower production due to Canadian wildfires and disruptions in Nigeria. The production cut by OPEC (Organisation of the Petroleum Exporting Countries) and some non- OPEC members in 2017 had little impact on crude and product inventories. These higher inventory levels and also additional supplies have capped the upside on crude oil prices. Further, the higher production outlook for US shale oil has been acting to undermine efforts to tighten the crude markets.
In light of the low prices in November 2016, OPEC announced its first cut in production since 2008 and the first deal including non-OPEC since 2001. Global oil prices recovered post the production cut announcement of OPEC/Non-OPEC.
BUSINESS
OVERVIEW
Established in 1982, company, today is one of India’s leading manufacturers and exporters for various kinds of Petroleum specialties. Company’s diverse range of products includes Mineral Oils, Liquid Paraffins, Transformer Oils, Petroleum Jellies, Ink Oils, and other Petroleum Specialty Products.
FUTURE OUTLOOK
The aggregate demand of all the key segments in the petrochemical industry is likely to regain a sharp positive trajectory, with key players aiming to ramp up scale.
The Company is planning to expand its operations to withstand against the negative market forces. The Company is hopeful to override the adverse effects of the price fluctuations in the petroleum industry by resorting to bulk purchases and cost control measures.
It is management’s view that the Company will continue to strengthen its financial position with stable production volumes and positive improvements in Commodity prices.
STATEMENT OF
STANDALONE UNAUDITED FINANCIAL RESULTS FOR THE QUARTER AND HALF YEAR ENDED 30 SEPTEMBER 2017
(INR In Million)
|
Particulars |
30.09.2017 (Unaudited) |
30.06.2017 (Unaudited) |
30.09.2017 (Unaudited) |
|
INCOME FROM OPERATIONS |
|
|
|
|
Revenue operations |
2775.018 |
2560.161 |
5335.179 |
|
Other Operating Income |
1.235 |
1.319 |
2.554 |
|
Total
Income from Operations |
2776.253 |
2561.480 |
5337.733 |
|
EXPENSES |
|
|
|
|
Cost of materials consumed |
2222.458 |
1860.298 |
4082.756 |
|
Purchase of Stock in Trade |
510.357 |
18.872 |
529.229 |
|
Changes in inventories of finished goods and
work-in-progress |
(325.245) |
97.587 |
(227.658) |
|
Employee benefits expense |
14.557 |
14.471 |
29.028 |
|
Depreciation and Amortization expenses |
8.535 |
8.509 |
17.044 |
|
Exchange (Gain)/Loss |
0.754 |
(3.438) |
(2.684) |
|
Finance Costs |
21.296 |
28.414 |
49.710 |
|
Excise duty on sale |
0.000 |
195.270 |
195.270 |
|
Other expenditure |
128.610 |
123.053 |
251.663 |
|
Total
Expenses |
2581.322 |
2343.036 |
4924.358 |
|
Profit/(Loss) before exceptional and extraordinary items
and tax |
194.931 |
218.444 |
413.375 |
|
Tax Expense |
69.503 |
78.148 |
147.651 |
|
Profit
(Loss) for the period |
125.428 |
140.296 |
265.724 |
|
|
|
|
|
|
Other comprehensive income |
(0.009) |
(0.086) |
(0.095) |
|
Total
comprehensive income |
125.419 |
140.210 |
265.629 |
|
Paid up equity share capital (Face value of INR 2 each) |
80.658 |
80.658 |
80.658 |
|
Earning per shares |
3.11 |
3.48 |
6.59 |
STATEMENT OF
ASSETS AND LIABILITIES AS AT 30.09.2017
|
SOURCES OF FUNDS |
|
|
30.09.2017 |
|
|
|
|
|
|
I.
EQUITY AND LIABILITIES |
|
|
|
|
(1)Shareholders' Funds |
|
|
|
|
(a) Share Capital |
|
|
80.658 |
|
(b) Reserves &
Surplus |
|
|
3094.648 |
|
(c) Money received
against share warrants |
|
|
0.000 |
|
|
|
|
|
|
(2) Share Application money
pending allotment |
|
|
0.000 |
|
Total Shareholders’ Funds
(1) + (2) |
|
|
3175.306 |
|
|
|
|
|
|
(3) Non-Current
Liabilities |
|
|
|
|
(a) long-term borrowings |
|
|
0.000 |
|
(b) Deferred tax
liabilities (Net) |
|
|
59.767 |
|
(c) Other long term
liabilities |
|
|
0.000 |
|
(d) long-term provisions |
|
|
0.000 |
|
Total Non-current
Liabilities (3) |
|
|
59.767 |
|
|
|
|
|
|
(4) Current Liabilities |
|
|
|
|
(a) Short term borrowings |
|
|
405.865 |
|
(b) Trade payables |
|
|
2294.189 |
|
(c) Other current
liabilities |
|
|
63.502 |
|
(d) Short-term provisions |
|
|
61.524 |
|
Total Current Liabilities
(4) |
|
|
2825.080 |
|
|
|
|
|
|
TOTAL |
|
|
6060.153 |
|
|
|
|
|
|
II.
ASSETS |
|
|
|
|
(1) Non-current assets |
|
|
|
|
(a) Fixed Assets |
|
|
|
|
(i) Tangible assets |
|
|
810.873 |
|
(ii) Intangible Assets |
|
|
148.414 |
|
(iii) Capital
work-in-progress |
|
|
0.000 |
|
(iv) Intangible assets
under development |
|
|
0.000 |
|
(b) Non-current
Investments |
|
|
528.710 |
|
(c) Deferred tax assets
(net) |
|
|
0.000 |
|
(d) Long-term Loan and Advances |
|
|
0.000 |
|
(e) Other Non-current
assets |
|
|
11.288 |
|
Total Non-Current Assets |
|
|
1499.285 |
|
|
|
|
|
|
(2) Current assets |
|
|
|
|
(a) Current investments |
|
|
0.000 |
|
(b) Inventories |
|
|
1935.033 |
|
(c) Trade receivables |
|
|
2026.447 |
|
(d) Cash and cash
equivalents |
|
|
237.916 |
|
(e) Short-term loans and
advances |
|
|
361.472 |
|
(f) Other current assets |
|
|
|
|
Total Current Assets |
|
|
4560.868 |
|
|
|
|
|
|
TOTAL |
|
|
6060.153 |
INDEX OF CHARGE:
|
SNo |
SRN |
Charge Id |
Charge Holder
Name |
Date of Creation |
Date of
Modification |
Date of
Satisfaction |
Amount |
Address |
|
1 |
G37187713 |
100080394 |
HDFC BANK LIMITED |
30/01/2017 |
- |
- |
460000000.0 |
HDFC BANK HOUSE
SENAPATI BAPAT MARG LOWER PAREL WEST MUMBAI-400013, MAHARASHTRA, INDIA |
|
2 |
G35604305 |
100077048 |
IDFC BANK LIMITED |
28/12/2016 |
- |
- |
660000000.0 |
KRM TOWER, 8TH
FLOOR, NO. 1,HARRINGTON ROAD, CHETPET CHENNAI-600031, TAMILNADU, INDIA |
|
3 |
G39755954 |
10315058 |
SBICAP TRUSTEE COMPANY LIMITED |
17/10/2011 |
20/03/2017 |
- |
3740000000.0 |
202, MAKER TOWER,
'E', CUFFE PARADE COLABA MUMBAI-400005, MAHARASHTRA, INDI |
|
4 |
G29401213 |
10310395 |
DBS Bank Ltd |
29/08/2011 |
21/11/2016 |
- |
600000000.0 |
2ND FLOOR, SHREE
AMBICA AUTOGIDC BHATPORE, OPP. ONGC HAZIRA SURAT-394510, GUJARAT, INDIA |
|
5 |
C36654515 |
10277662 |
IDBI Bank Limited |
11/03/2011 |
04/03/2014 |
- |
650000000.0 |
IDBI TOWER,
WORLD TRADE COMPLEX,CUFFE PARADE,MUMBAIMH400005IN |
|
6 |
C45120466 |
10215379 |
Citi Bank N.A. |
23/04/2010 |
26/02/2015 |
- |
600000000.0 |
FIRST INTERNATIONAL
FINANCIAL CENTRE (FIFC)PLOT NO. C-54 & 55, G- BLOCK, BKC, BANDRA (EAST)
MUMBAI-400051, MAHARASHTRA, INDI |
|
7 |
G33230517 |
10177511 |
YES BANK LIMITED |
19/08/2009 |
22/12/2016 |
- |
600000000.0 |
9TH FLOOR, NEHRU
CENTRE, DISCOVERY OF INDIA,DR. ANNIE BESANT ROAD, WORLI,MUMBAI 400018,
MAHARASHTRA, INDI |
|
8 |
G50731157 |
10091560 |
DCB BANK LIMITED |
27/12/2007 |
28/07/2017 |
- |
400000000.0 |
601 & 602, PENINSULA
BUSINESS PARK, 6TH FLOOR,TOWER A, SENAPATI BAPAT MARG, LOWER
PAREL,MUMBAI-400013, MAHARASHTRA, INDI |
|
9 |
B20948915 |
10012479 |
STANDARD CHARTERED BANK |
28/07/2006 |
29/08/2011 |
- |
520000000.0 |
ABHIJEET II GROUND
FLOORNEAR MITHAKALI SIX ROAD AHMEDABAD-380006, GUJARAT, INDIA |
|
10 |
G36979995 |
10031489 |
HDFC BANK LIMITED |
23/11/2006 |
12/12/2007 |
30/01/2017 |
200000000.0 |
HDFC BANK HOUSESENAPATI
BAPAT MARGLOWER PAREL WEST MUMBAI-400013, MAHARASHTRA, INDI |
FIXED ASSETS:
· Freehold Land
· Leasehold Building
· Factory Building
· Non Factory Building
·
Plant and Equipment
· Office Equipment
· Computers
· Furniture and Fixtures
·
Vehicles
·
Software
CMT REPORT (Corruption, Money Laundering & Terrorism]
The Public Notice information has been collected from various sources
including but not limited to: The Courts,
1] INFORMATION ON
DESIGNATED PARTY
No exist designating subject or any of its beneficial owners,
controlling shareholders or senior officers as terrorist or terrorist
organization or whom notice had been received that all financial transactions
involving their assets have been blocked or convicted, found guilty or against
whom a judgement or order had been entered in a proceedings for violating
money-laundering, anti-corruption or bribery or international economic or
anti-terrorism sanction laws or whose assets were seized, blocked, frozen or
ordered forfeited for violation of money laundering or international
anti-terrorism laws.
2] Court Declaration :
No records exist to suggest that subject is
or was the subject of any formal or informal allegations, prosecutions or other
official proceeding for making any prohibited payments or other improper
payments to government officials for engaging in prohibited transactions or
with designated parties.
3] Asset Declaration :
No records exist to suggest that the property or assets of the subject
are derived from criminal conduct or a prohibited transaction.
4] Record on Financial
Crime :
Charges or conviction
registered against subject: None
5] Records on Violation of
Anti-Corruption Laws :
Charges or
investigation registered against subject: None
6] Records on Int’l
Anti-Money Laundering Laws/Standards :
Charges or
investigation registered against subject: None
7] Criminal Records
No
available information exist that suggest that subject or any of its principals have
been formally charged or convicted by a competent governmental authority for
any financial crime or under any formal investigation by a competent government
authority for any violation of anti-corruption laws or international anti-money
laundering laws or standard.
8] Affiliation with
Government :
No record
exists to suggest that any director or indirect owners, controlling
shareholders, director, officer or employee of the company is a government
official or a family member or close business associate of a Government
official.
9] Compensation Package :
Our market
survey revealed that the amount of compensation sought by the subject is fair
and reasonable and comparable to compensation paid to others for similar
services.
10] Press Report :
No press reports / filings exists on
the subject.
CORPORATE GOVERNANCE
MIRA INFORM as part of its Due Diligence do provide comments on
Corporate Governance to identify management and governance. These factors often
have been predictive and in some cases have created vulnerabilities to credit
deterioration.
Our Governance Assessment focuses principally on the interactions
between a company’s management, its Board of Directors, Shareholders and other
financial stakeholders.
CONTRAVENTION
Subject is not known to have contravened any existing local laws,
regulations or policies that prohibit, restrict or otherwise affect the terms
and conditions that could be included in the agreement with the subject.
FOREIGN EXCHANGE RATES
|
Currency |
Unit
|
INR |
|
US Dollar |
1 |
INR 63.77 |
|
|
1 |
INR 89.20 |
|
Euro |
1 |
INR 78.21 |
INFORMATION DETAILS
|
Information
Gathered by : |
NIS |
|
|
|
|
Analysis Done by
: |
NYA |
|
|
|
|
Report Prepared
by : |
RKI |
SCORE FACTORS
|
DEMERIT POINTS |
|
|
|
--BANK CHARGES |
YES/NO |
YES |
|
--LITIGATION |
YES/NO |
NO |
|
--OTHER ADVERSE INFORMATION |
YES/NO |
NO |
|
MERIT POINTS |
|
|
|
--SOLE DISTRIBUTORSHIP |
YES/NO |
NO |
|
--EXPORT ACTIVITIES |
YES/NO |
YES |
|
--AFFILIATION |
YES/NO |
YES |
|
--LISTED |
YES/NO |
YES |
|
--OTHER MERIT FACTORS |
YES/NO |
YES |
RATING EXPLANATIONS
|
Credit Rating |
Explanation |
Rating Comments |
|
A++ |
Minimum Risk |
Business dealings permissible with minimum
risk of default |
|
A+ |
Low Risk |
Business dealings permissible with low
risk of default |
|
A |
Acceptable Risk |
Business dealings permissible with
moderate risk of default |
|
B |
Medium Risk |
Business dealings permissible on a regular
monitoring basis |
|
C |
Medium High Risk |
Business dealings permissible preferably
on secured basis |
|
D |
High Risk |
Business dealing not recommended or on
secured terms only |
|
NB |
New Business |
No recommendation can be done due to
business in infancy stage |
|
NT |
No Trace |
No recommendation can be done as the
business is not traceable |
NB is stated where there is insufficient information to facilitate rating. However, it is not to be considered as unfavourable.
This score serves as a reference to assess
SC’s credit risk and to set the amount of credit to be extended. It is
calculated from a composite of weighted scores obtained from each of the major
sections of this report. The assessed factors are as follows:
·
Financial
condition covering various ratios
·
Company
background and operations size
·
Promoters
/ Management background
·
Payment
record
·
Litigation
against the subject
·
Industry
scenario / competitor analysis
·
Supplier
/ Customer / Banker review (wherever available)
This report is issued at
your request without any risk and responsibility on the part of MIRA INFORM
PRIVATE LIMITED (MIPL) or its officials.