|
|
|


MIRA INFORM REPORT
|
Report No. : |
487913 |
|
Report Date : |
29.01.2018 |
IDENTIFICATION DETAILS
|
Name : |
ABASIC SL |
|
|
|
|
Registered Office : |
Pas. Del Mare Nostrum, 15. - Barcelona - 08039 - Barcelona |
|
|
|
|
Country : |
Spain |
|
|
|
|
Financials (as on) : |
2016 |
|
|
|
|
Date of Incorporation : |
01.01.2003 |
|
|
|
|
Legal Form : |
Private company |
|
|
|
|
Line of Business : |
Wholesale of textiles |
|
|
|
|
No. of Employees : |
929 |
RATING & COMMENTS
(Mira Inform has adopted New Rating mechanism w.e.f. 23rd
January 2017)
|
MIRA’s Rating : |
A+ |
|
Credit Rating |
Explanation |
Rating Comments |
|
A+ |
Low Risk |
Business dealings permissible with low
risk of default |
|
Status : |
Excellent |
|
|
|
|
Payment Behaviour : |
Slow |
|
|
|
|
Litigation : |
Clear |
NOTES :
Any query related to this report can be made
on e-mail : infodept@mirainform.com
while quoting report number, name and date.
ECGC Country Risk Classification List
|
Country Name |
Previous Rating (30.06.2017) |
Current Rating (30.09.2017) |
|
Spain |
A1 |
A1 |
|
Risk Category |
ECGC
Classification |
|
Insignificant |
A1 |
|
Low Risk |
A2 |
|
Moderately Low Risk |
B1 |
|
Moderate Risk |
B2 |
|
Moderately High Risk |
C1 |
|
High Risk |
C2 |
|
Very High Risk |
D |
SPAIN
- ECONOMIC OVERVIEW
After experiencing a prolonged recession in the wake of the global financial crisis that began in 2008, in 2017 Spain marked the fourth full year of positive economic growth in ten years, largely due to increased private consumption. At the onset of the financial crisis, Spain's GDP contracted by 3.7% in 2009, ending a 16-year growth trend, and continued contracting through most of 2013. In that year, the government successfully shored up struggling banks - exposed to the collapse of Spain's depressed real estate and construction sectors - and in January 2014 completed an EU-funded restructuring and recapitalization program for its financial sector.
Until 2014, credit contraction in the private sector, fiscal austerity, and high unemployment weighed on domestic consumption and investment. The unemployment rate rose from a low of about 8% in 2007 to more than 26% in 2013, but labor reforms prompted a modest reduction to 17% in 2017. High unemployment has strained Spain's public finances, as spending on social benefits increased while tax revenues fell. Spain’s budget deficit peaked at 11.4% of GDP in 2010, but Spain gradually reduced the deficit to about 3.3% of GDP in 2017. Public debt has increased substantially – from 60.1% of GDP in 2010 to nearly 96.7% in 2017.
Exports were resilient throughout the economic downturn and helped to bring Spain's current account into surplus in 2013 for the first time since 1986, where it remained through 2016. Rising labor productivity and an internal devaluation resulting from moderating labor costs and lower inflation have helped to improve foreign investor interest in the economy and positive FDI flows have been restored.
Political gridlock after the national elections in December 2015 and June 2016 and ensuing government formation process constrained the caretaker government’s ability to implement needed labor, pension, health care, tax, and education reforms— in 2016. The European Commission criticized Spain’s 2016 budget for easing austerity measures and for its alleged overly optimistic growth and deficit projections. Spain’s borrowing costs are dramatically lower since their peak in mid-2012, and with the recent uptick in economic activity, inflation has reappeared, at 2% per year.
|
Source
: CIA |
EXECUTIVE
SUMMARY
|
|
|
|
|
|
Name: |
ABASIC SL |
|
NIF / Fiscal code: |
B63054068 |
|
Trade Name |
ABASIC SL |
|
Status: |
ACTIVE |
|
Incorporation Date: |
01/01/2003 |
|
Register Data |
Register Section 8 Sheet 259066 |
|
Last Publication in
BORME: |
09/01/2018 [Appointments] |
|
Last Published Account Deposit: |
2016 |
|
Share Capital: |
20.588.406 |
|
|
|
|
Localization: |
PAS. DEL MARE NOSTRUM, 15. - BARCELONA - 08039 - BARCELONA |
|
Telephone - Fax - Email - Website: |
Telephone. 902 138 138 Email. desigual@desigual.com Website.
www.desigual.com |
|
Number of Branches |
1 |
|
|
|
|
Activity: |
|
|
NACE: |
4641 - Wholesale of textiles |
|
Registered Trademarks: |
|
|
Audited / Opinion: |
Si / |
|
Tenders and Awards: |
|
|
Subsidies: |
1 for a total cost of 26422 |
|
Quality Certificate: |
No |
|
|
|
|
Payment Behaviour: |
According to the agreed terms |
|
Prospects: |
Consolidation |
|
Industry situation: |
Maturity |
|
|
|
|
Defaults, Legal
Claims and Insolvency Proceedings : |
|
|
|
|
|
|
|
Number |
Amount (€) |
Most Recent Entry |
|
Insolvency Proceedings, Bankruptcy and Suspension of Payments |
|
Unpublished |
--- |
--- |
|
Defaults on debt with Financial Institutions and Large Companies |
|
1 |
1.763,31 |
--- |
|
Judicial Claims (Notices, Executive Proceedings, Attachments,
Auctions, Bad Debt) |
|
1 |
0 |
--- |
|
Proceedings heard by the Civil Court |
|
Unpublished |
0 |
--- |
|
Proceedings heard by the Labour Court |
|
1 |
0 |
--- |
|
|
|
Partners: |
|
|
|
LA VIDA ES CHULA SL |
89.1 % |
|
|
LE GENDRE HOLDING 29 SOCIETE PAR ACTIONS SIMPLIFIEE |
10 % |
|
|
Shares: |
32 |
|
|
Other Links: |
19 |
|
|
No. of Active Corporate Bodies: |
CHIEF EXECUTIVE OFFICER 1 |
|
|
Ratios |
2016 |
2015 |
Change |
|
|
Nº of employees: |
929 |
|
|
|
|
|
|
|
Guarantees: |
|
|
Properties Registered: |
Company NO, Administrator NO |
|
Financing / Guarantee Sources : |
Sources YES, Guarantees YES |
|
|
|
|
|
|
|
INVESTIGATION SUMMARY |
|
|
It was incorporated in January 2003 with a Sharehodler Equity
that amounted to Euro 20,588,406 Whole trade of clothes and complements for
women, men and children. |
|
|
Interviewed Person: |
|
|
Enquiry
Details
|
|
|
|
|
Social Denomination: |
ABASIC SL |
|
Trade Name: |
ABASIC SL |
|
NIF / Fiscal code: |
B63054068 |
|
Corporate Status: |
ACTIVE |
|
Registered Office: |
PAS. DEL MARE NOSTRUM,
15. |
|
Locality: |
BARCELONA |
|
Province: |
BARCELONA |
|
Postal Code: |
08039 |
|
Telephone: |
902 138 138 |
|
Fax: |
933 021 907 |
|
Website: |
www.desigual.com |
|
Email: |
desigual@desigual.com |
|
Interviewed Person: |
Administration
(succint) |
Branch
Offices
|
|
|
|
|
|
Address |
Postal Code |
City |
Province |
|
CALLE MARE DE DEU DEL REMEI 15 |
08004 |
BARCELONA |
BARCELONA |
|
Activity
|
|
|
NACE: |
4641 |
|
Corporate Purpose: |
The subject is
engaged in the wholesale and retail sale of all sorts of clothing and
complements. |
|
Additional Information: |
Whole trade of
clothes, accessories and complements for men, women and children. Brand:
Desigual |
|
Additional Address: |
The Registered
Office, offices and premises are located at the heading address. |
|
Franchise: |
No |
|
Import / export: |
EXPORTS |
|
Future Perspective: |
Consolidation |
|
Industry situation: |
Maturity |
|
Number
of Employees
|
|
|
|
|
|
|
Year |
No. of employees |
Established |
Incidentals |
|
|
|
2016 |
929 |
|
|
|
The data of employees is from the latest available financial statements in. Failing that, are estimates data calculated by statistical methods
Chronological
Summary
|
|||
|
|
Year |
Act |
|
|
|
2003 |
Accounts deposit (year 2002) Appointments/ Re-elections (1) Company Formation (1) Declaration of Sole Propietorship (1) Increase of Capital (1) Loss of the sole propietorship condition (1) Other Concepts/ Events (2) |
|
|
|
2004 |
Accounts deposit (year 2003) |
|
|
|
2005 |
Accounts deposit (year 2004) Appointments/ Re-elections (4) Increase of Capital (1) |
|
|
|
2006 |
Accounts deposit (year 2005) Appointments/ Re-elections (1) |
|
|
|
2007 |
Accounts deposit (year 2006) Appointments/ Re-elections (1) |
|
|
|
2008 |
Accounts deposit (year 2007) Appointments/ Re-elections (3) Cessations/ Resignations/ Reversals (1) |
|
|
|
2009 |
Accounts deposit (year 2008) Appointments/ Re-elections (1) |
|
|
|
2010 |
Appointments/ Re-elections (2) Cessations/ Resignations/ Reversals (1) Change of Social Purpose (1) Declaration of Sole Propietorship (1) Increase of Capital (1) Other Concepts/ Events (1) Statutory Modifications (1) |
|
|
|
2011 |
Accounts deposit (year 2009, 2010) Appointments/ Re-elections (3) Increase of Capital (1) |
|
|
|
2012 |
Accounts deposit (year 2011) Appointments/ Re-elections (1) Cessations/ Resignations/ Reversals (2) Change of Social address (1) |
|
|
|
2013 |
Accounts deposit (year 2012) Appointments/ Re-elections (4) Cessations/ Resignations/ Reversals (3) Change of Social Purpose (1) Loss of the sole propietorship condition (1) Other Concepts/ Events (1) Take-over Merger (3) |
|
|
|
2014 |
Accounts deposit (year 2013) Appointments/ Re-elections (3) Cessations/ Resignations/ Reversals (1) Increase of Capital (1) Statutory Modifications (2) |
|
|
|
2015 |
Accounts deposit (year 2014 consolidated, 2014) Appointments/ Re-elections (2) Cessations/ Resignations/ Reversals (1) |
|
|
|
2016 |
Appointments/ Re-elections (4) Cessations/ Resignations/ Reversals (1) Other Concepts/ Events (2) Partial split (1) |
|
|
|
2017 |
Accounts deposit (year 2015 consolidated, 2015, 2016) Appointments/ Re-elections (11) Cessations/ Resignations/ Reversals (2) Correction (2) |
|
|
Main
Historic Changes
|
|||
|
|
|
|
|
|
Concept |
Publication |
Act |
Date |
|
Corporate Purpose Changes: |
LA VENTA AL POR MAYOR O AL DETALLE DE TODO TIPO DE
ARTÍCULOS DE CONFECCION, GEÑEROS DE PUNTO Y COMPLEMENTOS VARIOSLA FABRICACION
DE ARTÍCULOS DE CONFECCION, GENEROS DE PUNTO Y COMPLEMENTOS VARIOS.ETC |
Company Formation |
18/02/2003 |
|
Breakdown
of Owners' Equity
|
|
|
Registered Capital: |
20.588.406 |
|
Paid up capital: |
20.588.406 |
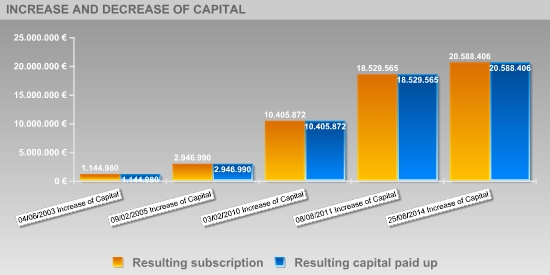
Updated
Evolution of the Subscribed and Paid-in Capital
|
|||||
|
|
|||||
|
|
|
|
|
|
|
|
Publishing Date |
Registration Type |
Capital Subscribed |
Paid up capital |
Underwritten result |
Disbursed Result |
|
22/01/2003 |
Company Formation |
30.000 |
30.000 |
30.000 |
30.000 |
|
04/06/2003 |
Increase of Capital |
1.114.980 |
1.114.980 |
1.144.980 |
1.144.980 |
|
09/02/2005 |
Increase of Capital |
1.802.010 |
1.802.010 |
2.946.990 |
2.946.990 |
|
03/02/2010 |
Increase of Capital |
7.458.882 |
7.458.882 |
10.405.872 |
10.405.872 |
|
08/08/2011 |
Increase of Capital |
8.123.693 |
8.123.693 |
18.529.565 |
18.529.565 |
|
25/08/2014 |
Increase of Capital |
2.058.841 |
2.058.841 |
20.588.406 |
20.588.406 |
|
Founding
Partners
|
|
|
|
|
|
|
Partner Name |
NIF |
% Shareholding stake |
|
|
|
LA VIDA ES CHULA SL |
B65937070 |
89 |
|
|
Active
Social Bodies
|
|
|
|
|
|
Post published |
Social Body's Name |
Appointment Date |
Other Positions in this Company |
|
PRESIDENT |
LA VIDA ES CHULA SL |
03/05/2013 |
3 |
|
MEMBER OF THE BOARD |
SOLON INVERSIONES SL |
25/01/2017 |
1 |
|
|
PIERRE MARIE JEAN LOUIS CUILLERET |
25/08/2014 |
2 |
|
|
VIRGINIE MORGON |
25/08/2014 |
1 |
|
|
FRANS ALEXIS HUMBERT HECTOR TIELEMAN |
25/08/2014 |
1 |
|
|
MARCELLO VITTORIO BOTTOLI |
25/08/2014 |
1 |
|
|
LA VIDA ES CHULA SL |
03/05/2013 |
3 |
|
JOINT ATTORNEY |
CALABIA GIBERT MARCOS |
18/09/2017 |
1 |
|
|
AULADELLA MESTRE JAUME |
18/09/2017 |
1 |
|
|
BERNI CLOS CARLOS |
18/09/2017 |
1 |
|
|
JOFRE TOVAR KATHERINE |
18/09/2017 |
1 |
|
|
GARCIA CAELLAS DANIEL |
18/09/2017 |
1 |
|
|
CALIXTO DE LAS HERAS NOEMI |
18/09/2017 |
2 |
|
|
MORENO LOPEZ EDUARDO |
09/12/2016 |
1 |
|
|
DE MORA NARVAEZ JUAN MARIA |
09/12/2016 |
1 |
|
JOINT ATTORNEY/COMBINED PROXY |
MEIRE HERNANDEZ DAVID |
17/08/2017 |
1 |
|
|
BONET MASDEU MONTSERRAT |
14/11/2013 |
1 |
|
CHIEF EXECUTIVE OFFICER |
LA VIDA ES CHULA SL |
03/07/2015 |
3 |
|
NON CONSELLOR SECRETARY |
RAMIREZ MARTINELL JORGE |
25/08/2014 |
4 |
|
NON CONSELLOR ASSISTANT SECRETARY |
TRUJILLO PARRA CRISTINA |
25/08/2014 |
3 |
|
REPRESENTATIVE |
HERNANDEZ GONZALEZ BERNARDO |
25/01/2017 |
1 |
|
|
THOMAS ANDREAS MEYER |
03/05/2013 |
2 |
|
ACCOUNTS' AUDITOR / HOLDER |
DELOITTE SL |
28/12/2017 |
6 |
|
CONSOLIDATED ACCOUNTS' AUDITOR |
DELOITTE SL |
28/12/2017 |
6 |
|
Historical
Social Bodies
|
|
|
|
|
|
Social Body's Name |
Post published |
End Date |
Other Positions in this Company |
|
ADELL DOMINGO MANEL |
CHIEF EXECUTIVE OFFICER |
22/11/2012 |
3 |
|
|
VICE CHAIRMAN |
03/05/2013 |
|
|
|
MEMBER OF THE BOARD |
03/05/2013 |
|
|
BERTRAN SESE GLORIA |
JOINT ATTORNEY/COMBINED PROXY |
17/08/2017 |
1 |
|
CABANES MASO ANA |
PROXY |
29/01/2013 |
1 |
|
CALIXTO DE LAS HERAS NOEMI |
JOINT ATTORNEY/COMBINED PROXY |
18/09/2017 |
2 |
|
CASTRESANA HUGAS FRANCISCO DE BORJA |
JOINT ATTORNEY |
17/08/2017 |
1 |
|
CHRISTIAN MEYER |
MEMBER OF THE BOARD |
05/07/2012 |
3 |
|
|
PROXY |
31/07/2008 |
|
|
|
PROXY |
05/07/2012 |
|
|
DANIEL VICTOR MEYER |
SINGLE PARTNER |
04/06/2003 |
2 |
|
|
SINGLE ADMINISTRATOR |
17/01/2008 |
|
|
DELOITTE SL |
CONSOLIDATED ACCOUNTS' AUDITOR |
28/12/2017 |
6 |
|
|
ACCOUNTS' AUDITOR / HOLDER |
28/12/2017 |
|
|
|
ACCOUNTS' AUDITOR / HOLDER |
22/12/2014 |
|
|
|
CONSOLIDATED ACCOUNTS' AUDITOR |
22/12/2014 |
|
|
FERRAN LARRAZ FRANCISCO JAVIER |
MEMBER OF THE BOARD |
06/02/2017 |
1 |
|
GASSO AUDITORES SL |
ACCOUNTS' AUDITOR / HOLDER |
05/11/2009 |
2 |
|
|
ACCOUNTS' AUDITOR / HOLDER |
13/12/2011 |
|
|
GOMARIZ OROZCO CELSO |
MEMBER OF THE BOARD |
25/08/2014 |
1 |
|
JADRAQUE SANTOS MANUEL |
PROXY |
29/01/2013 |
6 |
|
|
MEMBER OF THE BOARD |
03/07/2015 |
|
|
|
PROXY |
03/07/2015 |
|
|
|
CHIEF EXECUTIVE OFFICER |
03/07/2015 |
|
|
|
PROXY |
16/03/2005 |
|
|
|
PROXY |
31/07/2008 |
|
|
NTS IT'S NOT THE SAME BV |
MEMBER OF THE BOARD |
03/05/2013 |
3 |
|
|
PRESIDENT |
03/05/2013 |
|
|
|
SINGLE PARTNER |
18/12/2013 |
|
|
OBIOLS FERRE MARIA |
PROXY |
09/12/2016 |
3 |
|
|
PROXY |
02/09/2011 |
|
|
|
PROXY |
29/01/2013 |
|
|
OJINAGA CEBRIAN ALBERTO |
JOINT ATTORNEY/COMBINED PROXY |
17/08/2017 |
2 |
|
|
JOINT ATTORNEY/COMBINED PROXY |
17/08/2017 |
|
|
OLONDRIZ PLANELL GUILLERMO A |
PROXY |
16/03/2005 |
2 |
|
|
PROXY |
29/01/2013 |
|
|
PIERRE MARIE JEAN LOUIS CUILLERET |
JOINT ATTORNEY/COMBINED PROXY |
17/08/2017 |
2 |
|
PLANA ALMUNI JORGE |
PROXY |
17/08/2017 |
5 |
|
|
PROXY |
09/12/2016 |
|
|
|
PROXY |
15/07/2010 |
|
|
|
PROXY |
19/05/2011 |
|
|
|
PROXY |
02/09/2011 |
|
|
RAMIREZ MARTINELL JORGE |
MEMBER OF THE BOARD |
25/08/2014 |
4 |
|
|
NON CONSELLOR SECRETARY |
05/07/2012 |
|
|
|
SECRETARY |
25/08/2014 |
|
|
THOMAS ANDREAS MEYER |
REPRESENTATIVE |
03/05/2013 |
2 |
|
TORRALBA HEREDIA MARIA |
PROXY |
03/07/2015 |
1 |
|
TRUJILLO PARRA CRISTINA |
JOINT ATTORNEY/COMBINED PROXY |
17/08/2017 |
3 |
|
|
JOINT ATTORNEY/COMBINED PROXY |
17/08/2017 |
|
|
Executive
board
|
||
|
|
|
|
|
Post |
NIF |
Name |
|
MANAGING DIRECTOR |
|
MANUEL JADRAQUE |
|
PRESIDENTE |
B65937070 |
LA VIDA ES CHULA SL |
|
CONSEJERO |
B95392858 |
SOLON INVERSIONES SL |
|
CONSEJERO |
|
PIERRE MARIA JUAN LOUIS CUILLERET |
Defaults,
Legal Claims and Insolvency Proceedings
|
|
|
|
|
Section enabling assessment of the degree of compliance of
the company queried with its payment obligations. It provides information on
the existence and nature of all stages of Insolvency and Legal Proceedings
published with reference to the Company in the country's various Official
Bulletins and national newspapers, as well Defaults Registered in the main
national credit bureaus (ASNEF Industrial and RAI ).
> Summary
Chronological summary
|
|
|
Number of Publications |
Amount (€) |
Start date |
End date |
|
Insolvency Proceedings, Bankruptcy and Suspension of Payments |
|
Unpublished |
--- |
--- |
--- |
|
Request/Declaration |
|
0 |
--- |
date |
|
|
Proceedings |
|
--- |
--- |
|
--- |
|
Resolution |
|
--- |
--- |
|
--- |
|
Defaults on debt with Financial Institutions and Large Companies |
Bank and Commercial Delinquency |
1 |
0 |
13/02/2013 |
26/01/2018 |
|
Status: Friendly |
|
--- |
|
|
|
|
Status: Pre-Litigation |
|
--- |
|
|
|
|
Status: Litigation |
|
1 |
1763.31 |
13/02/2013 |
13/02/2013 |
|
Status: Non-performing |
|
--- |
|
|
|
|
Status: insolvency proceedings, bankruptcy and suspension of
payments |
|
--- |
|
|
|
|
Other status |
|
--- |
|
|
|
|
Legal and Administrative Proceedings |
|
1 |
--- |
09/05/2016 |
09/05/2016 |
|
Notices of defaults and enforcement |
|
1 |
--- |
|
--- |
|
Seizures |
|
--- |
--- |
|
--- |
|
Auctions |
|
--- |
--- |
|
--- |
|
Declarations of insolvency and bad debt |
|
--- |
--- |
|
--- |
|
Proceedings heard by the Civil Court |
|
Unpublished |
--- |
|
|
|
Proceedings heard by the Labour Court |
|
1 |
--- |
08/04/2016 |
08/04/2016 |
> Details
IMPAGOS EN ENTIDADES FINANCIERAS Y GRANDES EMPRESAS
Section comprising a list of the instances of default recorded in the ASNEF Industrial file under the name of .
List of current instances of default for each of the transactions
in progress
|
Type of creditor |
Product |
Value of transactions (€) |
Status |
No. of defaults |
Default balance (€) |
Date of first default |
Date of last default |
|
INDUSTRIA |
Otros |
1763.31 |
Judicial |
--- |
1763.31 |
13/02/13 |
13/02/13 |
|
|
|
1.763,31 |
|
|
|
||
Change in values of defaults and settled debts
Change in values of defaults and settled debts
Legal Notice:
This data has been obtained from
consultation of the ASNEF Industrial register. It may only be used for the
purposes of awarding credit, monitoring credit and managing loans. This data
may not be reused or included in any database, and may not be ceded
> Basis for scoring
|
Positive Factors |
Adverse Factors |
|
The continuous monitoring of payment behavior in credit bureaus of ABASIC SL indicates that it has recovered stability . At domestic level, it is one of the companies with high turnover volume. Significant level of financial autonomy. The asset is financed mostly with equity and financing with maturity exceeding one year, providing a solid financial structure. ABASIC SL 's borrowing cost is appropriate according to its volume of external financing sources. Significant operating income. The Company has the necessary return on the investments for its main activity in comparison with its assets. This return is higher than that of the financial year 2015 which means that the company's financial situation has improved. |
|
Probability
of default
|
> Estimated Probability of Default for the next 12 months: 0.155 %
|
Sector in which comparison is carried out: 464 Wholesale of household goods |
|
|
Relative Position:
|
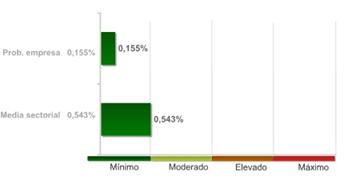
The company's comparative analysis with the rest of the companies that comprise the sector, shows the company holds a better position with regard to the probability of non-compliance.
The 99.00% of the companies of the sector ABASIC SL belongs to show a higher probability of non-compliance.
The probability of the company's non-compliance with its payment obligations within deadlines estimated by our qualifications models is 0,155%.
In the event they fail to comply with the payment, the seriousness of the loss will depend on factors such as the promptness of the commencement of the charging management, the existence of executive documents which match the credit or the existence of guarantees and free debt assets under the name of the debtor. Therefore, the probability of non-compliance should not be solely interpreted as the total loss of the owed amount.
|
Result of query
submitted to the R.A.I. (Spanish Bad Debt Register) on |
LEGAL
CLAIMS
|
|
Summary of Judicial Claims |
|
|
|
|
|
|
|
|
||
|
|
|
Not published |
|
|
|
|
Not published |
|
|
|
|
||
|
|
|
Not published |
|
|
|
|
Not published |
|
|
|
|
Not published |
|
|
|
|
1 Incidence the amount of which has not been published |
|
|
|
|
||
|
|
|
Not published |
|
|
|
|
Not published |
|
|
|
|
||
|
|
|
1 Incidence the amount of which has not been published |
|
|
Incidences Detailed |
|
Incidences with the Local Administration |
|
|
|
Last Published Stage: |
EXECUTION NOTIFICATION |
|
Requested by: |
ADMINISTRACION LOCAL |
|
Published domicile: |
(DESCONOCIDA) |
|
Source: |
B.O.E. Nº132, 2016 SUPLEMENTO 1 PAGINA 6585 |
|
Guarantees
|
|
References |
|
Link
List
|
|
|
|
|
|
PARTICIPATES
IN: |
32 Entities |
|
SHAREHOLDERS: |
2 Entities |
|
ABSORBS
TO: |
1 Entities |
|
HAS IN ITS
ADMINISTRATION BOARD TO: |
2 Entities |
|
IS RELATED
WITH: |
16 Entities |
>
Shareholders
|
Relationship |
Entity |
Province |
Shareholding
stake |
|
SHAREHOLDERS |
LA VIDA ES
CHULA SL |
BARCELONA |
89.1 |
|
|
LE GENDRE
HOLDING 29 SOCIETE PAR ACTIONS SIMPLIFIEE |
|
10 |
|
PARTICIPATES
IN |
SEPALEMEME SL |
BARCELONA |
100 |
|
|
NTS IT'S NOT
THE SAME CANARY ISLANDS SL |
SANTA CRUZ DE
TENERIFE |
100 |
|
|
GOOD EFFORT SL |
BARCELONA |
100 |
|
|
DESIGUAL SL |
BARCELONA |
100 |
|
|
INTS FRANCE
SARL |
|
100 |
|
|
NTS BELGIUM
SPRL |
|
100 |
|
|
INTS ITALIA,
S.L. |
|
100 |
|
|
INTS GERMANY,
S.A. |
|
100 |
|
|
INTS HK,
SOCIEDAD ANONIMA, (HONG KONG) |
|
100 |
|
|
INTS IT'S NOT
THE SAME AUSTRIA, S.A. |
|
100 |
|
|
INTS IT'S NOT
THE SAME CANADA, SOCIEDAD ANONIMA, (CANADA) |
|
100 |
|
|
INTS PORTUGAL
UNIPESSOAL LDA (PORTUGAL) |
|
100 |
|
|
INTS
LUXEMBOURG |
|
100 |
|
|
INTS IT S NOT
THE SAME HOLLAND BV (HOLANDA) |
|
100 |
|
|
INTS IT S NOT
THE SAME JAPAN KK |
|
|
|
|
INTS IT S NOT
THE SAME SW (SUECIA) |
|
100 |
|
|
INTS UK,
SOCIEDAD ANONIMA, (REINO UNIDO) |
|
100 |
|
|
NTS IT IS NOT THE
SAME SINGAPORE PTS, S.A. |
|
|
|
|
IT S NOT THE
SAME DENMARK APS (DINAMARCA) |
|
100 |
|
|
INTS IT S NOT
THE SAME POLAND SP ZOO (POLONIA) |
|
100 |
|
|
NTS W USA
(ESTADOS UNIDOS) |
|
100 |
|
|
INTS (SHANGAI)
GARMENTS & ACCESORIES TRADING CO LT |
|
|
|
|
INTS IT S NOT
THE SAME CHINA (CHINA) |
|
|
|
|
INTS IT'S NOT
THE SAME TAIWAN, S.A. |
|
|
|
|
INTS
(SHANGHAI) GARMENTS & ACCESSORIES TRADING CO, S.A. |
|
|
|
|
INTS IT'S NOT
THE SAME SINGAPORE PTE, S.A. |
|
|
|
|
NTS W USA LLC |
|
100 |
|
|
INTS TAIWAN,
S.A. |
|
|
|
|
INTS IT'S NOT
THE SAME GERMANY, SOCIEDAD ANONIMA, (ALEMANIA) |
|
100 |
|
|
INTS IT'S NOT
THE SAME, SOCIEDAD ANONIMA, (SUIZA) |
|
100 |
|
|
INTS IT S NOT
THE SAME SWEDEN AB (SUECIA) |
|
100 |
|
|
IT'S NOT THE
SAME CANADA, S.A. |
|
100 |
> Other
relationships
|
Relationship |
Entity |
Province |
Shareholding
stake |
|
IS RELATED
WITH |
| | |
|
|
|
|
NOVA BOCANA
BUSINESS SA |
BARCELONA |
|
|
|
INTS NINGBO G
& A BRANCH 3 (CHINA) |
|
|
|
|
ITNS NOT THE
SAME BRASIL |
|
|
|
|
ITS NOT THE
SAME MEXICO EXPORT |
|
|
|
|
ITS NOT THE
SAME MEXICO TRADE |
|
|
|
|
INTS CHINA |
|
|
|
|
INTS IRELAND,
S.A. |
|
|
|
|
INTS IT S NOT
THE SAME BRAZIL |
|
|
|
|
INTS IT S NOT
THE SAME CHINA (CHINA) |
|
|
|
|
INTS SHANGHAI |
|
|
|
|
INTS SUECIA |
|
|
|
|
INTS SWEDEN |
|
|
|
|
INTS NINGBO G
& A BRANCH 2 (CHINA) |
|
|
|
|
IT S NOT SAME
DENMARK APS |
|
|
|
|
SOLON
INVERSIONES SOCIEDAD LIMITADA |
MADRID |
|
|
IS RELATED
WITH |
PERFUMES Y
DISEÑO HOLDING SL |
MADRID |
|
|
ABSORBS TO |
MAGIC STORIES
SL |
BARCELONA |
|
|
HAS IN ITS
ADMINISTRATION BOARD TO |
LA VIDA ES
CHULA SL |
BARCELONA |
|
|
|
SOLON
INVERSIONES SOCIEDAD LIMITADA |
MADRID |
|
|
Turnover
|
|
|
Total Sales 2016 |
467.206.474 |
The sales data
is from the latest available financial statements in. Failing that, are
estimates data calculated by statistical methods.
|
Estimated
Balance
|
|
High-level company
which maintains a stable Turnover, with a net result that amounts to 8
figures. The 2016 Balance Sheet shows a solid financial status, as evidenced
by the Liquidity Ratio (3,1/1), the Treasury Ratio (2,7/1) and the Total
Solvency Ratio (2,9/1). |
|
Financial
Accounts and Balance Sheets
|
Financial Years
Presented
|
Ejercicio |
Tipo de Cuentas Anuales |
Fecha Presentacion |
|
2016 |
Normales |
December 2017 |
|
2015 |
Consolidadas |
May 2017 |
|
2015 |
Normales |
January 2017 |
|
2014 |
Consolidadas |
November 2015 |
|
2014 |
Normales |
November 2015 |
|
2013 |
Consolidadas |
No publicado en BORME |
|
2013 |
Normales |
November 2014 |
|
2012 |
Normales |
October 2013 |
|
2011 |
Normales |
November 2012 |
|
2010 |
Normales |
October 2011 |
|
2009 |
Normales |
December 2010 |
|
2008 |
Normales |
November 2009 |
|
2007 |
Normales |
July 2008 |
|
2006 |
Normales |
September 2007 |
|
2005 |
Normales |
August 2006 |
|
2004 |
Normales |
October 2005 |
|
2003 |
Normales |
April 2004 |
|
2002 |
Normales |
September 2003 |
The data in the report
regarding the last Company Accounts submitted by the company is taken from the
TRADE REGISTER serving the region in which the company's address is located
31/12/2016
> Normal format Balance in accordance with the New
Accounting Plan 2007
Information
corresponding to the fiscal year
2016 2015 2014 2013 2012 is taken from information
submitted to the TRADE REGISTER. Data corresponding to fiscal years before
2016 2015 2014 2013 2012 has been compiled based on
the equivalence criteria stipulated in Act JUS/206/2009. Where the provisions
of the Act did not establish relevant equivalence criteria. To view details on
the methodology.
|
|
ORIGINAL |
ORIGINAL |
ORIGINAL |
ORIGINAL |
ORIGINAL |
|
|
Assets |
2016 |
2015 |
2014 |
2013 |
2012 |
|
|
A) NON-CURRENT ASSETS: 11000 |
218.882.849,00 |
232.909.884,00 |
187.703.100,00 |
150.156.256,00 |
198.693.160,00 |
|
|
I. Intangible fixed assets : 11100 |
13.145.690,00 |
14.591.593,00 |
16.103.583,00 |
14.944.834,00 |
15.770.790,00 |
|
|
1. Development:
11110 |
0,00 |
0,00 |
0,00 |
0,00 |
0,00 |
|
|
2. Concessions:
11120 |
5.001.169,00 |
5.166.596,00 |
5.349.506,00 |
5.532.416,00 |
5.715.327,00 |
|
|
3. Patents, licencing,
trade marks and similar: 11130 |
0,00 |
0,00 |
0,00 |
0,00 |
0,00 |
|
|
4. Goodwill:
11140 |
0,00 |
0,00 |
0,00 |
0,00 |
0,00 |
|
|
5. IT applications:
11150 |
8.144.521,00 |
9.424.997,00 |
10.754.077,00 |
9.412.418,00 |
10.055.463,00 |
|
|
6. Investigation:
11160 |
0,00 |
0,00 |
0,00 |
0,00 |
0,00 |
|
|
7. Intellectual
property: 11180 |
0,00 |
0,00 |
0,00 |
0,00 |
0,00 |
|
|
8. Greenhouse gas
emission allowance: 11190 |
0,00 |
0,00 |
0,00 |
0,00 |
0,00 |
|
|
9. Other intangible
fixed assets. : 11170 |
0,00 |
0,00 |
0,00 |
0,00 |
0,00 |
|
|
II. Tangible fixed assets : 11200 |
90.706.547,00 |
101.617.076,00 |
89.367.133,00 |
74.181.539,00 |
68.332.826,00 |
|
|
1. Land and buildings:
11210 |
50.520.333,00 |
52.034.425,00 |
40.266.196,00 |
41.357.635,00 |
34.094.774,00 |
|
|
2. Technical
installations and other tangible fixed assets: 11220 |
40.037.592,00 |
46.258.139,00 |
31.821.850,00 |
31.896.797,00 |
33.085.144,00 |
|
|
3. Tangible asset in progress
and advances: 11230 |
148.622,00 |
3.324.512,00 |
17.279.087,00 |
927.107,00 |
1.152.908,00 |
|
|
III. Real estate investment: 11300 |
0,00 |
0,00 |
0,00 |
0,00 |
0,00 |
|
|
1. Land: 11310 |
0,00 |
0,00 |
0,00 |
0,00 |
0,00 |
|
|
2. Buildings:
11320 |
0,00 |
0,00 |
0,00 |
0,00 |
0,00 |
|
|
IV. Long-term investments in Group
companies and associates : 11400 |
85.678.495,00 |
90.061.507,00 |
66.574.213,00 |
45.560.987,00 |
105.574.100,00 |
|
|
1. Equity instruments:
11410 |
55.439.914,00 |
55.406.379,00 |
33.946.813,00 |
24.646.332,00 |
19.767.176,00 |
|
|
2. Credits to
businesses: 11420 |
30.238.581,00 |
34.655.128,00 |
32.627.400,00 |
20.914.655,00 |
85.806.924,00 |
|
|
3. Debt securities:
11430 |
0,00 |
0,00 |
0,00 |
0,00 |
0,00 |
|
|
4. Derivatives :
11440 |
0,00 |
0,00 |
0,00 |
0,00 |
0,00 |
|
|
5. Other financial
assets : 11450 |
0,00 |
0,00 |
0,00 |
0,00 |
0,00 |
|
|
6. Other investments:
11460 |
0,00 |
0,00 |
0,00 |
0,00 |
0,00 |
|
|
V. Long-term financial investments:
11500 |
149.384,00 |
256.016,00 |
161.935,00 |
126.945,00 |
129.888,00 |
|
|
1. Equity instruments:
11510 |
0,00 |
0,00 |
0,00 |
0,00 |
0,00 |
|
|
2. Credits to third
parties : 11520 |
0,00 |
0,00 |
0,00 |
0,00 |
0,00 |
|
|
3. Debt securities:
11530 |
0,00 |
0,00 |
0,00 |
0,00 |
0,00 |
|
|
4. Derivatives :
11540 |
0,00 |
0,00 |
0,00 |
0,00 |
0,00 |
|
|
5. Other financial
assets : 11550 |
149.384,00 |
256.016,00 |
161.935,00 |
126.945,00 |
129.888,00 |
|
|
6. Other investments:
11560 |
0,00 |
0,00 |
0,00 |
0,00 |
0,00 |
|
|
VII. Non-current trade debts : 11700 |
0,00 |
0,00 |
0,00 |
0,00 |
0,00 |
|
|
VI. Assets for deferred tax : 11600 |
29.202.733,00 |
26.383.692,00 |
15.496.236,00 |
15.341.951,00 |
8.885.556,00 |
|
|
B) CURRENT ASSETS: 12000 |
593.318.654,00 |
449.289.547,00 |
420.584.281,00 |
270.933.499,00 |
186.117.917,00 |
|
|
I. Non-current assets held for sale :
12100 |
0,00 |
0,00 |
0,00 |
0,00 |
0,00 |
|
|
II. Stocks: 12200 |
92.013.630,00 |
78.398.657,00 |
81.243.010,00 |
76.443.245,00 |
62.362.734,00 |
|
|
1. Commercial:
12210 |
91.906.376,00 |
77.570.322,00 |
79.873.099,00 |
74.631.100,00 |
60.097.596,00 |
|
|
2. Primary material
and other supplies: 12220 |
107.254,00 |
828.335,00 |
1.369.911,00 |
1.812.145,00 |
2.265.138,00 |
|
|
a) Long-term primary material and other supplies: 12221 |
0,00 |
0,00 |
0,00 |
0,00 |
0,00 |
|
|
b) Short-term primary material and other supplies: 12222 |
107.254,00 |
0,00 |
0,00 |
0,00 |
0,00 |
|
|
3. Work in progress:
12230 |
0,00 |
0,00 |
0,00 |
0,00 |
0,00 |
|
|
a)
Of long-term production cycle : 12231 |
0,00 |
0,00 |
0,00 |
0,00 |
0,00 |
|
|
b) Of short-term production cycle : 12232 |
0,00 |
0,00 |
0,00 |
0,00 |
0,00 |
|
|
4. Finished goods:
12240 |
0,00 |
0,00 |
0,00 |
0,00 |
0,00 |
|
|
a) Of long-term production cycle : 12241 |
0,00 |
0,00 |
0,00 |
0,00 |
0,00 |
|
|
b) Of short-term production cycle : 12242 |
0,00 |
0,00 |
0,00 |
0,00 |
0,00 |
|
|
5. By-products,
residues and recycled materials: 12250 |
0,00 |
0,00 |
0,00 |
0,00 |
0,00 |
|
|
6. Advances to
suppliers: 12260 |
0,00 |
0,00 |
0,00 |
0,00 |
0,00 |
|
|
III. Trade debtors and others receivable accounts:
12300 |
108.650.426,00 |
59.881.376,00 |
104.509.282,00 |
95.623.793,00 |
77.851.904,00 |
|
|
1. Trade debtors /
accounts receivable: 12310 |
33.342.458,00 |
38.808.445,00 |
52.830.440,00 |
46.716.474,00 |
34.164.317,00 |
|
|
a) Long-term receivables from sales and services supplied : 12311 |
0,00 |
0,00 |
0,00 |
0,00 |
0,00 |
|
|
b) Customers for sales and provisions of services : 12312 |
33.342.458,00 |
38.808.445,00 |
52.830.440,00 |
46.716.474,00 |
0,00 |
|
|
2. Customers, Group
companies and associates : 12320 |
74.418.604,00 |
20.557.375,00 |
51.035.376,00 |
32.398.573,00 |
27.902.384,00 |
|
|
3. Other accounts
receivable: 12330 |
838.150,00 |
465.173,00 |
471.012,00 |
6.948.456,00 |
232.936,00 |
|
|
4. Personnel:
12340 |
0,00 |
0,00 |
0,00 |
0,00 |
0,00 |
|
|
5. Assets for deferred
tax: 12350 |
0,00 |
0,00 |
0,00 |
0,00 |
0,00 |
|
|
6. Other debtors,
including tax and social security: 12360 |
51.214,00 |
50.383,00 |
172.454,00 |
9.560.290,00 |
15.552.267,00 |
|
|
7. Called up share
capital: 12370 |
0,00 |
0,00 |
0,00 |
0,00 |
0,00 |
|
|
IV. Short-term investments in Group
companies and associates: 12400 |
12.107.350,00 |
16.551.696,00 |
10.424.700,00 |
60.830,00 |
8.031.424,00 |
|
|
1. Equity instruments:
12410 |
0,00 |
0,00 |
0,00 |
0,00 |
0,00 |
|
|
2. Credits to
businesses: 12420 |
12.107.350,00 |
16.551.696,00 |
10.424.700,00 |
60.830,00 |
8.031.424,00 |
|
|
3. Debt securities:
12430 |
0,00 |
0,00 |
0,00 |
0,00 |
0,00 |
|
|
4. Derivatives :
12440 |
0,00 |
0,00 |
0,00 |
0,00 |
0,00 |
|
|
5. Other financial
assets : 12450 |
0,00 |
0,00 |
0,00 |
0,00 |
0,00 |
|
|
6. Other investments:
12460 |
0,00 |
0,00 |
0,00 |
0,00 |
0,00 |
|
|
V. Short-term financial investments :
12500 |
16.808.641,00 |
28.171.313,00 |
24.143.269,00 |
769.799,00 |
225.547,00 |
|
|
1. Equity instruments:
12510 |
0,00 |
0,00 |
0,00 |
0,00 |
0,00 |
|
|
2. Credits to businesses:
12520 |
0,00 |
0,00 |
0,00 |
0,00 |
0,00 |
|
|
3. Debt securities:
12530 |
0,00 |
0,00 |
0,00 |
0,00 |
0,00 |
|
|
4. Derivatives :
12540 |
16.654.116,00 |
17.521.134,00 |
23.245.762,00 |
0,00 |
0,00 |
|
|
5. Other financial
assets : 12550 |
154.525,00 |
10.650.179,00 |
897.507,00 |
769.799,00 |
225.547,00 |
|
|
6. Other investments:
12560 |
0,00 |
0,00 |
0,00 |
0,00 |
0,00 |
|
|
VI. Short-term accruals: 12600 |
1.236.275,00 |
1.124.179,00 |
763.736,00 |
575.750,00 |
657.002,00 |
|
|
VII. Cash and other equivalent liquid
assets : 12700 |
362.502.332,00 |
265.162.326,00 |
199.500.284,00 |
97.460.082,00 |
36.989.306,00 |
|
|
1. Treasury:
12710 |
83.447.229,00 |
35.162.326,00 |
199.500.284,00 |
97.460.082,00 |
36.989.306,00 |
|
|
2. Other equivalent
liquid assets: 12720 |
279.055.103,00 |
230.000.000,00 |
0,00 |
0,00 |
0,00 |
|
|
TOTAL ASSETS (A + B) : 10000 |
812.201.503,00 |
682.199.431,00 |
608.287.381,00 |
421.089.755,00 |
384.811.077,00 |
|
|
|
ORIGINAL |
ORIGINAL |
ORIGINAL |
ORIGINAL |
ORIGINAL |
|
|
Liabilities and Net Worth |
2016 |
2015 |
2014 |
2013 |
2012 |
|
|
A) NET WORTH: 20000 |
531.766.040,00 |
449.730.265,00 |
425.395.495,00 |
82.770.759,00 |
181.942.574,00 |
|
|
A-1) Shareholders' equity: 21000 |
519.275.453,00 |
441.459.739,00 |
408.658.546,00 |
87.222.994,00 |
182.786.761,00 |
|
|
I. Capital: 21100 |
20.588.406,00 |
20.588.406,00 |
20.588.406,00 |
18.529.565,00 |
18.529.565,00 |
|
|
1. Registered capital
: 21110 |
20.588.406,00 |
20.588.406,00 |
20.588.406,00 |
18.529.565,00 |
18.529.565,00 |
|
|
2. (Uncalled capital):
21120 |
0,00 |
0,00 |
0,00 |
0,00 |
0,00 |
|
|
II. Share premium: 21200 |
282.941.159,00 |
282.941.159,00 |
282.941.159,00 |
0,00 |
0,00 |
|
|
III. Reserves: 21300 |
131.406.145,00 |
105.128.981,00 |
5.693.429,00 |
5.343.475,00 |
80.621.946,00 |
|
|
1. Legal and
statutory: 21310 |
4.117.681,00 |
4.117.681,00 |
3.705.913,00 |
3.705.912,00 |
3.705.912,00 |
|
|
2. Other reserves:
21320 |
127.288.464,00 |
101.011.300,00 |
1.987.516,00 |
1.637.563,00 |
76.916.034,00 |
|
|
3. Revaluation
reserves: 21330 |
0,00 |
0,00 |
0,00 |
0,00 |
0,00 |
|
|
2. Capitalisation
Reserves: 21350 |
0,00 |
0,00 |
0,00 |
0,00 |
0,00 |
|
|
IV. (Common stock equity): 21400 |
0,00 |
0,00 |
0,00 |
0,00 |
0,00 |
|
|
V. Results from previous periods:
21500 |
0,00 |
0,00 |
0,00 |
0,00 |
0,00 |
|
|
1. Brought forward:
21510 |
0,00 |
0,00 |
0,00 |
0,00 |
0,00 |
|
|
2. (Negative results
from previous periods): 21520 |
0,00 |
0,00 |
0,00 |
0,00 |
0,00 |
|
|
VI. Other shareholders' contributions:
21600 |
0,00 |
0,00 |
0,00 |
0,00 |
0,00 |
|
|
VII. Result of the period: 21700 |
84.339.743,00 |
32.801.193,00 |
206.435.552,00 |
63.349.954,00 |
83.635.250,00 |
|
|
VIII. (Interim dividend): 21800 |
0,00 |
0,00 |
-107.000.000,00 |
0,00 |
0,00 |
|
|
IX. Other net worth instruments:
21900 |
0,00 |
0,00 |
0,00 |
0,00 |
0,00 |
|
|
A-2) Adjustments due to changes in value:
22000 |
12.490.587,00 |
8.270.526,00 |
16.736.949,00 |
-4.452.235,00 |
-844.187,00 |
|
|
I. Financial assets held for sale:
22100 |
0,00 |
0,00 |
0,00 |
0,00 |
0,00 |
|
|
II. Hedge operations: 22200 |
12.490.587,00 |
8.270.526,00 |
16.736.949,00 |
-4.452.235,00 |
-844.187,00 |
|
|
III. Linked non-current assets and liabilities
held for sale : 22300 |
0,00 |
0,00 |
0,00 |
0,00 |
0,00 |
|
|
IV. Exchange rate difference: 22400 |
0,00 |
0,00 |
0,00 |
0,00 |
0,00 |
|
|
V. Other: 22500 |
0,00 |
0,00 |
0,00 |
0,00 |
0,00 |
|
|
A-3) Received subsidies, donations and
legacies: 23000 |
0,00 |
0,00 |
0,00 |
0,00 |
0,00 |
|
|
B) NON-CURRENT LIABILITIES: 31000 |
93.895.375,00 |
64.698.314,00 |
29.597.205,00 |
102.198.591,00 |
13.328.207,00 |
|
|
I. Long-term provisions: 31100 |
18.277.310,00 |
13.387.131,00 |
2.760.053,00 |
3.984.563,00 |
0,00 |
|
|
1. Long-term employee
benefits liability: 31110 |
0,00 |
0,00 |
2.760.053,00 |
3.984.563,00 |
0,00 |
|
|
2. Environmental
actions: 31120 |
0,00 |
0,00 |
0,00 |
0,00 |
0,00 |
|
|
3. Restructuring
provisions: 31130 |
0,00 |
0,00 |
0,00 |
0,00 |
0,00 |
|
|
4. Other provisions:
31140 |
18.277.310,00 |
13.387.131,00 |
0,00 |
0,00 |
0,00 |
|
|
II Long-term creditors: 31200 |
0,00 |
0,00 |
0,00 |
69.631.741,00 |
2.926.417,00 |
|
|
1. Liabilities and
other securities: 31210 |
0,00 |
0,00 |
0,00 |
0,00 |
0,00 |
|
|
2. Amounts owed to
credit institutions: 31220 |
0,00 |
0,00 |
0,00 |
69.631.741,00 |
2.734.521,00 |
|
|
3. Creditors from
financial leasing: 31230 |
0,00 |
0,00 |
0,00 |
0,00 |
0,00 |
|
|
4. Derivatives :
31240 |
0,00 |
0,00 |
0,00 |
0,00 |
0,00 |
|
|
5. Other financial
liabilities : 31250 |
0,00 |
0,00 |
0,00 |
0,00 |
191.896,00 |
|
|
III. Long-term debts with Group companies
and associates: 31300 |
63.082.150,00 |
39.309.556,00 |
10.514.891,00 |
16.278.608,00 |
838.631,00 |
|
|
IV. Liabilities for deferred tax:
31400 |
12.535.915,00 |
12.001.627,00 |
16.322.261,00 |
12.303.679,00 |
9.563.159,00 |
|
|
V. Long-term accruals: 31500 |
0,00 |
0,00 |
0,00 |
0,00 |
0,00 |
|
|
VI. Non-current trade creditors :
31600 |
0,00 |
0,00 |
0,00 |
0,00 |
0,00 |
|
|
VII. Special long-term debts : 31700 |
0,00 |
0,00 |
0,00 |
0,00 |
0,00 |
|
|
C) CURRENT LIABILITIES : 32000 |
186.540.088,00 |
167.770.852,00 |
153.294.681,00 |
236.120.405,00 |
189.540.296,00 |
|
|
I. Liabilities linked to non-current assets
held for sale: 32100 |
0,00 |
0,00 |
0,00 |
0,00 |
0,00 |
|
|
II. Short-term provisions: 32200 |
26.237.604,00 |
25.478.536,00 |
3.425.072,00 |
2.591.157,00 |
1.709.189,00 |
|
|
1. Provisions from
greenhouse gas emission allowance: 32210 |
0,00 |
0,00 |
0,00 |
0,00 |
0,00 |
|
|
2. Other provisions:
32220 |
26.237.604,00 |
25.478.536,00 |
3.425.072,00 |
2.591.157,00 |
0,00 |
|
|
III. Short-term creditors : 32300 |
210.906,00 |
383.861,00 |
916.478,00 |
27.244.132,00 |
5.192.407,00 |
|
|
1. Liabilities and
other securities: 32310 |
0,00 |
0,00 |
0,00 |
0,00 |
0,00 |
|
|
2. Amounts owed to
credit institutions: 32320 |
40.906,00 |
52.128,00 |
128.708,00 |
20.258.340,00 |
762.180,00 |
|
|
3. Creditors from
financial leasing: 32330 |
0,00 |
0,00 |
0,00 |
0,00 |
997.357,00 |
|
|
4. Derivatives :
32340 |
0,00 |
0,00 |
0,00 |
6.360.335,00 |
1.205.981,00 |
|
|
5. Other financial
liabilities : 32350 |
170.000,00 |
331.733,00 |
787.770,00 |
625.457,00 |
2.226.889,00 |
|
|
IV. Short-term debts with Group companies
and associates: 32400 |
20.596,00 |
39.027,00 |
16.094.979,00 |
74.191.364,00 |
77.536.769,00 |
|
|
V. Trade creditors and other accounts
payable: 32500 |
160.070.982,00 |
141.869.428,00 |
132.858.152,00 |
132.089.376,00 |
105.081.787,00 |
|
|
1. Suppliers:
32510 |
124.439.366,00 |
126.361.134,00 |
116.027.183,00 |
118.561.942,00 |
96.837.083,00 |
|
|
a) Long-term debts : 32511 |
0,00 |
0,00 |
0,00 |
0,00 |
0,00 |
|
|
b) Short-term debts : 32512 |
124.439.366,00 |
126.361.134,00 |
116.027.183,00 |
118.561.942,00 |
0,00 |
|
|
2. Suppliers, Group
companies and associates: 32520 |
29.651.389,00 |
6.066.773,00 |
2.382.084,00 |
3.373.240,00 |
2.075.995,00 |
|
|
3. Other creditors:
32530 |
0,00 |
0,00 |
0,00 |
0,00 |
0,00 |
|
|
4. Personnel
(remuneration due): 32540 |
833.328,00 |
1.011.523,00 |
974.759,00 |
727.967,00 |
762.698,00 |
|
|
5. Liabilities for
current tax: 32550 |
0,00 |
0,00 |
0,00 |
0,00 |
0,00 |
|
|
6. Other accounts
payable to Public Administrations.: 32560 |
3.787.641,00 |
3.982.743,00 |
7.663.601,00 |
5.418.999,00 |
2.456.030,00 |
|
|
7. Advances from
clients: 32570 |
1.359.258,00 |
4.447.255,00 |
5.810.525,00 |
4.007.228,00 |
2.949.981,00 |
|
|
VI. Short-term accruals: 32600 |
0,00 |
0,00 |
0,00 |
4.376,00 |
20.144,00 |
|
|
VII. Special short-term debts : 32700 |
0,00 |
0,00 |
0,00 |
0,00 |
0,00 |
|
|
TOTAL NET WORTH AND LIABILITIES (A + B + C) : 30000 |
812.201.503,00 |
682.199.431,00 |
608.287.381,00 |
421.089.755,00 |
384.811.077,00 |
|
|
|
ORIGINAL |
ORIGINAL |
ORIGINAL |
ORIGINAL |
ORIGINAL |
|
|
Profit and Loss |
2016 |
2015 |
2014 |
2013 |
2012 |
|
|
1. Net turnover: 40100 |
467.206.474,00 |
483.353.782,00 |
529.093.393,00 |
452.087.225,00 |
375.186.409,00 |
|
|
a) Sales: 40110 |
467.206.474,00 |
483.353.782,00 |
529.093.393,00 |
452.087.225,00 |
375.186.409,00 |
|
|
b) Rendering of services: 40120 |
0,00 |
0,00 |
0,00 |
0,00 |
0,00 |
|
|
c) Income of financial nature of holding companies:
40130 |
0,00 |
0,00 |
0,00 |
0,00 |
0,00 |
|
|
2. Changes in stocks of finished goods and work in progress:
40200 |
0,00 |
0,00 |
0,00 |
0,00 |
0,00 |
|
|
3. Works carried out by the company for its assets: 40300 |
0,00 |
0,00 |
0,00 |
0,00 |
0,00 |
|
|
4. Supplies : 40400 |
-256.633.927,00 |
-240.670.833,00 |
-250.705.322,00 |
-208.814.801,00 |
-178.830.496,00 |
|
|
a) Stock consumption: 40410 |
-243.246.242,00 |
-215.028.761,00 |
-229.399.143,00 |
-191.635.409,00 |
-167.451.003,00 |
|
|
b) Consumption of raw materials and
miscellaneous consumable ones: 40420 |
-10.575.498,00 |
-8.389.927,00 |
-18.052.955,00 |
-15.752.872,00 |
-7.284.493,00 |
|
|
c) Works carried out by other companies:
40430 |
0,00 |
0,00 |
0,00 |
0,00 |
0,00 |
|
|
d) Impairment of stock, primary material
and other supplies: 40440 |
-2.812.187,00 |
-17.252.145,00 |
-3.253.224,00 |
-1.426.520,00 |
-4.095.000,00 |
|
|
5. Other operating income: 40500 |
66.424.965,00 |
77.890.110,00 |
84.975.566,00 |
58.490.138,00 |
43.738.806,00 |
|
|
a) Auxiliary income and other from current
management: 40510 |
66.398.543,00 |
77.890.110,00 |
84.969.396,00 |
58.436.712,00 |
43.727.785,00 |
|
|
b) Operation subsidies included in the
Period's result: 40520 |
26.422,00 |
0,00 |
6.170,00 |
53.426,00 |
11.021,00 |
|
|
6. Personnel costs: 40600 |
-45.177.654,00 |
-54.418.769,00 |
-51.743.784,00 |
-47.939.996,00 |
-42.103.338,00 |
|
|
a) Wages, salaries et al.: 40610 |
-34.280.991,00 |
-41.890.129,00 |
-38.965.517,00 |
-36.988.751,00 |
-32.369.853,00 |
|
|
b) Social security costs: 40620 |
-10.896.663,00 |
-12.528.640,00 |
-12.778.267,00 |
-10.951.245,00 |
-9.733.485,00 |
|
|
c) Provisions : 40630 |
0,00 |
0,00 |
0,00 |
0,00 |
0,00 |
|
|
7. Other operating costs: 40700 |
-149.532.838,00 |
-199.479.835,00 |
-158.713.988,00 |
-132.070.845,00 |
-120.689.928,00 |
|
|
a) External services: 40710 |
-149.669.391,00 |
-196.266.740,00 |
-154.120.677,00 |
-127.005.284,00 |
-116.653.792,00 |
|
|
b) Taxes: 40720 |
-302.143,00 |
-621.108,00 |
-498.501,00 |
-420.090,00 |
-68.743,00 |
|
|
c) Losses, impairments and variation in
provisions from trade operations : 40730 |
438.696,00 |
-2.591.987,00 |
-4.094.810,00 |
-4.645.471,00 |
-3.967.393,00 |
|
|
d) Other current management expenditure :
40740 |
0,00 |
0,00 |
0,00 |
0,00 |
0,00 |
|
|
e) Expenses due to greenhouse gas
emissions: 40750 |
0,00 |
0,00 |
0,00 |
0,00 |
0,00 |
|
|
8. Amortisation of fixed assets: 40800 |
-18.174.838,00 |
-17.729.533,00 |
-14.655.106,00 |
-13.134.933,00 |
-10.749.740,00 |
|
|
9. Allocation of subsidies of non-financial fixed assets and
other: 40900 |
0,00 |
0,00 |
0,00 |
0,00 |
0,00 |
|
|
10. Excess provisions : 41000 |
0,00 |
0,00 |
0,00 |
0,00 |
0,00 |
|
|
11. Impairment and result of transfers of fixed assets:
41100 |
-2.653.602,00 |
-2.283.506,00 |
-561.019,00 |
-2.793.604,00 |
-2.669.835,00 |
|
|
a) Impairment and losses : 41110 |
0,00 |
-32.861,00 |
-12.212,00 |
-71.965,00 |
0,00 |
|
|
b) Results for transfers and other :
41120 |
-2.653.602,00 |
-2.250.645,00 |
-548.807,00 |
-2.721.639,00 |
-2.669.835,00 |
|
|
c) Impairment and profit due to disposals of
assets of holding companies: 41130 |
0,00 |
0,00 |
0,00 |
0,00 |
0,00 |
|
|
12. Negative difference in combined businesses: 41200 |
0,00 |
0,00 |
0,00 |
0,00 |
0,00 |
|
|
13. Other results : 41300 |
0,00 |
0,00 |
0,00 |
0,00 |
0,00 |
|
|
A.1) OPERATING INCOME (1 + 2 + 3 + 4 + 5 + 6 + 7 + 8 + 9 + 10 +
11 + 12 + 13) : 49100 |
61.458.580,00 |
46.661.416,00 |
137.689.740,00 |
105.823.184,00 |
63.881.878,00 |
|
|
14. Financial income : 41400 |
37.451.899,00 |
3.225.202,00 |
123.474.665,00 |
1.721.612,00 |
44.880.808,00 |
|
|
a) Of shares in equity instruments :
41410 |
34.500.000,00 |
0,00 |
121.099.579,00 |
0,00 |
43.000.000,00 |
|
|
a 1) In Group
companies and associates: 41411 |
34.500.000,00 |
0,00 |
121.099.579,00 |
0,00 |
43.000.000,00 |
|
|
a 2) In third parties:
41412 |
0,00 |
0,00 |
0,00 |
0,00 |
0,00 |
|
|
b) From negotiable securities and other
financial instruments : 41420 |
2.951.899,00 |
3.225.202,00 |
2.375.086,00 |
1.721.612,00 |
1.880.808,00 |
|
|
b 1) From Group
companies and associates : 41421 |
1.400.143,00 |
1.671.067,00 |
951.144,00 |
1.237.219,00 |
1.290.242,00 |
|
|
b 2) From third parties
: 41422 |
1.551.756,00 |
1.554.135,00 |
1.423.942,00 |
484.393,00 |
590.566,00 |
|
|
c) Allocation of financial subsidies,
donations and legacies : 41430 |
0,00 |
0,00 |
0,00 |
0,00 |
0,00 |
|
|
15. Financial expenditure: 41500 |
-2.139.709,00 |
-1.530.455,00 |
-7.805.221,00 |
-8.853.061,00 |
-4.398.449,00 |
|
|
a) Amounts owed to Group companies and
associates : 41510 |
-1.907.422,00 |
-893.543,00 |
-2.159.734,00 |
-2.094.800,00 |
-3.894.703,00 |
|
|
b) For debts with third parties :
41520 |
-232.287,00 |
-636.912,00 |
-5.645.487,00 |
-6.758.261,00 |
-503.746,00 |
|
|
c) Stock renewal : 41530 |
0,00 |
0,00 |
0,00 |
0,00 |
0,00 |
|
|
16. Changes in fair value of financial instruments : 41600 |
0,00 |
0,00 |
-166.377,00 |
-358.429,00 |
5.427.029,00 |
|
|
a) Trading book and other : 41610 |
0,00 |
0,00 |
-166.377,00 |
-358.429,00 |
5.427.029,00 |
|
|
b) Allocation of financial assets held for
sale to the result for the period: 41620 |
0,00 |
0,00 |
0,00 |
0,00 |
0,00 |
|
|
17. Exchange rate differences : 41700 |
591.976,00 |
2.369.266,00 |
-3.064.675,00 |
1.957.587,00 |
-2.185.407,00 |
|
|
18. Impairment and result for transfers of financial
instruments: 41800 |
553.288,00 |
-10.326.188,00 |
-5.581.188,00 |
-8.008.555,00 |
-6.798.363,00 |
|
|
a) Impairment and losses : 41810 |
553.288,00 |
-10.326.188,00 |
-5.581.188,00 |
-8.008.555,00 |
-6.798.363,00 |
|
|
b) Results for transfers and other :
41820 |
0,00 |
0,00 |
0,00 |
0,00 |
0,00 |
|
|
19. Other financial income and expenditure: 42100 |
0,00 |
0,00 |
0,00 |
0,00 |
0,00 |
|
|
a) Incorporation of financial expenditure
to assets: 42110 |
0,00 |
0,00 |
0,00 |
0,00 |
0,00 |
|
|
b) Financial income from arrangement with
creditors: 42120 |
0,00 |
0,00 |
0,00 |
0,00 |
0,00 |
|
|
c) Other income and expenditure:
42130 |
0,00 |
0,00 |
0,00 |
0,00 |
0,00 |
|
|
A.2) FINANCIAL REVENUE (14+15+16+17+18+19) : 49200 |
36.457.454,00 |
-6.262.175,00 |
106.857.204,00 |
-13.540.846,00 |
36.925.618,00 |
|
|
A.3) NET RESULT BEFORE TAXES (A.1+A.2) : 49300 |
97.916.034,00 |
40.399.241,00 |
244.546.944,00 |
92.282.338,00 |
100.807.496,00 |
|
|
20. Income taxes: 41900 |
-13.576.291,00 |
-7.598.048,00 |
-38.111.392,00 |
-28.932.384,00 |
-17.172.246,00 |
|
|
A.4) PROFIT AFTER TAXES (A.3+20) : 49400 |
84.339.743,00 |
32.801.193,00 |
206.435.552,00 |
63.349.954,00 |
83.635.250,00 |
|
|
21. Result of the year coming from interrupted operations :
42000 |
0,00 |
0,00 |
0,00 |
0,00 |
0,00 |
|
|
A.5) RESULT OF THE PERIOD (A.4+21) : 49500 |
84.339.743,00 |
32.801.193,00 |
206.435.552,00 |
63.349.954,00 |
83.635.250,00 |
|
> Normal Balance Sheet under the rules of the 1990 General
Accounting Plan (repealed since 1st January of 2008)
Information
corresponding to the fiscal year
2016 2015 2014 2013 2012 has been compiled based on
the equivalence criteria stipulated in Act JUS/206/2009. Where the provisions
of the Act did not establish relevant equivalence criteria, Axesor created such
criteria using its own methodology. To view details on the methodology
2016 2015 2014 2013 2012 is taken from information
submitted to the TRADE REGISTER.
|
|
EQUIVALENCIA |
EQUIVALENCIA |
EQUIVALENCIA |
EQUIVALENCIA |
EQUIVALENCIA |
|
|
ASSETS |
2016 |
2015 |
2014 |
2013 |
2012 |
|
|
A) SHAREHOLDERS (PARTNERS) BY UNCALLED SUSCRIBED CAPITAL: |
0,00 |
0,00 |
0,00 |
0,00 |
0,00 |
|
|
B) FIXED ASSETS: |
189.680.116,00 |
206.526.192,00 |
172.206.864,00 |
134.814.305,00 |
189.807.604,00 |
|
|
I. Formation expenses: |
0,00 |
0,00 |
0,00 |
0,00 |
0,00 |
|
|
II. Intangible fixed assets: |
13.145.690,00 |
14.591.593,00 |
16.103.583,00 |
14.944.834,00 |
15.770.790,00 |
|
|
1. Research and development
costs: |
0,00 |
0,00 |
0,00 |
0,00 |
0,00 |
|
|
2. Concessions,
patents, licences, trademarks et al.: |
5.001.169,00 |
5.166.596,00 |
5.349.506,00 |
5.532.416,00 |
5.715.327,00 |
|
|
3. Goodwill: |
0,00 |
0,00 |
0,00 |
0,00 |
0,00 |
|
|
4. Key money paid for
premises: |
0,00 |
0,00 |
0,00 |
0,00 |
0,00 |
|
|
5. Software: |
8.144.521,00 |
9.424.997,00 |
10.754.077,00 |
9.412.418,00 |
10.055.463,00 |
|
|
6. Assets under
capital leases: |
0,00 |
0,00 |
0,00 |
0,00 |
0,00 |
|
|
7. Payments on
account: |
0,00 |
0,00 |
0,00 |
0,00 |
0,00 |
|
|
8. Provisions: |
0,00 |
0,00 |
0,00 |
0,00 |
0,00 |
|
|
9. Accumulated
depreciation: |
0,00 |
0,00 |
0,00 |
0,00 |
0,00 |
|
|
III. Tangible fixed assets: |
90.706.547,00 |
101.617.076,00 |
89.367.133,00 |
74.181.539,00 |
68.332.826,00 |
|
|
1. Land and
construction: |
50.520.333,00 |
52.034.425,00 |
40.266.196,00 |
41.357.635,00 |
34.094.774,00 |
|
|
2. Technical
installations and machinery: |
125.822,00 |
145.370,00 |
100.003,00 |
100.239,00 |
103.973,00 |
|
|
3. Other installations,
tools and furniture: |
27.830.711,00 |
32.154.704,00 |
22.119.830,00 |
22.171.927,00 |
22.997.964,00 |
|
|
4. Payments on account
and tangible fixed assets under construction: |
148.622,00 |
3.324.512,00 |
17.279.087,00 |
927.107,00 |
1.152.908,00 |
|
|
5. Other tangible
assets: |
12.081.059,00 |
13.958.065,00 |
9.602.017,00 |
9.624.632,00 |
9.983.207,00 |
|
|
6. Provisions: |
0,00 |
0,00 |
0,00 |
0,00 |
0,00 |
|
|
7. Accumulated
depreciation: |
0,00 |
0,00 |
0,00 |
0,00 |
0,00 |
|
|
IV. Financial investments: |
85.827.879,00 |
90.317.523,00 |
66.736.148,00 |
45.687.932,00 |
105.703.988,00 |
|
|
1. Equity investments in
group companies: |
55.439.914,00 |
55.406.379,00 |
33.946.813,00 |
24.646.332,00 |
19.767.176,00 |
|
|
2. Receivables from
group companies: |
30.238.581,00 |
34.655.128,00 |
32.627.400,00 |
20.914.655,00 |
85.806.924,00 |
|
|
3. Equity investment
in associated companies: |
0,00 |
0,00 |
0,00 |
0,00 |
0,00 |
|
|
4. Credits to
associated companies: |
0,00 |
0,00 |
0,00 |
0,00 |
0,00 |
|
|
5. Long-term
securities portfolio: |
0,00 |
0,00 |
0,00 |
0,00 |
0,00 |
|
|
6. Other receivables:
|
0,00 |
0,00 |
0,00 |
0,00 |
0,00 |
|
|
7. Long term
guarantees and deposits: |
149.384,00 |
256.016,00 |
161.935,00 |
126.945,00 |
129.888,00 |
|
|
8. Provisions: |
0,00 |
0,00 |
0,00 |
0,00 |
0,00 |
|
|
9. Long-term
receivables from public bodies: |
0,00 |
0,00 |
0,00 |
0,00 |
0,00 |
|
|
V. Own shares: |
0,00 |
0,00 |
0,00 |
0,00 |
0,00 |
|
|
VI. Long-term trade receivables: |
0,00 |
0,00 |
0,00 |
0,00 |
0,00 |
|
|
C) Deferred expenses: |
0,00 |
0,00 |
0,00 |
0,00 |
0,00 |
|
|
D) CURRENT ASSETS: |
605.867.271,00 |
458.152.105,00 |
412.834.755,00 |
286.275.450,00 |
195.003.473,00 |
|
|
I. Called-up share capital (not paid):
|
0,00 |
0,00 |
0,00 |
0,00 |
0,00 |
|
|
II. Stocks: |
92.013.630,00 |
78.398.657,00 |
81.243.010,00 |
76.443.245,00 |
62.362.734,00 |
|
|
1. Goods for resale:
|
91.906.376,00 |
77.570.322,00 |
79.873.099,00 |
74.631.100,00 |
60.097.596,00 |
|
|
2. Raw materials and
other consumables: |
107.254,00 |
828.335,00 |
1.369.911,00 |
1.812.145,00 |
2.265.138,00 |
|
|
3. Goods in process
and semifinished ones: |
0,00 |
0,00 |
0,00 |
0,00 |
0,00 |
|
|
4. Finished products:
|
0,00 |
0,00 |
0,00 |
0,00 |
0,00 |
|
|
5. Byproducts, scrap
and recovered materials: |
0,00 |
0,00 |
0,00 |
0,00 |
0,00 |
|
|
6. Payments on
account: |
0,00 |
0,00 |
0,00 |
0,00 |
0,00 |
|
|
7. Provisions: |
0,00 |
0,00 |
0,00 |
0,00 |
0,00 |
|
|
III. Debtors: |
137.853.159,00 |
86.265.068,00 |
120.005.518,00 |
110.965.744,00 |
86.737.460,00 |
|
|
1. Trade debtors /
accounts receivable: |
33.342.458,00 |
38.808.445,00 |
52.830.440,00 |
46.716.474,00 |
34.164.317,00 |
|
|
2. Accounts receivable,
Group companies: |
74.418.604,00 |
20.557.375,00 |
51.035.376,00 |
32.398.573,00 |
27.902.384,00 |
|
|
3. Accounts
receivable, associated companies: |
0,00 |
0,00 |
0,00 |
0,00 |
0,00 |
|
|
4. Other debtors:
|
838.150,00 |
465.173,00 |
471.012,00 |
6.948.456,00 |
232.936,00 |
|
|
5. Staff: |
0,00 |
0,00 |
0,00 |
0,00 |
0,00 |
|
|
6. Public bodies:
|
29.253.947,00 |
26.434.075,00 |
15.668.690,00 |
24.902.241,00 |
24.437.823,00 |
|
|
7. Provisions: |
0,00 |
0,00 |
0,00 |
0,00 |
0,00 |
|
|
IV. Short-term investments: |
291.316.978,00 |
257.201.875,00 |
11.322.207,00 |
830.629,00 |
8.256.971,00 |
|
|
1. Equity investments
in group companies: |
0,00 |
0,00 |
0,00 |
0,00 |
0,00 |
|
|
2. Receivables from
group companies: |
12.107.350,00 |
16.551.696,00 |
10.424.700,00 |
60.830,00 |
8.031.424,00 |
|
|
3. Equity investment
in associated companies: |
0,00 |
0,00 |
0,00 |
0,00 |
0,00 |
|
|
4. Credits to
associated companies: |
0,00 |
0,00 |
0,00 |
0,00 |
0,00 |
|
|
5. Short term
securities portfolio: |
279.055.103,00 |
230.000.000,00 |
0,00 |
0,00 |
0,00 |
|
|
6. Other receivables:
|
0,00 |
0,00 |
0,00 |
0,00 |
0,00 |
|
|
7. Shor term
guarantees and deposits: |
154.525,00 |
10.650.179,00 |
897.507,00 |
769.799,00 |
225.547,00 |
|
|
8. Provisions: |
0,00 |
0,00 |
0,00 |
0,00 |
0,00 |
|
|
V. Short-term treasury shares: |
0,00 |
0,00 |
0,00 |
0,00 |
0,00 |
|
|
VI. Cash at bank and in hand: |
83.447.229,00 |
35.162.326,00 |
199.500.284,00 |
97.460.082,00 |
36.989.306,00 |
|
|
VII. Prepayments and accrued income: |
1.236.275,00 |
1.124.179,00 |
763.736,00 |
575.750,00 |
657.002,00 |
|
|
GENERAL TOTAL (A + B + C + D): |
795.547.387,00 |
664.678.297,00 |
585.041.619,00 |
421.089.755,00 |
384.811.077,00 |
|
MERCANTILE REGISTRY.
|
|
EQUIVALENCIA |
EQUIVALENCIA |
EQUIVALENCIA |
EQUIVALENCIA |
EQUIVALENCIA |
|
|
LIABILITIES |
2016 |
2015 |
2014 |
2013 |
2012 |
|
|
A) EQUITY: |
515.111.924,00 |
432.209.131,00 |
402.149.733,00 |
89.131.094,00 |
183.148.555,00 |
|
|
I. Subscribed capital: |
20.588.406,00 |
20.588.406,00 |
20.588.406,00 |
18.529.565,00 |
18.529.565,00 |
|
|
II. Share premium: |
282.941.159,00 |
282.941.159,00 |
282.941.159,00 |
0,00 |
0,00 |
|
|
III. Revaluation reserves: |
0,00 |
0,00 |
0,00 |
0,00 |
0,00 |
|
|
IV. Reserves: |
127.242.616,00 |
95.878.373,00 |
-815.384,00 |
7.251.575,00 |
80.983.740,00 |
|
|
1. Legal reserve:
|
4.117.681,00 |
4.117.681,00 |
3.705.913,00 |
3.705.912,00 |
3.705.912,00 |
|
|
2. Reserves for own
shares: |
0,00 |
0,00 |
0,00 |
0,00 |
0,00 |
|
|
3. Reserves for shares
of the controlling company: |
0,00 |
0,00 |
0,00 |
0,00 |
0,00 |
|
|
4. Statutory reserves:
|
0,00 |
0,00 |
0,00 |
0,00 |
0,00 |
|
|
5. Miscellaneous
reserves: |
123.124.935,00 |
91.760.692,00 |
-4.521.297,00 |
3.545.663,00 |
77.277.828,00 |
|
|
6. Differences due to
capital adjustment to euros: |
0,00 |
0,00 |
0,00 |
0,00 |
0,00 |
|
|
V. Profit or loss brought forward: |
0,00 |
0,00 |
0,00 |
0,00 |
0,00 |
|
|
1. Retained earnings:
|
0,00 |
0,00 |
0,00 |
0,00 |
0,00 |
|
|
2. Prior year losses:
|
0,00 |
0,00 |
0,00 |
0,00 |
0,00 |
|
|
3. Partners'
contributions so as to compensate losses: |
0,00 |
0,00 |
0,00 |
0,00 |
0,00 |
|
|
VI. Profit or loss for the financial year:
|
84.339.743,00 |
32.801.193,00 |
206.435.552,00 |
63.349.954,00 |
83.635.250,00 |
|
|
VII. Interim dividend paid: |
0,00 |
0,00 |
-107.000.000,00 |
0,00 |
0,00 |
|
|
VIII. Own shares for capital reduction:
|
0,00 |
0,00 |
0,00 |
0,00 |
0,00 |
|
|
B) Deferred income: |
0,00 |
0,00 |
0,00 |
0,00 |
0,00 |
|
|
1. Capital grants:
|
0,00 |
0,00 |
0,00 |
0,00 |
0,00 |
|
|
2. Unrealised exchange
gains: |
0,00 |
0,00 |
0,00 |
0,00 |
0,00 |
|
|
3. Other deferred
income: |
0,00 |
0,00 |
0,00 |
0,00 |
0,00 |
|
|
4. Public revenues to
distribute in several financial years: |
0,00 |
0,00 |
0,00 |
0,00 |
0,00 |
|
|
C) PROVISIONS FOR LIABILITIES AND CHARGES: |
18.277.310,00 |
13.387.131,00 |
2.760.053,00 |
3.984.563,00 |
0,00 |
|
|
1. Provisions for
pension fund and other similar obligations: |
0,00 |
0,00 |
2.760.053,00 |
3.984.563,00 |
0,00 |
|
|
2. Provisions for
taxes: |
0,00 |
0,00 |
0,00 |
0,00 |
0,00 |
|
|
3. Other provisions:
|
18.277.310,00 |
13.387.131,00 |
0,00 |
0,00 |
0,00 |
|
|
4. Reversion fund:
|
0,00 |
0,00 |
0,00 |
0,00 |
0,00 |
|
|
D) LONG TERM LIABILITIES: |
75.618.065,00 |
51.311.183,00 |
26.837.152,00 |
98.214.028,00 |
13.328.207,00 |
|
|
I. Issued debentures and other marketable
securities: |
0,00 |
0,00 |
0,00 |
0,00 |
0,00 |
|
|
1. Non-convertible
debentures: |
0,00 |
0,00 |
0,00 |
0,00 |
0,00 |
|
|
2. Convertible
debentures: |
0,00 |
0,00 |
0,00 |
0,00 |
0,00 |
|
|
3. Other debt securities:
|
0,00 |
0,00 |
0,00 |
0,00 |
0,00 |
|
|
II. Amounts owed to credit institutions:
|
0,00 |
0,00 |
0,00 |
69.631.741,00 |
2.734.521,00 |
|
|
1. Loans and other
liabilities: |
0,00 |
0,00 |
0,00 |
69.631.741,00 |
2.734.521,00 |
|
|
2. Long-term
liabilities from capital leases: |
0,00 |
0,00 |
0,00 |
0,00 |
0,00 |
|
|
III. Debts with companies of the group and
affiliated ones: |
63.082.150,00 |
39.309.556,00 |
10.514.891,00 |
16.278.608,00 |
838.631,00 |
|
|
1. Amounts owed to
group companies: |
63.082.150,00 |
39.309.556,00 |
10.514.891,00 |
16.278.608,00 |
838.631,00 |
|
|
2. Amounts owed to
associated companies: |
0,00 |
0,00 |
0,00 |
0,00 |
0,00 |
|
|
IV. Other creditors: |
12.535.915,00 |
12.001.627,00 |
16.322.261,00 |
12.303.679,00 |
9.755.055,00 |
|
|
1. Long-term bills of
exchange payable: |
0,00 |
0,00 |
0,00 |
0,00 |
0,00 |
|
|
2. Other creditors:
|
0,00 |
0,00 |
0,00 |
0,00 |
191.896,00 |
|
|
3. Long term
guarantees and deposits received: |
0,00 |
0,00 |
0,00 |
0,00 |
0,00 |
|
|
4. Long term payables
to public bodies: |
12.535.915,00 |
12.001.627,00 |
16.322.261,00 |
12.303.679,00 |
9.563.159,00 |
|
|
V. Unpaid portion of equity investment:
|
0,00 |
0,00 |
0,00 |
0,00 |
0,00 |
|
|
1. Group companies:
|
0,00 |
0,00 |
0,00 |
0,00 |
0,00 |
|
|
2. Associated
companies: |
0,00 |
0,00 |
0,00 |
0,00 |
0,00 |
|
|
3. Third parties:
|
0,00 |
0,00 |
0,00 |
0,00 |
0,00 |
|
|
VI. Long term trade creditors: |
0,00 |
0,00 |
0,00 |
0,00 |
0,00 |
|
|
E) SHORT TERM CREDITORS: |
160.302.484,00 |
142.292.316,00 |
149.869.609,00 |
227.168.913,00 |
186.625.126,00 |
|
|
I. Issued debentures and other marketable
securities: |
0,00 |
0,00 |
0,00 |
0,00 |
0,00 |
|
|
1. Non-convertible
debentures: |
0,00 |
0,00 |
0,00 |
0,00 |
0,00 |
|
|
2. Convertible
debentures: |
0,00 |
0,00 |
0,00 |
0,00 |
0,00 |
|
|
3. Other debt
securities: |
0,00 |
0,00 |
0,00 |
0,00 |
0,00 |
|
|
4. Accrued interest on
debentures and other debt securities: |
0,00 |
0,00 |
0,00 |
0,00 |
0,00 |
|
|
II. Amounts owed to credit institutions:
|
40.906,00 |
52.128,00 |
128.708,00 |
20.258.340,00 |
1.759.537,00 |
|
|
1. Loans and other
liabilities: |
40.906,00 |
52.128,00 |
128.708,00 |
20.258.340,00 |
762.180,00 |
|
|
2. Accrued interest on
liabilities with credit institutions: |
0,00 |
0,00 |
0,00 |
0,00 |
0,00 |
|
|
3. Short-term
liabilities from capital leases: |
0,00 |
0,00 |
0,00 |
0,00 |
997.357,00 |
|
|
III. Short-term amounts owed to group and
associated companies: |
29.671.985,00 |
6.105.800,00 |
18.477.063,00 |
77.564.604,00 |
79.612.764,00 |
|
|
1. Amounts owed to
group companies: |
29.671.985,00 |
6.105.800,00 |
18.477.063,00 |
77.564.604,00 |
79.612.764,00 |
|
|
2. Amounts owed to
associated companies: |
0,00 |
0,00 |
0,00 |
0,00 |
0,00 |
|
|
IV. Trade creditors: |
125.798.624,00 |
130.808.389,00 |
121.837.708,00 |
122.569.170,00 |
99.787.064,00 |
|
|
1. Advanced payments
from customers: |
1.359.258,00 |
4.447.255,00 |
5.810.525,00 |
4.007.228,00 |
2.949.981,00 |
|
|
2. Amounts owed for
purchases of goods or services: |
124.439.366,00 |
126.361.134,00 |
116.027.183,00 |
118.561.942,00 |
96.837.083,00 |
|
|
3. Debts represented
by notes payable: |
0,00 |
0,00 |
0,00 |
0,00 |
0,00 |
|
|
V. Other creditors: |
4.790.969,00 |
5.325.999,00 |
9.426.130,00 |
6.772.423,00 |
5.445.617,00 |
|
|
1. Public bodies:
|
3.787.641,00 |
3.982.743,00 |
7.663.601,00 |
5.418.999,00 |
2.456.030,00 |
|
|
2. Bills of exchange
payable: |
0,00 |
0,00 |
0,00 |
0,00 |
0,00 |
|
|
3. Miscellaneous
debts: |
170.000,00 |
331.733,00 |
787.770,00 |
625.457,00 |
2.226.889,00 |
|
|
4. Wages and salaries
payable: |
833.328,00 |
1.011.523,00 |
974.759,00 |
727.967,00 |
762.698,00 |
|
|
5. Guarantees and
deposits received at short term: |
0,00 |
0,00 |
0,00 |
0,00 |
0,00 |
|
|
VI. Provisions: |
0,00 |
0,00 |
0,00 |
0,00 |
0,00 |
|
|
VII. Prepayments and accrued income: |
0,00 |
0,00 |
0,00 |
4.376,00 |
20.144,00 |
|
|
F) SHORT-TERM PROVISIONS FOR LIABILITIES AND CHARGES: |
26.237.604,00 |
25.478.536,00 |
3.425.072,00 |
2.591.157,00 |
1.709.189,00 |
|
|
GENERAL TOTAL (A + B + C + D + E + F): |
795.547.387,00 |
664.678.297,00 |
585.041.619,00 |
421.089.755,00 |
384.811.077,00 |
|
MERCANTILE REGISTRY.
|
|
EQUIVALENCIA |
EQUIVALENCIA |
EQUIVALENCIA |
EQUIVALENCIA |
EQUIVALENCIA |
|
|
DEBIT |
2016 |
2015 |
2014 |
2013 |
2012 |
|
|
A) CHARGES (A.1 to A.15): |
487.335.571,00 |
534.037.167,00 |
531.108.072,00 |
450.906.608,00 |
385.597.802,00 |
|
|
A.1. Stock reduction
of both manufactured goods and the ones in process: |
0,00 |
0,00 |
0,00 |
0,00 |
0,00 |
|
|
A.2. Supplies: |
253.821.740,00 |
223.418.688,00 |
247.452.098,00 |
207.388.281,00 |
174.735.496,00 |
|
|
a) Stock consumption: |
243.246.242,00 |
215.028.761,00 |
229.399.143,00 |
191.635.409,00 |
167.451.003,00 |
|
|
b) Consumption of raw materials and miscellaneous consumable ones: |
10.575.498,00 |
8.389.927,00 |
18.052.955,00 |
15.752.872,00 |
7.284.493,00 |
|
|
c)
Miscellaneous external expenditure: |
0,00 |
0,00 |
0,00 |
0,00 |
0,00 |
|
|
A.3. Staff costs:
|
45.177.654,00 |
54.418.769,00 |
51.743.784,00 |
47.939.996,00 |
42.103.338,00 |
|
|
a) Wages, salaries et al.: |
34.280.991,00 |
41.890.129,00 |
38.965.517,00 |
36.988.751,00 |
32.369.853,00 |
|
|
b) Social security costs: |
10.896.663,00 |
12.528.640,00 |
12.778.267,00 |
10.951.245,00 |
9.733.485,00 |
|
|
A.4. Depreciation
expense: |
18.174.838,00 |
17.729.533,00 |
14.655.106,00 |
13.134.933,00 |
10.749.740,00 |
|
|
A.5. Variation of
trade provisions and losses of unrecovered receivables: |
2.373.491,00 |
19.844.132,00 |
7.348.034,00 |
6.071.991,00 |
8.062.393,00 |
|
|
a) Stock provision variation: |
2.812.187,00 |
17.252.145,00 |
3.253.224,00 |
1.426.520,00 |
4.095.000,00 |
|
|
b) Variation in provision and bad debt losses: |
-438.696,00 |
2.591.987,00 |
4.094.810,00 |
4.645.471,00 |
3.967.393,00 |
|
|
c) Variation of other trade provisions: |
0,00 |
0,00 |
0,00 |
0,00 |
0,00 |
|
|
A.6. Other operating
charges: |
149.971.534,00 |
196.887.848,00 |
154.619.178,00 |
127.425.374,00 |
116.722.535,00 |
|
|
a) External services: |
149.669.391,00 |
196.266.740,00 |
154.120.677,00 |
127.005.284,00 |
116.653.792,00 |
|
|
b) Taxes: |
302.143,00 |
621.108,00 |
498.501,00 |
420.090,00 |
68.743,00 |
|
|
c) Other operating expenses: |
0,00 |
0,00 |
0,00 |
0,00 |
0,00 |
|
|
d) Allocation to revision fund: |
0,00 |
0,00 |
0,00 |
0,00 |
0,00 |
|
|
A.I. OPERATING BENEFITS
(B.1+B.2+B.3+B.4-A.1-A.2-A.3-A.4-A.5-A.6): |
64.112.182,00 |
48.944.922,00 |
138.250.759,00 |
108.616.788,00 |
66.551.713,00 |
|
|
A.7. Financial and
similar charges: |
2.139.709,00 |
1.530.455,00 |
7.805.221,00 |
8.853.061,00 |
4.398.449,00 |
|
|
a) Due to liabilities with companies of the group: |
1.907.422,00 |
893.543,00 |
2.159.734,00 |
2.094.800,00 |
3.894.703,00 |
|
|
b)
Due to liabilities with associated companies: |
0,00 |
0,00 |
0,00 |
0,00 |
0,00 |
|
|
c) Due to other debts.: |
232.287,00 |
636.912,00 |
5.645.487,00 |
6.758.261,00 |
503.746,00 |
|
|
d)
Losses from financial investments: |
0,00 |
0,00 |
0,00 |
0,00 |
0,00 |
|
|
A.8. Changes in
financial investment provisions: |
-545.806,00 |
10.218.966,00 |
5.699.970,00 |
8.366.984,00 |
6.798.363,00 |
|
|
A.9. Exchange losses:
|
0,00 |
0,00 |
3.064.675,00 |
0,00 |
2.185.407,00 |
|
|
A.II. NET FINANCIAL INCOME
(B.5+B.6+B.7+B.8-A.7-A.8-A.9): |
36.449.972,00 |
0,00 |
106.904.799,00 |
0,00 |
36.925.618,00 |
|
|
A.III. PROFIT FROM ORDINARY ACTIVITIES
(A.I+A.II-B.I-B.II): |
100.562.154,00 |
42.789.969,00 |
245.155.558,00 |
95.075.942,00 |
103.477.331,00 |
|
|
A.10. Changes in
provisions for intangible, tangible and securities portfolio: |
-7.482,00 |
140.083,00 |
59.807,00 |
71.965,00 |
0,00 |
|
|
A.11. Losses from
tangible and intangible fixed assets and securities portfolio: |
2.653.602,00 |
2.250.645,00 |
548.807,00 |
2.721.639,00 |
2.669.835,00 |
|
|
A.12. Losses from
transactions with own shares and debentures: |
0,00 |
0,00 |
0,00 |
0,00 |
0,00 |
|
|
A.13. Extraordinary
expenses: |
0,00 |
0,00 |
0,00 |
0,00 |
0,00 |
|
|
A.14. Expenses and losses
of former financial years: |
0,00 |
0,00 |
0,00 |
0,00 |
0,00 |
|
|
A.IV. EXTRAORDINARY PROFIT
(B.9+B.10+B.11+B.12+B.13-A.10-A.11-A.12-A.13-A.14): |
0,00 |
0,00 |
0,00 |
0,00 |
0,00 |
|
|
A.V. PROFIT BEFORE TAXES (A.III+A.IV-B.III-B.IV):
|
97.916.034,00 |
40.399.241,00 |
244.546.944,00 |
92.282.338,00 |
100.807.496,00 |
|
|
A.15. Corporation tax:
|
13.576.291,00 |
7.598.048,00 |
38.111.392,00 |
28.932.384,00 |
17.172.246,00 |
|
|
A.16. Miscellaneous
taxes: |
0,00 |
0,00 |
0,00 |
0,00 |
0,00 |
|
|
A.VI. FINANCIAL YEAR RESULTS (PROFIT)
(A.V-A.15-A.16): |
84.339.743,00 |
32.801.193,00 |
206.435.552,00 |
63.349.954,00 |
83.635.250,00 |
|
MERCANTILE REGISTRY.
|
|
EQUIVALENCIA |
EQUIVALENCIA |
EQUIVALENCIA |
EQUIVALENCIA |
EQUIVALENCIA |
|
|
CREDIT |
2016 |
2015 |
2014 |
2013 |
2012 |
|
|
B) INCOME ( B.1 to B.13): |
571.675.314,00 |
566.838.360,00 |
737.543.624,00 |
514.256.562,00 |
469.233.052,00 |
|
|
B.1. Net total sales:
|
467.206.474,00 |
483.353.782,00 |
529.093.393,00 |
452.087.225,00 |
375.186.409,00 |
|
|
a) Sales: |
467.206.474,00 |
483.353.782,00 |
529.093.393,00 |
452.087.225,00 |
375.186.409,00 |
|
|
b) Rendering of services: |
0,00 |
0,00 |
0,00 |
0,00 |
0,00 |
|
|
Returns and Rappel on sales: |
0,00 |
0,00 |
0,00 |
0,00 |
0,00 |
|
|
B.2. Stock increase of
manufactured goods and products in process: |
0,00 |
0,00 |
0,00 |
0,00 |
0,00 |
|
|
B.3. Works performed
by the company for fixed assets: |
0,00 |
0,00 |
0,00 |
0,00 |
0,00 |
|
|
B.4. Miscellaneous
operating income: |
66.424.965,00 |
77.890.110,00 |
84.975.566,00 |
58.490.138,00 |
43.738.806,00 |
|
|
a) Auxiliary income and other from current management: |
66.398.543,00 |
77.890.110,00 |
84.969.396,00 |
58.436.712,00 |
43.727.785,00 |
|
|
b) Grants: |
26.422,00 |
0,00 |
6.170,00 |
53.426,00 |
11.021,00 |
|
|
c) Liabilities and charges provisions surplus: |
0,00 |
0,00 |
0,00 |
0,00 |
0,00 |
|
|
B.I. PÉRDIDAS DE EXPLOTACIÓN
(A.1+A.2+A.3+A.4+A.5-A.6-B.1-B.2-B.3-B.4): |
0,00 |
0,00 |
0,00 |
0,00 |
0,00 |
|
|
B.5. Income from
equity investment: |
34.500.000,00 |
0,00 |
121.099.579,00 |
0,00 |
43.000.000,00 |
|
|
a) In companies of the group: |
34.500.000,00 |
0,00 |
121.099.579,00 |
0,00 |
43.000.000,00 |
|
|
b) In associated companies: |
0,00 |
0,00 |
0,00 |
0,00 |
0,00 |
|
|
c) Third parties: |
0,00 |
0,00 |
0,00 |
0,00 |
0,00 |
|
|
B.6. Income from other
marketable securities and long-term receivables: |
0,00 |
0,00 |
0,00 |
0,00 |
0,00 |
|
|
a) From companies of the group: |
0,00 |
0,00 |
0,00 |
0,00 |
0,00 |
|
|
b) From associated companies: |
0,00 |
0,00 |
0,00 |
0,00 |
0,00 |
|
|
c) From companies out of the group: |
0,00 |
0,00 |
0,00 |
0,00 |
0,00 |
|
|
B.7. Miscellaneous interests
or similar income: |
2.951.899,00 |
3.225.202,00 |
2.375.086,00 |
1.721.612,00 |
7.307.837,00 |
|
|
a) From companies of the group: |
1.400.143,00 |
1.671.067,00 |
951.144,00 |
1.237.219,00 |
1.290.242,00 |
|
|
b) From associated companies: |
0,00 |
0,00 |
0,00 |
0,00 |
0,00 |
|
|
c) Miscellaneous interests: |
1.551.756,00 |
1.554.135,00 |
1.423.942,00 |
484.393,00 |
590.566,00 |
|
|
d)
Profit on financial investment: |
0,00 |
0,00 |
0,00 |
0,00 |
5.427.029,00 |
|
|
B.8. Exchange positive
differences: |
591.976,00 |
2.369.266,00 |
0,00 |
1.957.587,00 |
0,00 |
|
|
B.II. NEGATIVE FINANCIAL RESULTS (A.7+A.8+A.9-B.5-B.6-B.7-B.8):
|
0,00 |
6.154.953,00 |
0,00 |
13.540.846,00 |
0,00 |
|
|
B.III. LOSSES ON ORDINARY ACTIVITIES ( B.I
+ B.II - A.I - A.II ): |
0,00 |
0,00 |
0,00 |
0,00 |
0,00 |
|
|
B.9.Profit on disposal
of both tangible and intangible fixed assets and securities portfolio: |
0,00 |
0,00 |
0,00 |
0,00 |
0,00 |
|
|
B.10. Profit on
transactions with own shares and debentures: |
0,00 |
0,00 |
0,00 |
0,00 |
0,00 |
|
|
B.11. Capital grants
transferred to profit and loss: |
0,00 |
0,00 |
0,00 |
0,00 |
0,00 |
|
|
B.12. Extraordinary
income: |
0,00 |
0,00 |
0,00 |
0,00 |
0,00 |
|
|
B.13. Income and
profit of former financial years: |
0,00 |
0,00 |
0,00 |
0,00 |
0,00 |
|
|
B.IV. NEGATIVE EXTRAORDINARY RESULTS
(A.10+A.11+A.12+A.13+A.14-B.9-B.10-B.11-B.12-B.13): |
2.646.120,00 |
2.390.728,00 |
608.614,00 |
2.793.604,00 |
2.669.835,00 |
|
|
B.V. LOSSES BEFORE TAXES
(B.III+B.IV-A.III-A.IV): |
0,00 |
0,00 |
0,00 |
0,00 |
0,00 |
|
|
B.VI. RESULT OF THE PERIOD (LOSSES)
(B.V+A.15+A.16): |
0,00 |
0,00 |
0,00 |
0,00 |
0,00 |
|
MERCANTILE REGISTRY.
|
CASHFLOW
STATEMENT
|
Model: Normal
> Source of information: Data contained in this section is
taken from the information declared in the Annual Accounts submitted to the
Trade Register.
|
Net Rights Granted |
2016 |
2015 |
2014 |
2013 |
2012 |
|
|
1. Fiscal year result before taxes.: 61100 |
97.916.034,00 |
40.399.241,00 |
244.546.944,00 |
92.282.338,00 |
100.807.496,00 |
|
|
2. Results adjustments.: 61200 |
-7.704.135,00 |
80.238.326,00 |
-84.671.428,00 |
40.407.905,00 |
-15.443.650,00 |
|
|
a) Fixed Assets Amortization (+).:
61201 |
18.174.838,00 |
17.729.533,00 |
14.655.106,00 |
13.134.933,00 |
10.749.740,00 |
|
|
b) Obsolescence Allowances (+/-). :
61202 |
0,00 |
0,00 |
6.969.651,00 |
10.730.194,00 |
0,00 |
|
|
c) Variation in Provision (+/-). :
61203 |
7.924.889,00 |
53.957.852,00 |
0,00 |
11.010.487,00 |
14.860.756,00 |
|
|
e) Results on disposal of fixed assets
(+/-). : 61205 |
2.653.592,00 |
2.250.645,00 |
561.019,00 |
0,00 |
2.669.835,00 |
|
|
f) Results on disposal of financial
instruments (+/-).: 61206 |
-553.288,00 |
10.326.188,00 |
5.581.188,00 |
0,00 |
0,00 |
|
|
g) Financial income (-).: 61207 |
-2.951.899,00 |
-3.225.202,00 |
-2.375.086,00 |
-1.721.612,00 |
-1.880.808,00 |
|
|
h) Financial Expenses (+). : 61208 |
2.139.709,00 |
1.568.576,00 |
7.805.221,00 |
8.853.061,00 |
4.398.449,00 |
|
|
i) Exchange differences (+/-). :
61209 |
-591.976,00 |
-2.369.266,00 |
3.064.675,00 |
-1.957.587,00 |
2.185.407,00 |
|
|
j) Reasonable Value Variation in Financial
Instruments (+/-).: 61210 |
0,00 |
0,00 |
166.377,00 |
358.429,00 |
-5.427.029,00 |
|
|
k) Other income and expense (-/+). :
61211 |
-34.500.000,00 |
0,00 |
-121.099.579,00 |
0,00 |
-43.000.000,00 |
|
|
3. Changes in current capital equity.: 61300 |
-45.161.503,00 |
37.603.163,00 |
-23.063.496,00 |
-10.091.219,00 |
16.308.965,00 |
|
|
a) Stock (+/-).: 61301 |
-16.427.160,00 |
-14.407.792,00 |
-8.052.989,00 |
-15.507.031,00 |
3.739.451,00 |
|
|
d) Debtors and other accounts receivable
(+/-). : 61302 |
-47.581.008,00 |
43.197.787,00 |
-22.368.135,00 |
-28.409.337,00 |
9.641.183,00 |
|
|
c) Other current assets (+/-). :
61303 |
292.561,00 |
-238.372,00 |
9.199.850,00 |
6.073.229,00 |
-15.311.464,00 |
|
|
d) Creditors and other accounts payable
(+/-). : 61304 |
21.983.618,00 |
14.058.904,00 |
-6.128.473,00 |
25.742.064,00 |
14.113.031,00 |
|
|
e) Other current liabilities (+/-).:
61305 |
-3.429.514,00 |
-5.007.364,00 |
4.286.251,00 |
2.009.856,00 |
-9.728.933,00 |
|
|
f) Other non-current assets and liabilities
(+/-).: 61306 |
0,00 |
0,00 |
0,00 |
0,00 |
13.855.697,00 |
|
|
4. Cash Flows from Other Operating Activities: 61400 |
17.186.348,00 |
-34.568.729,00 |
78.142.560,00 |
-38.227.515,00 |
23.939.064,00 |
|
|
a) Interest payments (-). : 61401 |
-2.139.709,00 |
-1.568.576,00 |
-7.805.221,00 |
-8.853.061,00 |
-4.398.449,00 |
|
|
b) Dividend payment collection (+). :
61402 |
34.500.000,00 |
0,00 |
121.099.579,00 |
0,00 |
43.000.000,00 |
|
|
c) Interest collection (+). : 61403 |
2.951.899,00 |
3.225.202,00 |
2.375.086,00 |
1.721.612,00 |
1.880.808,00 |
|
|
d) Income tax payment collection (payments)
(+/-).: 61404 |
-18.125.842,00 |
-36.225.355,00 |
-37.526.884,00 |
-31.096.066,00 |
-16.543.295,00 |
|
|
5. Cash Flows from Operating Activities (1 + 2 + 3 + 4) :
61500 |
62.236.744,00 |
123.672.001,00 |
214.954.580,00 |
84.371.509,00 |
125.611.875,00 |
|
|
6. Payments for investment (-).: 62100 |
-9.007.963,00 |
-76.494.538,00 |
-68.611.470,00 |
-34.386.201,00 |
-100.278.874,00 |
|
|
a) Companies of the group and affiliates. :
62101 |
-535.955,00 |
-33.114.734,00 |
-36.958.284,00 |
-12.887.712,00 |
-51.577.537,00 |
|
|
b) Intangible fixed assets. : 62102 |
-3.677.245,00 |
-4.624.560,00 |
-6.437.100,00 |
-4.021.442,00 |
-5.743.902,00 |
|
|
c) Fixed assets. : 62103 |
-4.794.763,00 |
-26.126.432,00 |
-25.123.368,00 |
-16.929.852,00 |
-42.957.435,00 |
|
|
e) Other financial assets. : 62105 |
0,00 |
-12.628.812,00 |
-92.718,00 |
-547.195,00 |
0,00 |
|
|
7. Divestment payment collection (+). : 62200 |
14.910.900,00 |
3.374.934,00 |
0,00 |
72.862.863,00 |
38.045.813,00 |
|
|
a) Companies of the group and affiliates. :
62201 |
0,00 |
3.374.934,00 |
0,00 |
72.862.863,00 |
0,00 |
|
|
b) Intangible fixed assets. : 62202 |
0,00 |
0,00 |
0,00 |
0,00 |
7.526,00 |
|
|
c) Fixed assets. : 62203 |
0,00 |
0,00 |
0,00 |
0,00 |
12.792.475,00 |
|
|
e) Other financial assets. : 62205 |
14.910.900,00 |
0,00 |
0,00 |
0,00 |
25.245.812,00 |
|
|
8. Cash Flow from Investing Activities (6+7) less Amortization:
62300 |
5.902.937,00 |
-73.119.604,00 |
-68.611.470,00 |
38.476.662,00 |
-62.233.061,00 |
|
|
9. Payment collection and payments for equity instruments. :
63100 |
0,00 |
0,00 |
285.000.000,00 |
0,00 |
0,00 |
|
|
a) Issuance of equity instruments (+). :
63101 |
0,00 |
0,00 |
285.000.000,00 |
0,00 |
0,00 |
|
|
10. Payment collection and payments for financial liabilities
instruments.: 63200 |
35.982.147,00 |
15.424.635,00 |
-158.840.791,00 |
88.384.978,00 |
-35.809.712,00 |
|
|
a) Issuance : 63201 |
0,00 |
15.957.252,00 |
0,00 |
89.574.231,00 |
0,00 |
|
|
2. Debts incurred with credit institutions
(+). : 63203 |
0,00 |
0,00 |
0,00 |
86.393.380,00 |
0,00 |
|
|
3. Debts incurred with companies of the
group and affiliates (+).: 63204 |
0,00 |
15.957.252,00 |
0,00 |
3.180.851,00 |
0,00 |
|
|
b) Repayment and amortization of :
63207 |
35.982.147,00 |
-532.617,00 |
-158.840.791,00 |
-1.189.253,00 |
-35.809.712,00 |
|
|
2. Debts incurred with credit institutions
(-).: 63209 |
-172.955,00 |
-532.617,00 |
-89.761.373,00 |
-1.189.253,00 |
-5.255.141,00 |
|
|
3. Debts incurred with companies of the
group and affiliates (-). : 63210 |
36.155.102,00 |
0,00 |
-69.079.418,00 |
0,00 |
-30.554.571,00 |
|
|
11. Payments from dividends and remunerations from other assets
instruments. : 63300 |
-6.523.029,00 |
0,00 |
-170.000.000,00 |
-150.000.000,00 |
0,00 |
|
|
a) Dividends (-).: 63301 |
-6.523.029,00 |
0,00 |
-170.000.000,00 |
-150.000.000,00 |
0,00 |
|
|
12. Cash Flows from Financing Activities (9+10+11): 63400 |
29.459.118,00 |
15.424.635,00 |
-43.840.791,00 |
-61.615.022,00 |
-35.809.712,00 |
|
|
D) EFFECT OF EXCHANGE RATE CHANGES: 64000 |
-258.793,00 |
-314.990,00 |
-462.117,00 |
-762.373,00 |
0,00 |
|
|
E) NET INCREASE/DECREASE OF CASH OR EQUIVALENT ASSETS
(+/-5+/-8+/12+/-D) : 65000 |
97.340.006,00 |
65.662.042,00 |
102.040.202,00 |
60.470.776,00 |
27.569.102,00 |
|
|
Cash or equivalent assets as of beginning
of the fiscal year.: 65100 |
265.162.326,00 |
199.500.284,00 |
97.460.082,00 |
36.989.306,00 |
9.420.204,00 |
|
|
Cash or equivalent assets as of end of the
fiscal year.: 65200 |
362.502.332,00 |
265.162.326,00 |
199.500.284,00 |
97.460.082,00 |
36.989.306,00 |
|
|
FINANCIAL
DIAGNOSIS
|
> Economic-Financial Comparative Analysis
Data used in the following ratios and indicators is
taken from the Annual Accounts submitted by the company to the TRADE REGISTER.
> Comparison within the Sector
|
Cash Flow |
2016 |
2015 |
Variación 2016 - 2015 |
|
|||
|
|
Empresa |
Sector |
Empresa |
Sector |
Empresa |
Sector |
|
|
Cash Flow over Sales: |
0,21 % |
0,01 % |
0,14 % |
0,06 % |
53,37 % |
-83,58 % |
|
|
Net Financial Debt: |
-4,61 |
2,08 |
-4,39 |
2,84 |
-4,85 |
-26,98 |
|
|
Cash Flow Yield: |
0,12 % |
0,01 % |
0,10 % |
0,03 % |
24,52 % |
-83,07 % |
|
|
EBITDA over Sales: |
17,61 % |
12,08 % |
13,79 % |
10,44 % |
27,68 % |
15,71 % |
|
|
Profitability |
2016 |
2015 |
Variación 2016 - 2015 |
|
|||
|
|
Empresa |
Sector |
Empresa |
Sector |
Empresa |
Sector |
|
|
Operating economic profitability: |
8,81 % |
8,95 % |
8,53 % |
6,93 % |
3,33 % |
29,11 % |
|
|
Total economic profitability: |
12,32 % |
5,18 % |
6,15 % |
3,20 % |
100,43 % |
61,93 % |
|
|
Financial profitability: |
16,24 % |
7,82 % |
7,43 % |
4,16 % |
118,59 % |
88,10 % |
|
|
Margin: |
11,52 % |
7,84 % |
8,31 % |
6,34 % |
38,53 % |
23,70 % |
|
|
Mark-up: |
18,35 % |
7,35 % |
7,20 % |
3,78 % |
154,91 % |
94,36 % |
|
|
Solvency |
2016 |
2015 |
Variación 2016 - 2015 |
|
|||
|
|
Empresa |
Sector |
Empresa |
Sector |
Empresa |
Sector |
|
|
Liquidity: |
2,26 |
0,16 |
1,86 |
0,14 |
21,35 |
13,51 |
|
|
Acid Test: |
3,12 |
0,89 |
2,60 |
0,87 |
20,04 |
2,66 |
|
|
Working Capital / Investment: |
0,50 |
0,03 |
0,41 |
0,03 |
21,37 |
0,87 |
|
|
Solvency: |
3,88 |
1,20 |
3,34 |
1,19 |
16,17 |
0,97 |
|
|
Indebtedness |
2016 |
2015 |
Variación 2016 - 2015 |
|
|||
|
|
Empresa |
Sector |
Empresa |
Sector |
Empresa |
Sector |
|
|
Indebtedness level: |
0,44 |
1,21 |
0,43 |
1,31 |
3,11 |
-7,40 |
|
|
Borrowing Composition: |
0,47 |
1,02 |
0,36 |
1,04 |
30,81 |
-1,72 |
|
|
Repayment Ability: |
2,87 |
8,95 |
2,90 |
11,05 |
-1,26 |
-19,01 |
|
|
Warranty: |
3,44 |
1,84 |
3,52 |
1,78 |
-2,30 |
3,50 |
|
|
Generated resources / Total creditors: |
0,44 |
0,10 |
0,40 |
0,08 |
10,08 |
25,47 |
|
|
Efficiency |
2016 |
2015 |
Variación 2016 - 2015 |
|
|||
|
|
Empresa |
Sector |
Empresa |
Sector |
Empresa |
Sector |
|
|
Productivity: |
2,82 |
1,92 |
2,23 |
1,80 |
26,79 |
6,76 |
|
|
Turnover of Collection Rights : |
4,91 |
5,15 |
9,37 |
5,23 |
-47,60 |
-1,42 |
|
|
Turnover of Payment Entitlements: |
2,54 |
3,54 |
3,10 |
3,69 |
-18,21 |
-4,10 |
|
|
Stock rotation: |
5,10 |
8,16 |
6,53 |
7,79 |
-21,91 |
4,64 |
|
|
Assets turnover: |
0,77 |
1,14 |
1,03 |
1,09 |
-25,41 |
4,37 |
|
|
Borrowing Cost: |
0,91 |
2,35 |
0,79 |
2,45 |
14,73 |
-4,07 |
|
> Trend of indicators under the General Accounting Plan of 2007
(2016, 2015, 2014, 2013, 2012)
|
Cash Flow |
2016 |
2015 |
2014 |
2013 |
2012 |
|
|
Cash Flow over Sales: |
0,21 % |
0,14 % |
0,19 % |
0,13 % |
0,07 % |
|
|
Net Financial Debt: |
-4,61 |
-4,39 |
-1,46 |
-0,01 |
-0,38 |
|
|
Cash Flow Yield: |
0,12 % |
0,10 % |
0,17 % |
0,14 % |
0,07 % |
|
|
EBITDA over Sales: |
17,61 % |
13,79 % |
28,90 % |
26,93 % |
20,60 % |
|
|
Profitability |
2016 |
2015 |
2014 |
2013 |
2012 |
|
|
Operating economic profitability: |
8,81 % |
8,53 % |
27,16 % |
28,25 % |
23,59 % |
|
|
Total economic profitability: |
12,32 % |
6,15 % |
41,49 % |
24,02 % |
27,34 % |
|
|
Financial profitability: |
16,24 % |
7,43 % |
50,52 % |
72,63 % |
45,76 % |
|
|
Margin: |
11,52 % |
8,31 % |
22,42 % |
20,73 % |
15,25 % |
|
|
Mark-up: |
18,35 % |
7,20 % |
39,82 % |
18,07 % |
24,06 % |
|
|
Solvency |
2016 |
2015 |
2014 |
2013 |
2012 |
|
|
Liquidity: |
2,26 |
1,86 |
1,33 |
0,42 |
0,20 |
|
|
Acid Test: |
3,12 |
2,60 |
2,26 |
0,83 |
0,66 |
|
|
Working Capital / Investment: |
0,50 |
0,41 |
0,44 |
0,08 |
-0,01 |
|
|
Solvency: |
3,88 |
3,34 |
2,91 |
1,23 |
1,04 |
|
|
Indebtedness |
2016 |
2015 |
2014 |
2013 |
2012 |
|
|
Indebtedness level: |
0,44 |
0,43 |
0,43 |
3,64 |
1,10 |
|
|
Borrowing Composition: |
0,47 |
0,36 |
0,18 |
0,42 |
0,07 |
|
|
Repayment Ability: |
2,87 |
2,90 |
1,16 |
2,72 |
2,60 |
|
|
Warranty: |
3,44 |
3,52 |
3,44 |
1,27 |
1,91 |
|
|
Generated resources / Total creditors: |
0,44 |
0,40 |
1,30 |
0,26 |
0,52 |
|
|
Efficiency |
2016 |
2015 |
2014 |
2013 |
2012 |
|
|
Productivity: |
2,82 |
2,23 |
3,96 |
3,54 |
2,84 |
|
|
Turnover of Collection Rights : |
4,91 |
9,37 |
5,88 |
5,34 |
5,38 |
|
|
Turnover of Payment Entitlements: |
2,54 |
3,10 |
3,08 |
2,58 |
2,85 |
|
|
Stock rotation: |
5,10 |
6,53 |
5,86 |
5,26 |
5,65 |
|
|
Assets turnover: |
0,77 |
1,03 |
1,21 |
1,36 |
1,55 |
|
|
Borrowing Cost: |
0,91 |
0,79 |
4,42 |
2,67 |
2,19 |
|
COMPARATIVE
SECTORIAL BALANCE
|
Sector-based Comparison
under the rules of the New General Accounting Plan.
|
Net Rights Granted |
Variación - |
|
|
|
Empresa |
Sector |
|
Net Rights Granted |
Variación - |
|
|
|
Empresa |
Sector |
|
Net Rights Granted |
Variación - |
|
|
|
Empresa |
Sector |
|
News |
|
ELPERIÓDICO.COM |
27/07/2017 |
|
Desigual factura 378 millones el primer semestre, un 9,6% menos |
|
|
Companies related |
|
|
|
|
|
Diario de Sevilla |
24/05/2017 |
|
Desigual, la última que alza la voz en contra de los retoques |
|
|
Companies related |
|
|
|
|
|
Public
Tenders and Works Won
|
No Public Tenders
assigned to the name of the company.
Detail
of Subsidies appearing in Balances Memories
|
|
|
|
|
|
Entity |
ORGANISMO NO ESPECIFICADO |
|
Status |
CONCEDIDA |
|
Amount Granted |
26.422,00 |
|
Research
Summary
|
|
It was incorporated in January 2003 with a Sharehodler
Equity that amounted to Euro 20,588,406 Whole trade of clothes and
complements for women, men and children. |
|
Answer
to additional question
|
|
The subject is the parent company of all the companies
within the group at the national level. The subject markets the products of
the company ''''Desigual''''. The subject is 100% managed by the company ''La
Vida es Chula SL.'', which is owned by Tomás Meyer, founder of Desigual.
''''Desigual'' has over 330 stores worldwide. |
|
Sources
|
|
Registry of Commerce's Official Gazette. Own and external
data bases Company References |
FOREIGN EXCHANGE RATES
|
Currency |
Unit
|
Indian Rupees |
|
US Dollar |
1 |
INR 63.50 |
|
|
1 |
INR 90.92 |
|
Euro |
1 |
INR 79.07 |
|
Euro |
1 |
INR 78.92 |
Note :
Above are approximate rates obtained from sources believed to be correct
INFORMATION DETAILS
|
Analysis Done by
: |
NIY |
|
|
|
|
Report Prepared
by : |
KET |
RATING EXPLANATIONS
|
Credit Rating |
Explanation |
Rating Comments |
|
A++ |
Minimum Risk |
Business dealings permissible with minimum
risk of default |
|
A+ |
Low Risk |
Business dealings permissible with low
risk of default |
|
A |
Acceptable Risk |
Business dealings permissible with
moderate risk of default |
|
B |
Medium Risk |
Business dealings permissible on a regular
monitoring basis |
|
C |
Medium High Risk |
Business dealings permissible preferably
on secured basis |
|
D |
High Risk |
Business dealing not recommended or on
secured terms only |
|
NB |
New Business |
No recommendation can be done due to
business in infancy stage |
|
NT |
No Trace |
No recommendation can be done as the
business is not traceable |
NB is stated where there is insufficient information to facilitate rating. However, it is not to be considered as unfavourable.
This score serves as a reference to assess
SC’s credit risk and to set the amount of credit to be extended. It is
calculated from a composite of weighted scores obtained from each of the major
sections of this report. The assessed factors are as follows:
·
Financial
condition covering various ratios
·
Company
background and operations size
·
Promoters
/ Management background
·
Payment
record
·
Litigation
against the subject
·
Industry
scenario / competitor analysis
·
Supplier
/ Customer / Banker review (wherever available)
This report is issued at
your request without any risk and responsibility on the part of MIRA INFORM
PRIVATE LIMITED (MIPL) or its officials.