|
|
|


MIRA INFORM REPORT
|
Report No. : |
487726 |
|
Report Date : |
29.01.2018 |
IDENTIFICATION DETAILS
|
Name : |
MODELO CONTINENTE INTERNATIONAL TRADE SA |
|
|
|
|
Registered Office : |
Avenida Europa (Edif. Alcor Pza. (Pq. Oeste)), 2 - Planta 2 - Alcorcon
- 28922 - Madrid |
|
|
|
|
Country : |
Spain |
|
|
|
|
Financials (as on) : |
31.12.2016 |
|
|
|
|
Date of Incorporation : |
20.12.2007 |
|
|
|
|
Legal Form : |
Public Company |
|
|
|
|
Line of Business : |
Subject is engaged in Whole and retail trade of goods, mainly food
products and beverages, among others. |
|
|
|
|
No. of Employees : |
31 |
RATING & COMMENTS
(Mira Inform has adopted New Rating mechanism w.e.f. 23rd
January 2017)
|
MIRA’s Rating : |
A |
|
Credit Rating |
Explanation |
Rating Comments |
|
A |
Acceptable Risk |
Business dealings permissible with
moderate risk of default |
|
Status : |
Good |
|
|
|
|
Payment Behaviour : |
Slow |
|
|
|
|
Litigation : |
Clear |
NOTES :
Any query related to this report can be made
on e-mail : infodept@mirainform.com
while quoting report number, name and date.
ECGC Country Risk Classification List
|
Country Name |
Previous Rating (30.06.2017) |
Current Rating (30.09.2017) |
|
Spain |
A1 |
A1 |
|
Risk Category |
ECGC
Classification |
|
Insignificant |
A1 |
|
Low Risk |
A2 |
|
Moderately Low Risk |
B1 |
|
Moderate Risk |
B2 |
|
Moderately High Risk |
C1 |
|
High Risk |
C2 |
|
Very High Risk |
D |
SPAIN - ECONOMIC OVERVIEW
After experiencing a prolonged recession in the wake of the global financial crisis that began in 2008, in 2017 Spain marked the fourth full year of positive economic growth in ten years, largely due to increased private consumption. At the onset of the financial crisis, Spain's GDP contracted by 3.7% in 2009, ending a 16-year growth trend, and continued contracting through most of 2013. In that year, the government successfully shored up struggling banks - exposed to the collapse of Spain's depressed real estate and construction sectors - and in January 2014 completed an EU-funded restructuring and recapitalization program for its financial sector.
Until 2014, credit contraction in the private sector, fiscal austerity, and high unemployment weighed on domestic consumption and investment. The unemployment rate rose from a low of about 8% in 2007 to more than 26% in 2013, but labor reforms prompted a modest reduction to 17% in 2017. High unemployment has strained Spain's public finances, as spending on social benefits increased while tax revenues fell. Spain’s budget deficit peaked at 11.4% of GDP in 2010, but Spain gradually reduced the deficit to about 3.3% of GDP in 2017. Public debt has increased substantially – from 60.1% of GDP in 2010 to nearly 96.7% in 2017.
Exports were resilient throughout the economic downturn and helped to bring Spain's current account into surplus in 2013 for the first time since 1986, where it remained through 2016. Rising labor productivity and an internal devaluation resulting from moderating labor costs and lower inflation have helped to improve foreign investor interest in the economy and positive FDI flows have been restored.
Political gridlock after the national elections in December 2015 and June 2016 and ensuing government formation process constrained the caretaker government’s ability to implement needed labor, pension, health care, tax, and education reforms— in 2016. The European Commission criticized Spain’s 2016 budget for easing austerity measures and for its alleged overly optimistic growth and deficit projections. Spain’s borrowing costs are dramatically lower since their peak in mid-2012, and with the recent uptick in economic activity, inflation has reappeared, at 2% per year.
|
Source
: CIA |
EXECUTIVE
SUMMARY
|
|
|
|
|
|
Name: |
MODELO CONTINENTE INTERNATIONAL TRADE SA |
|
NIF / Fiscal code: |
A85305407 |
|
Trade Name |
MODELO CONTINENTE INTERNATIONAL TRADE SA |
|
Status: |
ACTIVE |
|
Incorporation Date: |
20/12/2007 |
|
Register Data |
Register Section 8 Sheet 454357 |
|
Last Publication in BORME: |
15/01/2018 [Reelections] |
|
Last Published Account Deposit: |
2016 |
|
Share Capital: |
80.000 |
|
|
|
|
Localization: |
AVENIDA EUROPA (EDIF. ALCOR PZA. (PQ. OESTE)), 2 -
PLANTA 2 - ALCORCON - 28922 - MADRID |
|
Telephone - Fax - Email - Website: |
Telephone. 918 386 100 |
|
|
|
|
Activity: |
|
|
NACE: |
4711 - Retail sale in non-specialised stores with food,
beverages or tobacco predominating |
|
Registered Trademarks: |
|
|
Audited / Opinion: |
Si / |
|
Tenders and Awards: |
|
|
Subsidies: |
0 for a total cost of 0 |
|
Quality Certificate: |
No |
|
|
|
|
Payment Behaviour: |
Slow |
|
Prospects: |
Consolidation |
|
Industry situation: |
Maturity |
|
|
|
|
Defaults, Legal Claims and Insolvency Proceedings : |
|
|
|
|
|
|
|
Number |
Amount (€) |
Most Recent Entry |
|
Insolvency Proceedings, Bankruptcy and Suspension of
Payments |
|
Unpublished |
--- |
--- |
|
Defaults on debt with Financial Institutions and Large
Companies |
|
1 |
133.647,51 |
--- |
|
Judicial Claims (Notices, Executive Proceedings, Attachments,
Auctions, Bad Debt) |
|
None |
0 |
--- |
|
Proceedings heard by the Civil Court |
|
Unpublished |
0 |
--- |
|
Proceedings heard by the Labour Court |
|
Unpublished |
0 |
--- |
|
|
|
Partners: |
|
|
|
MODELO CONTINENTE HIPERMERCADOS SA SUCURSAL EN ESPAÑA |
100 % |
|
|
Shares: |
0 |
|
|
Other Links: |
11 |
|
|
No. of Active Corporate Bodies: |
|
|
|
Ratios |
2016 |
2015 |
Change |
|
|
Nº of employees: |
31 |
|
|
|
|
|
|
|
Guarantees: |
|
|
Properties Registered: |
Company NO, Administrator NO |
|
Financing / Guarantee Sources : |
Sources NO, Guarantees NO |
|
|
|
|
|
|
|
INVESTIGATION SUMMARY |
|
|
The subject was incorporated in December 2007 with a Shareholder
Equity that amounted to Euro 80,000 Whole and retail trade of goods. |
|
|
Interviewed Person: |
|
|
Enquiry
Details
|
|
Identification |
|
|
Social Denomination: |
MODELO CONTINENTE INTERNATIONAL TRADE SA |
|
Trade Name: |
MODELO CONTINENTE INTERNATIONAL TRADE SA |
|
NIF / Fiscal code: |
A85305407 |
|
Corporate Status: |
ACTIVE |
|
Start of activity: |
20-12-2007 |
|
Registered Office: |
AVENIDA EUROPA (EDIF. ALCOR PZA. (PQ. OESTE)), 2 -
PLANTA 2 |
|
Locality: |
ALCORCON |
|
Province: |
MADRID |
|
Postal Code: |
28922 |
|
Telephone: |
918 386 100 |
|
Interviewed Person: |
Administration (declined) |
Branch
Offices
|
|
|
|
|
Activity
|
|
|
NACE: |
4711 |
|
Corporate Purpose: |
Whole and retail trade of all sorts of goods. |
|
Additional Information: |
Whole and retail trade of goods, mainly food products
and beverages, among others. |
|
Additional Address: |
The Registered Office and offices are located at the
heading address. |
|
Franchise: |
No |
|
Import / export: |
DOES NOT IMPORT / DOES NOT EXPORT |
|
Future Perspective: |
Consolidation |
|
Industry situation: |
Maturity |
Number
of Employees
|
|
|
|
|
|
|
Year |
No. of employees |
Established |
Incidentals |
|
|
|
2016 |
31 |
|
|
|
The
data of employees is from the latest available financial statements in. Failing
that, are estimates data calculated by statistical methods
Chronological
Summary
|
|||
|
|
|
|
|
|
|
Year |
Act |
|
|
|
2008 |
Accounts deposit (year 2007) Appointments/ Re-elections
(4) Cessations/ Resignations/ Reversals (1) Company Formation (1) Declaration
of Sole Propietorship (1) Other Concepts/ Events (1) Statutory Modifications
(1) |
|
|
|
2009 |
Accounts deposit (year 2008) Appointments/ Re-elections
(3) Cessations/ Resignations/ Reversals (1) Change of Social Denomination (2)
Change of Social address (1) |
|
|
|
2010 |
Accounts deposit (year 2009) Appointments/ Re-elections
(4) Cessations/ Resignations/ Reversals (1) |
|
|
|
2011 |
Appointments/ Re-elections (5) Cessations/
Resignations/ Reversals (1) |
|
|
|
2012 |
Accounts deposit (year 2010, 2011) Appointments/
Re-elections (3) |
|
|
|
2013 |
Accounts deposit (year 2012) Appointments/ Re-elections
(4) Cessations/ Resignations/ Reversals (3) |
|
|
|
2014 |
Accounts deposit (year 2013) Appointments/ Re-elections
(3) Cessations/ Resignations/ Reversals (2) |
|
|
|
2015 |
Accounts deposit (year 2014) Appointments/ Re-elections
(3) Cessations/ Resignations/ Reversals (1) Dividends Payment (1) |
|
|
|
2016 |
Accounts deposit (year 2015) Cessations/ Resignations/
Reversals (1) |
|
|
|
2017 |
Accounts deposit (year 2016) Appointments/ Re-elections
(3) Cessations/ Resignations/ Reversals (1) |
|
|
|
2018 |
Appointments/ Re-elections (1) |
|
Breakdown
of Owners' Equity
|
|
|
Registered Capital: |
80.000 |
|
Paid up capital: |
80.000 |
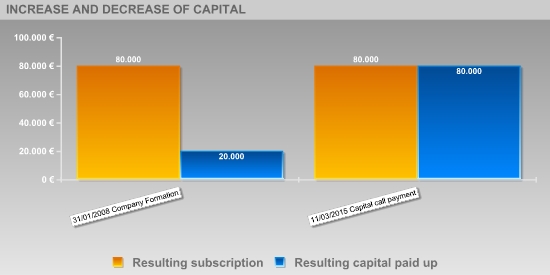
Updated
Evolution of the Subscribed and Paid-in Capital
|
|||||
|
|
|
|
|
|
|
|
|
|||||
|
|
|
|
|
|
|
|
Publishing Date |
Registration Type |
Capital Subscribed |
Paid up capital |
Underwritten result |
Disbursed Result |
|
31/01/2008 |
Company Formation |
80.000 |
20.000 |
80.000 |
20.000 |
|
11/03/2015 |
Capital call payment |
--- |
60.000 |
80.000 |
80.000 |
Founding
Partners
|
|
|
|
|
|
|
Partner Name |
NIF |
% Shareholding stake |
|
|
|
MODELO CONTINENTE HIPERMERCADOS SA SUCURSAL EN ESPAÑA |
W01042631 |
100 |
|
Active
Social Bodies
|
|
|
|
|
|
Post published |
Social Body's Name |
Appointment Date |
Other Positions in this Company |
|
SINGLE PARTNER |
MODELO CONTINENTE HIPERMERCADOS SA SUCURSAL EN ESP |
31/01/2008 |
1 |
|
PRESIDENT |
MESQUITA SOARES MOUTINHO LUIS MIGUEL |
19/03/2014 |
14 |
|
MEMBER OF THE BOARD |
TEIXEIRA SOARES DE ALMEIDA RUI MANUEL |
19/03/2014 |
15 |
|
|
SEQUEIRA DE ALMEIDA DOMINGOS MIGUEL |
19/03/2014 |
12 |
|
|
MESQUITA SOARES MOUTINHO LUIS MIGUEL |
19/03/2014 |
14 |
|
COMBINED CHIEF EXECUTIVE OFFICER |
SEQUEIRA DE ALMEIDA DOMINGOS MIGUEL |
19/03/2014 |
12 |
|
|
MESQUITA SOARES MOUTINHO LUIS MIGUEL |
19/03/2014 |
14 |
|
|
TEIXEIRA SOARES DE ALMEIDA RUI MANUEL |
19/03/2014 |
15 |
|
COMBINED PROXY |
DE MAORTUA Y RUIZ LOPEZ RAFAEL |
12/09/2017 |
1 |
|
|
TEIXEIRA SOARES DE ALMEIDA RUI MANUEL |
12/09/2017 |
15 |
|
|
MESQUITA SOARES MOUTINHO LUIS MIGUEL |
12/09/2017 |
14 |
|
|
SEQUEIRA DE ALMEIDA DOMINGOS MIGUEL |
12/09/2017 |
12 |
|
JOINT ATTORNEY |
LAURENCO ALVEZ INACIO RITA |
03/07/2017 |
1 |
|
|
GONCALVES HESPANHOL ANTONIO MARCOS |
03/07/2017 |
1 |
|
|
MORAIS MAGALHAES RAUL ANTONIO |
02/01/2013 |
1 |
|
|
LOUREIRO DE SOUSA GABRIELA |
02/01/2013 |
1 |
|
JOINT ATTORNEY/COMBINED PROXY |
LUNA MEDINA ALEJANDRA |
12/09/2017 |
1 |
|
PROXY |
GOMEZ OLMOS MARIA DEL PILAR |
07/02/2017 |
1 |
|
|
TOLENTINO DA SILVA MARQUITOS FERREIRA MIGUEL |
19/06/2015 |
1 |
|
|
JUSTINO ANTONIO MANUEL |
26/02/2015 |
1 |
|
|
DIAS MORAIS RIBEIRO DA FONSECA ANA-CRISTINA |
26/02/2015 |
1 |
|
|
VILAS BOAS GARRIDO EDUARDO MANUEL |
18/12/2014 |
1 |
|
|
COSTA GUERREIRO NUNO MIGUEL DOS SANTOS |
18/12/2014 |
1 |
|
|
MOREIRA FERREIRA ANTONIO DAVID |
18/12/2014 |
4 |
|
|
ORTEGA CARVALHO JORGE |
18/12/2014 |
3 |
|
|
DO NASCIMENTO FIGUEIREDO BASTO VITOR EMILIO |
18/12/2014 |
2 |
|
|
OLIVEIRA DE ALMEIDA CORTE REAL JOSE FERNANDO |
18/12/2014 |
9 |
|
|
FERNANDES MARQUES FERREIRA CARLA SUSANA |
18/12/2014 |
5 |
|
|
MARTINS VAZ OSORIO TIAGO FILIPE |
18/12/2014 |
5 |
|
|
DE CARVALHO E SOUSA ANDRE MIGUEL |
18/12/2014 |
6 |
|
|
SANCHEZ GIL ALMUDENA |
18/12/2014 |
8 |
|
|
RODRIGUES MARQUES JONI MARLON |
18/12/2014 |
4 |
|
|
FERREIRA AGUAS CARRICO EDUARDO COWDEL |
10/06/2013 |
1 |
|
|
BARBOSA GUIMARAES GUILHERMINA |
02/01/2013 |
1 |
|
|
MENDES DIAS VILELA PINHEIRO MARIA JOAO |
10/02/2011 |
1 |
|
|
DE JESUS OLIVEIRA EDUARDO JOSE |
17/03/2009 |
2 |
|
|
MONIZ TRIGOSO JORDAO NUNO MANUEL |
17/03/2009 |
7 |
|
|
GUIMARAES RIBEIRO ADRIANO VIRGILIO |
17/03/2009 |
3 |
|
NON CONSELLOR SECRETARY |
MAORTUA RUIZ-LOPEZ RAFAEL |
19/03/2014 |
3 |
|
ACCOUNTS' AUDITOR / HOLDER |
DELOITTE SL |
05/01/2018 |
3 |
Historical
Social Bodies
|
|
|
|
|
|
Social Body's Name |
Post published |
End Date |
Other Positions in this Company |
|
COBOS RODRIGUEZ FRANCISCO JAVIER |
PROXY |
27/07/2011 |
1 |
|
DE CARVALHO E SOUSA ANDRE MIGUEL |
MEMBER OF THE BOARD |
25/05/2010 |
6 |
|
|
COMBINED CHIEF EXECUTIVE OFFICER |
25/05/2010 |
|
|
|
PROXY |
31/07/2013 |
|
|
|
PROXY |
18/12/2014 |
|
|
|
COMBINED PROXY |
18/12/2014 |
|
|
DE JESUS OLIVEIRA EDUARDO JOSE |
COMBINED PROXY |
17/03/2009 |
2 |
|
DELOITTE SL |
ACCOUNTS' AUDITOR / HOLDER |
28/01/2014 |
3 |
|
|
ACCOUNTS' AUDITOR / HOLDER |
05/01/2018 |
|
|
DO NASCIMENTO FIGUEIREDO BASTO VICTOR EMILIO |
COMBINED PROXY |
18/12/2014 |
1 |
|
DO NASCIMENTO FIGUEIREDO BASTO VITOR EMILIO |
PROXY |
18/12/2014 |
2 |
|
DOS SANTOS COSTA GUERREIRO NUNO MIGUEL |
PROXY |
18/12/2014 |
1 |
|
FERNANDES MARQUES FERREIRA CARLA SUSANA |
PROXY |
18/12/2014 |
5 |
|
|
COMBINED PROXY |
18/12/2014 |
|
|
|
PROXY |
06/08/2010 |
|
|
|
PROXY |
31/07/2013 |
|
|
FERREIRA PINTO DA CRUZ MIGUEL |
PROXY |
18/12/2014 |
5 |
|
|
COMBINED PROXY |
18/12/2014 |
|
|
|
PROXY |
06/08/2010 |
|
|
|
COMBINED PROXY |
17/03/2009 |
|
|
|
PROXY |
31/07/2013 |
|
|
GARCIA MORAL CRISTINA |
PROXY |
25/01/2013 |
1 |
|
GUIMARAES RIBEIRO ADRIANO VIRGILIO |
MEMBER OF THE BOARD |
04/05/2009 |
3 |
|
|
COMBINED CHIEF EXECUTIVE OFFICER |
04/05/2009 |
|
|
MAORTUA RUIZ LOPEZ RAFAEL |
SINGLE ADMINISTRATOR |
27/03/2008 |
1 |
|
MAORTUA RUIZ-LOPEZ RAFAEL |
NON CONSELLOR SECRETARY |
19/03/2014 |
3 |
|
|
NON CONSELLOR SECRETARY |
04/05/2009 |
|
|
MARTINEZ LANZAS LAURA |
PROXY |
25/01/2013 |
3 |
|
|
PROXY |
06/03/2013 |
|
|
|
PROXY |
24/07/2017 |
|
|
MARTINS VAZ OSORIO TIAGO FILIPE |
PROXY |
06/08/2010 |
5 |
|
|
COMBINED PROXY |
18/12/2014 |
|
|
|
COMBINED PROXY |
17/03/2009 |
|
|
|
PROXY |
31/07/2013 |
|
|
MARTINS VAZ-OSORIO TIAGO FILIPE |
PROXY |
18/12/2014 |
1 |
|
MESQUITA SOARES MOUTINHO LUIS MIGUEL |
PROXY |
31/07/2013 |
14 |
|
|
PROXY |
23/07/2012 |
|
|
|
COMBINED PROXY |
21/12/2012 |
|
|
|
MEMBER OF THE BOARD |
25/05/2010 |
|
|
|
COMBINED CHIEF EXECUTIVE OFFICER |
25/05/2010 |
|
|
|
MEMBER OF THE BOARD |
19/03/2014 |
|
|
|
COMBINED CHIEF EXECUTIVE OFFICER |
19/03/2014 |
|
|
|
PRESIDENT |
19/03/2014 |
|
|
|
COMBINED PROXY |
18/12/2014 |
|
|
|
PROXY |
18/12/2014 |
|
|
MOLEIRO-ALVES SAMPAIO SOFIA |
PROXY |
31/07/2013 |
2 |
|
|
PROXY |
18/12/2014 |
|
|
MONIZ TRIGOSO JORDAO NUNO MANUEL |
MEMBER OF THE BOARD |
04/05/2009 |
7 |
|
|
MEMBER OF THE BOARD |
25/05/2010 |
|
|
|
COMBINED CHIEF EXECUTIVE OFFICER |
04/05/2009 |
|
|
|
COMBINED CHIEF EXECUTIVE OFFICER |
25/05/2010 |
|
|
|
PRESIDENT |
04/05/2009 |
|
|
|
PRESIDENT |
25/05/2010 |
|
|
MOREIRA DA SILVA ADOSINDA MANUELA |
PROXY |
31/07/2013 |
3 |
|
|
PROXY |
18/12/2014 |
|
|
|
COMBINED PROXY |
18/12/2014 |
|
|
MOREIRA FERREIRA ANTONIO DAVID |
PROXY |
31/07/2013 |
4 |
|
|
PROXY |
18/12/2014 |
|
|
|
COMBINED PROXY |
18/12/2014 |
|
|
OLIVEIRA DE ALMEIDA CORTE REAL JOSE FERNANDO |
MEMBER OF THE BOARD |
04/05/2009 |
9 |
|
|
COMBINED CHIEF EXECUTIVE OFFICER |
04/05/2009 |
|
|
|
PROXY |
31/07/2013 |
|
|
|
COMBINED CHIEF EXECUTIVE OFFICER |
25/05/2010 |
|
|
|
MEMBER OF THE BOARD |
25/05/2010 |
|
|
|
PROXY |
06/08/2010 |
|
|
|
PROXY |
18/12/2014 |
|
|
|
COMBINED PROXY |
18/12/2014 |
|
|
ORTEGA CARBALLO JORGE GABRIEL |
PROXY |
31/07/2013 |
2 |
|
|
COMBINED PROXY |
18/12/2014 |
|
|
ORTEGA CARVALHO JORGE |
PROXY |
30/09/2010 |
3 |
|
|
PROXY |
18/12/2014 |
|
|
PINTO DE ALMEIDA BRITO MARIA EMILIA |
PROXY |
31/07/2013 |
4 |
|
|
PROXY |
18/12/2014 |
|
|
|
COMBINED PROXY |
18/12/2014 |
|
|
|
PROXY |
30/03/2016 |
|
|
RAMOS DE OLIVEIRA ANTONIO MANUEL |
PROXY |
18/12/2014 |
7 |
|
|
JOINT ATTORNEY/COMBINED PROXY |
18/12/2014 |
|
|
|
COMBINED PROXY |
18/12/2014 |
|
|
|
PROXY |
27/11/2015 |
|
|
|
PROXY |
06/08/2010 |
|
|
|
PROXY |
23/07/2012 |
|
|
|
JOINT ATTORNEY/COMBINED PROXY |
31/07/2013 |
|
|
RODRIGUES MARQUES JONI MARLON |
PROXY |
31/07/2013 |
4 |
|
|
PROXY |
18/12/2014 |
|
|
|
COMBINED PROXY |
18/12/2014 |
|
|
SANCHEZ GIL ALMUDENA |
PROXY |
18/07/2008 |
8 |
|
|
PROXY |
17/03/2009 |
|
|
|
COMBINED PROXY |
18/12/2014 |
|
|
|
PROXY |
18/12/2014 |
|
|
|
PROXY |
06/08/2010 |
|
|
|
PROXY |
30/09/2010 |
|
|
|
COMBINED PROXY |
31/07/2013 |
|
|
SEQUEIRA DE ALMEIDA DOMINGOS MIGUEL |
MEMBER OF THE BOARD |
19/03/2014 |
12 |
|
|
COMBINED CHIEF EXECUTIVE OFFICER |
19/03/2014 |
|
|
|
PROXY |
23/07/2012 |
|
|
|
COMBINED PROXY |
21/12/2012 |
|
|
|
PROXY |
31/07/2013 |
|
|
|
MEMBER OF THE BOARD |
25/05/2010 |
|
|
|
COMBINED CHIEF EXECUTIVE OFFICER |
25/05/2010 |
|
|
|
COMBINED PROXY |
18/12/2014 |
|
|
|
PROXY |
18/12/2014 |
|
|
TEIXEIRA SOARES DE ALMEIDA RUI MANUEL |
COMBINED PROXY |
18/12/2014 |
15 |
|
|
PROXY |
18/12/2014 |
|
|
|
COMBINED CHIEF EXECUTIVE OFFICER |
04/05/2009 |
|
|
|
MEMBER OF THE BOARD |
04/05/2009 |
|
|
|
MEMBER OF THE BOARD |
25/05/2010 |
|
|
|
COMBINED CHIEF EXECUTIVE OFFICER |
25/05/2010 |
|
|
|
PROXY |
23/07/2012 |
|
|
|
PROXY |
15/02/2011 |
|
|
|
PROXY |
31/07/2013 |
|
|
|
COMBINED PROXY |
21/12/2012 |
|
|
|
COMBINED CHIEF EXECUTIVE OFFICER |
19/03/2014 |
|
|
|
MEMBER OF THE BOARD |
19/03/2014 |
|
|
VIEIRA DE SA DA MOTA FREITAS LUIS MIGUEL |
MEMBER OF THE BOARD |
04/05/2009 |
12 |
|
|
COMBINED CHIEF EXECUTIVE OFFICER |
04/05/2009 |
|
|
|
COMBINED CHIEF EXECUTIVE OFFICER |
25/05/2010 |
|
|
|
MEMBER OF THE BOARD |
25/05/2010 |
|
|
|
COMBINED PROXY |
18/12/2014 |
|
|
|
PROXY |
18/12/2014 |
|
|
|
MEMBER OF THE BOARD |
19/03/2014 |
|
|
|
COMBINED CHIEF EXECUTIVE OFFICER |
19/03/2014 |
|
|
|
PROXY |
15/02/2011 |
|
|
|
PROXY |
23/07/2012 |
|
|
|
COMBINED PROXY |
21/12/2012 |
|
|
|
PROXY |
31/07/2013 |
|
|
VIEIRA SIMOES PAULO MIGUEL |
PROXY |
31/07/2013 |
3 |
|
|
PROXY |
18/12/2014 |
|
|
|
COMBINED PROXY |
18/12/2014 |
|
|
VILAS-BOAS GARRIDO EDUARDO MANUEL |
JOINT ATTORNEY/COMBINED PROXY |
18/12/2014 |
1 |
Executive
board
|
||
|
|
|
|
|
Post |
NIF |
Name |
|
PESIDENTE / CONSEJERO |
|
LUIS MIGUEL MESQUITA SOARES MOUTHINHO |
|
CONSEJERO |
|
RUI MANUEL TEIXEIRA SOARES ALMEIDA |
|
CONSEJERO |
|
DOMINGOS MIGUEL SEQUEIRA ALMEIDA |
Defaults,
Legal Claims and Insolvency Proceedings
|
|
|
|
|
Section
enabling assessment of the degree of compliance of the company queried with its
payment obligations. It provides information on the existence and nature of all
stages of Insolvency and Legal Proceedings published with reference to the
Company in the country's various Official Bulletins and national newspapers, as
well Defaults Registered in the main national credit bureaus (ASNEF Industrial
and RAI ).
>
Summary
Chronological
summary
|
|
|
Number of Publications |
Amount (€) |
Start date |
End date |
|
Insolvency Proceedings, Bankruptcy and Suspension of
Payments |
|
Unpublished |
--- |
--- |
--- |
|
Request/Declaration |
|
0 |
--- |
date |
|
|
Proceedings |
|
--- |
--- |
|
--- |
|
Resolution |
|
--- |
--- |
|
--- |
|
Defaults on debt with Financial Institutions and Large
Companies |
Bank and Commercial Delinquency |
1 |
0 |
02/07/2015 |
26/01/2018 |
|
Status: Friendly |
|
--- |
|
|
|
|
Status: Pre-Litigation |
|
1 |
133647.51 |
02/07/2015 |
02/07/2015 |
|
Status: Litigation |
|
--- |
|
|
|
|
Status: Non-performing |
|
--- |
|
|
|
|
Status: insolvency proceedings, bankruptcy and
suspension of payments |
|
--- |
|
|
|
|
Other status |
|
--- |
|
|
|
|
Legal and Administrative Proceedings |
|
Unpublished |
--- |
|
|
|
Notices of defaults and enforcement |
|
--- |
--- |
|
--- |
|
Seizures |
|
--- |
--- |
|
--- |
|
Auctions |
|
--- |
--- |
|
--- |
|
Declarations of insolvency and bad debt |
|
--- |
--- |
|
--- |
|
Proceedings heard by the Civil Court |
|
Unpublished |
--- |
|
|
|
Proceedings heard by the Labour Court |
|
Unpublished |
--- |
|
|
>
Details
IMPAGOS
EN ENTIDADES FINANCIERAS Y GRANDES EMPRESAS
Section
comprising a list of the instances of default recorded in the ASNEF Industrial file
under the name of .
|
Note that the Company has a transaction default for an
amount of 133.647,51 euros in amicable or pre-judicial status, since the
creditor entity has not initiated legal action for recovery. |
List
of current instances of default for each of the transactions in progress
|
Type of creditor |
Product |
Value of transactions (€) |
Status |
No. of defaults |
Default balance (€) |
Date of first default |
Date of last default |
|
SOCIEDADES DE SEGUROS CREDITICIOS |
Otros |
133647.51 |
Prejudicial |
--- |
133647.51 |
02/07/15 |
02/07/15 |
|
|
|
133.647,51 |
|
|
|
||
Change
in values of defaults and settled debts
|
Change in values of defaults and settled debts
|
Legal
Notice:
This
data has been obtained from consultation of the ASNEF Industrial register. It
may only be used for the purposes of awarding credit, monitoring credit and managing
loans. This data may not be reused or included in any database, and may not be
ceded .
|
Positive Factors |
Adverse Factors |
|
No judicial claims have been detected in the Official
Gazettes, regarding any Entity's outstanding debts with the Tax Bureau or
Social Security administrations, as submitted by Courts of the various court
jurisdictions. The continuous monitoring of payment behavior in credit
bureaus of MODELO CONTINENTE INTERNATIONAL TRADE SA indicates that it has
recovered stability . At domestic level, it is one of the companies with high
turnover volume. Adequate level of financial autonomy. The financial
autonomy of the entity represents the 31.43%. In principle, an increase in this
ratio would indicate an improvement in the corporate's balace sheets. MODELO CONTINENTE INTERNATIONAL TRADE SA 's borrowing
cost is appropriate according to its volume of external financing sources. |
|
Probability of default
|
|
|
|
|
>
Estimated Probability of Default for the next 12 months: 0.245 %
|
Sector in which comparison is carried out: 471 Retail sale in non-specialised stores |
|
|
Relative Position:
|
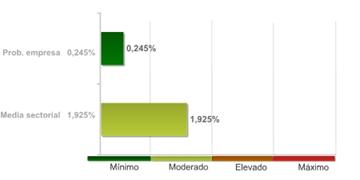
The
company's comparative analysis with the rest of the companies that comprise the
sector, shows the company holds a better position with regard to the
probability of non-compliance.
The
99.00% of the companies of the sector MODELO CONTINENTE INTERNATIONAL TRADE SA
belongs to show a higher probability of non-compliance.
The
probability of the company's non-compliance with its payment obligations within
deadlines estimated by our qualifications models is 0,245%.
In
the event they fail to comply with the payment, the seriousness of the loss
will depend on factors such as the promptness of the commencement of the charging
management, the existence of executive documents which match the credit or the
existence of guarantees and free debt assets under the name of the debtor.
Therefore, the probability of non-compliance should not be solely interpreted
as the total loss of the owed amount.
|
Result of query submitted to the R.A.I. (Spanish Bad
Debt Register) on |
LEGAL CLAIMS
|
|
Summary of Judicial Claims |
|
|
|
|
|
|
|
|
||
|
|
|
Not published |
|
|
|
|
Not published |
|
|
|
|
||
|
|
|
Not published |
|
|
|
|
Not published |
|
|
|
|
Not published |
|
|
|
|
Not published |
|
|
|
|
||
|
|
|
Not published |
|
|
|
|
Not published |
|
|
|
|
||
|
|
|
Not published |
|
|
Guarantees
|
|
References |
|
|
|
|
|
Link
List
|
|
|
|
|
|
IS RELATED WITH: |
11 Entities |
|
SHAREHOLDERS: |
1 Entities |
>
Shareholders
|
Relationship |
Entity |
Province |
Shareholding stake |
|
SHAREHOLDERS |
MODELO CONTINENTE HIPERMERCADOS SA SUCURSAL EN ESPAÑA |
MADRID |
100 |
>
Other relationships
|
Relationship |
Entity |
Province |
Shareholding stake |
|
IS RELATED WITH |
| | |
|
|
|
|
BOM MOMENTO RESTAURAÇAO, S.A. |
|
|
|
|
MODALLOOP VESTUARIO E CALÇADO, S.A. |
|
|
|
|
MODELO DISTRIBUIÇAO DE MATERIALES CONSTRUÇAO, S.A. |
|
|
|
|
SONAE CENTER SERVIÇOS II, S.A. |
|
|
|
|
SONAE SR SERVIÇOES E LOGISTICA, S.A. |
|
|
|
|
ZYPPY COCUK MALZ DAG ITH VE TIC, SOCIEDAD ANONIMA, STI |
|
|
|
|
MDS CORRECTOR DE SEGUROS, S.A. |
|
|
|
|
MODELO COM VENDAS POR CORRESPOND, S.A. |
|
|
|
|
DEPOSITOS ALMACENES NUMERO UNO SA |
SANTA CRUZ DE TENERIFE |
|
|
|
MODELO CONTINENTE HIPERMERCADOS, S.A. |
|
|
|
|
SDSR SPORTS DIVISION SR, SOCIEDAD ANONIMA, SUCURSAL EN
ESPAÑA |
|
|
Turnover
|
|
|
Total Sales 2016 |
560.151.763 |
The
sales data is from the latest available financial statements in. Failing that,
are estimates data calculated by statistical methods.
Estimated
Balance
|
|
High-level company whose Turnover for 2016 increased by
4%. However, the net result for the last couple of years has been going
downward. The Balance Sheet shows a financial status relatively balanced, as
evidenced by the Treasury Ratio (1,571) and the Total Solvency Ratio. |
Financial
Accounts and Balance Sheets
|
|
|
|
|
Financial
Years Presented
|
Ejercicio |
Tipo de Cuentas Anuales |
Fecha Presentacion |
|
2016 |
Normales |
September 2017 |
|
2015 |
Normales |
August 2016 |
|
2014 |
Normales |
October 2015 |
|
2013 |
Normales |
September 2014 |
|
2012 |
Normales |
September 2013 |
|
2011 |
Normales |
October 2012 |
|
2010 |
Normales |
January 2012 |
|
2009 |
Normales |
September 2010 |
|
2008 |
Normales |
December 2009 |
|
2007 |
Normales |
September 2008 |
The
data in the report regarding the last Company Accounts submitted by the company
is taken from the TRADE REGISTER serving the region in which the company's
address is located 31/12/2016
>
Normal format Balance in accordance with the New Accounting Plan 2007
Information
corresponding to the fiscal year
2016 2015 2014 2013 2012 is taken from information
submitted to the TRADE REGISTER. Data corresponding to fiscal years before
2016 2015 2014 2013 2012 has been compiled based on
the equivalence criteria stipulated in Act JUS/206/2009. Where the provisions
of the Act did not establish relevant equivalence criteria, To view details on the methodology.
|
|
ORIGINAL |
ORIGINAL |
ORIGINAL |
ORIGINAL |
ORIGINAL |
|
|
Assets |
2016 |
2015 |
2014 |
2013 |
2012 |
|
|
A) NON-CURRENT ASSETS: 11000 |
94.411,00 |
99.174,00 |
54.092,00 |
256.389,00 |
110.436,00 |
|
|
I. Intangible fixed assets :
11100 |
0,00 |
0,00 |
0,00 |
0,00 |
0,00 |
|
|
1. Development:
11110 |
0,00 |
0,00 |
0,00 |
0,00 |
0,00 |
|
|
2.
Concessions: 11120 |
0,00 |
0,00 |
0,00 |
0,00 |
0,00 |
|
|
3. Patents,
licencing, trade marks and similar: 11130 |
0,00 |
0,00 |
0,00 |
0,00 |
0,00 |
|
|
4. Goodwill:
11140 |
0,00 |
0,00 |
0,00 |
0,00 |
0,00 |
|
|
5. IT
applications: 11150 |
0,00 |
0,00 |
0,00 |
0,00 |
0,00 |
|
|
6.
Investigation: 11160 |
0,00 |
0,00 |
0,00 |
0,00 |
0,00 |
|
|
7.
Intellectual property: 11180 |
0,00 |
0,00 |
0,00 |
0,00 |
0,00 |
|
|
8. Greenhouse
gas emission allowance: 11190 |
0,00 |
0,00 |
0,00 |
0,00 |
0,00 |
|
|
9. Other
intangible fixed assets. : 11170 |
0,00 |
0,00 |
0,00 |
0,00 |
0,00 |
|
|
II. Tangible fixed assets :
11200 |
19.968,00 |
8.894,00 |
11.338,00 |
510,00 |
764,00 |
|
|
1. Land and
buildings: 11210 |
0,00 |
0,00 |
0,00 |
0,00 |
0,00 |
|
|
2. Technical
installations and other tangible fixed assets: 11220 |
19.968,00 |
8.894,00 |
11.338,00 |
510,00 |
764,00 |
|
|
3. Tangible
asset in progress and advances: 11230 |
0,00 |
0,00 |
0,00 |
0,00 |
0,00 |
|
|
III. Real estate investment:
11300 |
0,00 |
0,00 |
0,00 |
0,00 |
0,00 |
|
|
1. Land:
11310 |
0,00 |
0,00 |
0,00 |
0,00 |
0,00 |
|
|
2. Buildings:
11320 |
0,00 |
0,00 |
0,00 |
0,00 |
0,00 |
|
|
IV. Long-term investments in Group
companies and associates : 11400 |
0,00 |
0,00 |
0,00 |
2.063,00 |
0,00 |
|
|
1. Equity
instruments: 11410 |
0,00 |
0,00 |
0,00 |
0,00 |
0,00 |
|
|
2. Credits to
businesses: 11420 |
0,00 |
0,00 |
0,00 |
2.063,00 |
0,00 |
|
|
3. Debt
securities: 11430 |
0,00 |
0,00 |
0,00 |
0,00 |
0,00 |
|
|
4.
Derivatives : 11440 |
0,00 |
0,00 |
0,00 |
0,00 |
0,00 |
|
|
5. Other financial
assets : 11450 |
0,00 |
0,00 |
0,00 |
0,00 |
0,00 |
|
|
6. Other
investments: 11460 |
0,00 |
0,00 |
0,00 |
0,00 |
0,00 |
|
|
V. Long-term financial
investments: 11500 |
14.000,00 |
14.000,00 |
14.000,00 |
1.000,00 |
1.000,00 |
|
|
1. Equity
instruments: 11510 |
0,00 |
0,00 |
0,00 |
0,00 |
0,00 |
|
|
2. Credits to
third parties : 11520 |
0,00 |
0,00 |
0,00 |
0,00 |
0,00 |
|
|
3. Debt
securities: 11530 |
0,00 |
0,00 |
0,00 |
0,00 |
0,00 |
|
|
4.
Derivatives : 11540 |
0,00 |
0,00 |
0,00 |
0,00 |
0,00 |
|
|
5. Other
financial assets : 11550 |
0,00 |
0,00 |
0,00 |
1.000,00 |
0,00 |
|
|
6. Other investments:
11560 |
14.000,00 |
14.000,00 |
14.000,00 |
0,00 |
1.000,00 |
|
|
VII. Non-current trade debts :
11700 |
0,00 |
0,00 |
0,00 |
0,00 |
0,00 |
|
|
VI. Assets for deferred tax :
11600 |
60.443,00 |
76.280,00 |
28.754,00 |
252.816,00 |
108.672,00 |
|
|
B) CURRENT ASSETS: 12000 |
251.074.350,00 |
268.034.308,00 |
307.946.654,00 |
285.587.601,00 |
203.170.514,00 |
|
|
I. Non-current assets held for
sale : 12100 |
0,00 |
0,00 |
0,00 |
0,00 |
0,00 |
|
|
II. Stocks: 12200 |
0,00 |
0,00 |
0,00 |
2.507,00 |
8.607,00 |
|
|
1.
Commercial: 12210 |
0,00 |
0,00 |
0,00 |
0,00 |
0,00 |
|
|
2. Primary
material and other supplies: 12220 |
0,00 |
0,00 |
0,00 |
0,00 |
0,00 |
|
|
a) Long-term primary material and other supplies: 12221 |
0,00 |
0,00 |
0,00 |
0,00 |
0,00 |
|
|
b) Short-term primary material and other supplies: 12222 |
0,00 |
0,00 |
0,00 |
0,00 |
0,00 |
|
|
3. Work in
progress: 12230 |
0,00 |
0,00 |
0,00 |
0,00 |
0,00 |
|
|
a) Of long-term production cycle : 12231 |
0,00 |
0,00 |
0,00 |
0,00 |
0,00 |
|
|
b) Of short-term production cycle : 12232 |
0,00 |
0,00 |
0,00 |
0,00 |
0,00 |
|
|
4. Finished
goods: 12240 |
0,00 |
0,00 |
0,00 |
0,00 |
0,00 |
|
|
a) Of long-term production cycle : 12241 |
0,00 |
0,00 |
0,00 |
0,00 |
0,00 |
|
|
b) Of short-term production cycle : 12242 |
0,00 |
0,00 |
0,00 |
0,00 |
0,00 |
|
|
5.
By-products, residues and recycled materials: 12250 |
0,00 |
0,00 |
0,00 |
0,00 |
0,00 |
|
|
6. Advances to
suppliers: 12260 |
0,00 |
0,00 |
0,00 |
2.507,00 |
8.607,00 |
|
|
III. Trade debtors and others
receivable accounts: 12300 |
113.917.527,00 |
122.340.123,00 |
70.359.364,00 |
114.360.266,00 |
48.705.898,00 |
|
|
1. Trade debtors
/ accounts receivable: 12310 |
1.289,00 |
1.023,00 |
644,00 |
0,00 |
0,00 |
|
|
a) Long-term receivables from sales and services supplied :
12311 |
0,00 |
0,00 |
0,00 |
0,00 |
0,00 |
|
|
b) Customers for sales and provisions of services : 12312 |
1.289,00 |
1.023,00 |
644,00 |
0,00 |
0,00 |
|
|
2. Customers,
Group companies and associates : 12320 |
95.773.073,00 |
103.703.763,00 |
53.779.155,00 |
99.171.268,00 |
39.941.344,00 |
|
|
3. Other
accounts receivable: 12330 |
8.739.168,00 |
8.123.257,00 |
9.120.570,00 |
6.927.911,00 |
3.076.949,00 |
|
|
4. Personnel:
12340 |
2.771,00 |
2.384,00 |
2.229,00 |
2.343,00 |
7,00 |
|
|
5. Assets for
deferred tax: 12350 |
0,00 |
0,00 |
0,00 |
0,00 |
0,00 |
|
|
6. Other
debtors, including tax and social security: 12360 |
9.401.226,00 |
10.509.696,00 |
7.456.766,00 |
8.258.744,00 |
5.687.598,00 |
|
|
7. Called up
share capital: 12370 |
0,00 |
0,00 |
0,00 |
0,00 |
0,00 |
|
|
IV. Short-term investments in
Group companies and associates: 12400 |
134.288.127,00 |
144.542.160,00 |
234.252.334,00 |
171.206.322,00 |
154.306.043,00 |
|
|
1. Equity
instruments: 12410 |
0,00 |
0,00 |
0,00 |
0,00 |
0,00 |
|
|
2. Credits to
businesses: 12420 |
134.288.127,00 |
144.542.160,00 |
234.252.334,00 |
171.206.322,00 |
154.306.043,00 |
|
|
3. Debt
securities: 12430 |
0,00 |
0,00 |
0,00 |
0,00 |
0,00 |
|
|
4.
Derivatives : 12440 |
0,00 |
0,00 |
0,00 |
0,00 |
0,00 |
|
|
5. Other
financial assets : 12450 |
0,00 |
0,00 |
0,00 |
0,00 |
0,00 |
|
|
6. Other
investments: 12460 |
0,00 |
0,00 |
0,00 |
0,00 |
0,00 |
|
|
V. Short-term financial
investments : 12500 |
2.844.922,00 |
1.085.819,00 |
3.268.148,00 |
0,00 |
0,00 |
|
|
1. Equity
instruments: 12510 |
0,00 |
0,00 |
0,00 |
0,00 |
0,00 |
|
|
2. Credits to
businesses: 12520 |
0,00 |
0,00 |
0,00 |
0,00 |
0,00 |
|
|
3. Debt
securities: 12530 |
0,00 |
0,00 |
0,00 |
0,00 |
0,00 |
|
|
4.
Derivatives : 12540 |
2.844.922,00 |
1.085.819,00 |
3.268.148,00 |
0,00 |
0,00 |
|
|
5. Other
financial assets : 12550 |
0,00 |
0,00 |
0,00 |
0,00 |
0,00 |
|
|
6. Other
investments: 12560 |
0,00 |
0,00 |
0,00 |
0,00 |
0,00 |
|
|
VI. Short-term accruals:
12600 |
2.222,00 |
19.748,00 |
2.264,00 |
2.029,00 |
0,00 |
|
|
VII. Cash and other equivalent
liquid assets : 12700 |
21.552,00 |
46.458,00 |
64.544,00 |
16.477,00 |
149.966,00 |
|
|
1. Treasury: 12710 |
21.552,00 |
46.458,00 |
64.544,00 |
0,00 |
149.966,00 |
|
|
2. Other
equivalent liquid assets: 12720 |
0,00 |
0,00 |
0,00 |
16.477,00 |
0,00 |
|
|
TOTAL ASSETS (A + B) : 10000 |
251.168.761,00 |
268.133.482,00 |
308.000.746,00 |
285.843.990,00 |
203.280.950,00 |
|
|
|
ORIGINAL |
ORIGINAL |
ORIGINAL |
ORIGINAL |
ORIGINAL |
|
|
Liabilities and Net Worth |
2016 |
2015 |
2014 |
2013 |
2012 |
|
|
A) NET WORTH: 20000 |
80.387.631,00 |
76.459.166,00 |
83.792.431,00 |
87.502.917,00 |
72.764.800,00 |
|
|
A-1) Shareholders' equity:
21000 |
78.954.037,00 |
76.207.192,00 |
82.459.119,00 |
88.079.437,00 |
73.005.039,00 |
|
|
I. Capital: 21100 |
80.000,00 |
80.000,00 |
80.000,00 |
80.000,00 |
80.000,00 |
|
|
1. Registered
capital : 21110 |
80.000,00 |
80.000,00 |
80.000,00 |
80.000,00 |
80.000,00 |
|
|
2. (Uncalled
capital): 21120 |
0,00 |
0,00 |
0,00 |
0,00 |
0,00 |
|
|
II. Share premium: 21200 |
0,00 |
0,00 |
0,00 |
0,00 |
0,00 |
|
|
III. Reserves: 21300 |
67.127.192,00 |
62.379.119,00 |
52.999.437,00 |
37.365.815,00 |
37.365.815,00 |
|
|
1. Legal and
statutory: 21310 |
1.055.990,00 |
1.055.990,00 |
1.055.990,00 |
1.055.990,00 |
1.055.990,00 |
|
|
2. Other
reserves: 21320 |
66.071.202,00 |
61.323.129,00 |
51.943.447,00 |
36.309.825,00 |
36.309.825,00 |
|
|
3.
Revaluation reserves: 21330 |
0,00 |
0,00 |
0,00 |
0,00 |
0,00 |
|
|
2.
Capitalisation Reserves: 21350 |
0,00 |
0,00 |
0,00 |
0,00 |
0,00 |
|
|
IV. (Common stock equity):
21400 |
0,00 |
0,00 |
0,00 |
0,00 |
0,00 |
|
|
V. Results from previous periods:
21500 |
0,00 |
0,00 |
0,00 |
0,00 |
-1,00 |
|
|
1. Brought
forward: 21510 |
0,00 |
0,00 |
0,00 |
0,00 |
-1,00 |
|
|
2. (Negative
results from previous periods): 21520 |
0,00 |
0,00 |
0,00 |
0,00 |
0,00 |
|
|
VI. Other shareholders'
contributions: 21600 |
0,00 |
0,00 |
0,00 |
0,00 |
0,00 |
|
|
VII. Result of the period:
21700 |
11.746.845,00 |
13.748.073,00 |
29.379.682,00 |
50.633.622,00 |
35.559.225,00 |
|
|
VIII. (Interim dividend):
21800 |
0,00 |
0,00 |
0,00 |
0,00 |
0,00 |
|
|
IX. Other net worth instruments:
21900 |
0,00 |
0,00 |
0,00 |
0,00 |
0,00 |
|
|
A-2) Adjustments due to changes in
value: 22000 |
1.433.594,00 |
251.974,00 |
1.333.312,00 |
-576.520,00 |
-240.239,00 |
|
|
I. Financial assets held for sale:
22100 |
0,00 |
0,00 |
0,00 |
0,00 |
0,00 |
|
|
II. Hedge operations: 22200 |
1.433.594,00 |
251.974,00 |
1.333.312,00 |
-576.520,00 |
-240.239,00 |
|
|
III. Linked non-current assets and
liabilities held for sale : 22300 |
0,00 |
0,00 |
0,00 |
0,00 |
0,00 |
|
|
IV. Exchange rate difference:
22400 |
0,00 |
0,00 |
0,00 |
0,00 |
0,00 |
|
|
V. Other: 22500 |
0,00 |
0,00 |
0,00 |
0,00 |
0,00 |
|
|
A-3) Received subsidies, donations
and legacies: 23000 |
0,00 |
0,00 |
0,00 |
0,00 |
0,00 |
|
|
B) NON-CURRENT LIABILITIES: 31000 |
9.954.300,00 |
5.584.928,00 |
13.183.822,00 |
58.358.741,00 |
5.713,00 |
|
|
I. Long-term provisions:
31100 |
153.371,00 |
97.219,00 |
170.515,00 |
0,00 |
0,00 |
|
|
1. Long-term
employee benefits liability: 31110 |
0,00 |
0,00 |
0,00 |
0,00 |
0,00 |
|
|
2.
Environmental actions: 31120 |
0,00 |
0,00 |
0,00 |
0,00 |
0,00 |
|
|
3.
Restructuring provisions: 31130 |
0,00 |
0,00 |
0,00 |
0,00 |
0,00 |
|
|
4. Other
provisions: 31140 |
153.371,00 |
97.219,00 |
170.515,00 |
0,00 |
0,00 |
|
|
II Long-term creditors:
31200 |
0,00 |
0,00 |
0,00 |
0,00 |
0,00 |
|
|
1.
Liabilities and other securities: 31210 |
0,00 |
0,00 |
0,00 |
0,00 |
0,00 |
|
|
2. Amounts owed
to credit institutions: 31220 |
0,00 |
0,00 |
0,00 |
0,00 |
0,00 |
|
|
3. Creditors
from financial leasing: 31230 |
0,00 |
0,00 |
0,00 |
0,00 |
0,00 |
|
|
4.
Derivatives : 31240 |
0,00 |
0,00 |
0,00 |
0,00 |
0,00 |
|
|
5. Other
financial liabilities : 31250 |
0,00 |
0,00 |
0,00 |
0,00 |
0,00 |
|
|
III. Long-term debts with Group
companies and associates: 31300 |
9.323.065,00 |
5.403.718,00 |
12.568.869,00 |
58.350.822,00 |
0,00 |
|
|
IV. Liabilities for deferred tax:
31400 |
477.864,00 |
83.991,00 |
444.438,00 |
7.919,00 |
5.713,00 |
|
|
V. Long-term accruals: 31500 |
0,00 |
0,00 |
0,00 |
0,00 |
0,00 |
|
|
VI. Non-current trade creditors :
31600 |
0,00 |
0,00 |
0,00 |
0,00 |
0,00 |
|
|
VII. Special long-term debts :
31700 |
0,00 |
0,00 |
0,00 |
0,00 |
0,00 |
|
|
C) CURRENT LIABILITIES : 32000 |
160.826.830,00 |
186.089.388,00 |
211.024.493,00 |
139.982.332,00 |
130.510.437,00 |
|
|
I. Liabilities linked to
non-current assets held for sale: 32100 |
0,00 |
0,00 |
0,00 |
0,00 |
0,00 |
|
|
II. Short-term provisions:
32200 |
0,00 |
0,00 |
0,00 |
0,00 |
0,00 |
|
|
1. Provisions
from greenhouse gas emission allowance: 32210 |
0,00 |
0,00 |
0,00 |
0,00 |
0,00 |
|
|
2. Other
provisions: 32220 |
0,00 |
0,00 |
0,00 |
0,00 |
0,00 |
|
|
III. Short-term creditors :
32300 |
2.950,00 |
171,00 |
4.623,00 |
1.337.844,00 |
853.554,00 |
|
|
1.
Liabilities and other securities: 32310 |
0,00 |
0,00 |
0,00 |
0,00 |
0,00 |
|
|
2. Amounts
owed to credit institutions: 32320 |
2.950,00 |
171,00 |
4.623,00 |
3.888,00 |
0,00 |
|
|
3. Creditors
from financial leasing: 32330 |
0,00 |
0,00 |
0,00 |
0,00 |
0,00 |
|
|
4.
Derivatives : 32340 |
0,00 |
0,00 |
0,00 |
0,00 |
853.554,00 |
|
|
5. Other
financial liabilities : 32350 |
0,00 |
0,00 |
0,00 |
1.333.956,00 |
0,00 |
|
|
IV. Short-term debts with Group
companies and associates: 32400 |
18.106.698,00 |
50.342.959,00 |
68.362.232,00 |
0,00 |
36.591.347,00 |
|
|
V. Trade creditors and other accounts
payable: 32500 |
142.717.182,00 |
135.746.258,00 |
142.657.638,00 |
138.644.488,00 |
93.065.536,00 |
|
|
1. Suppliers:
32510 |
133.574.923,00 |
127.541.827,00 |
129.710.284,00 |
125.644.326,00 |
84.106.025,00 |
|
|
a) Long-term debts : 32511 |
0,00 |
0,00 |
0,00 |
0,00 |
84.106.025,00 |
|
|
b) Short-term debts : 32512 |
133.574.923,00 |
127.541.827,00 |
129.710.284,00 |
125.644.326,00 |
0,00 |
|
|
2. Suppliers,
Group companies and associates: 32520 |
4.848.045,00 |
4.672.950,00 |
9.372.642,00 |
10.248.202,00 |
3.937.017,00 |
|
|
3. Other
creditors: 32530 |
3.315.849,00 |
3.103.744,00 |
3.424.858,00 |
2.687.913,00 |
2.561.187,00 |
|
|
4. Personnel
(remuneration due): 32540 |
606.683,00 |
408.665,00 |
132.272,00 |
57.327,00 |
56.150,00 |
|
|
5.
Liabilities for current tax: 32550 |
0,00 |
0,00 |
0,00 |
0,00 |
0,00 |
|
|
6. Other accounts
payable to Public Administrations.: 32560 |
371.682,00 |
19.072,00 |
17.582,00 |
6.720,00 |
2.405.157,00 |
|
|
7. Advances
from clients: 32570 |
0,00 |
0,00 |
0,00 |
0,00 |
0,00 |
|
|
VI. Short-term accruals:
32600 |
0,00 |
0,00 |
0,00 |
0,00 |
0,00 |
|
|
VII. Special short-term debts :
32700 |
0,00 |
0,00 |
0,00 |
0,00 |
0,00 |
|
|
TOTAL NET WORTH AND LIABILITIES (A + B + C) :
30000 |
251.168.761,00 |
268.133.482,00 |
308.000.746,00 |
285.843.990,00 |
203.280.950,00 |
|
|
|
ORIGINAL |
ORIGINAL |
ORIGINAL |
ORIGINAL |
ORIGINAL |
|
|
Profit and Loss |
2016 |
2015 |
2014 |
2013 |
2012 |
|
|
1. Net turnover: 40100 |
560.151.763,00 |
538.998.280,00 |
584.033.492,00 |
564.375.956,00 |
320.173.692,00 |
|
|
a) Sales: 40110 |
560.118.613,00 |
538.961.560,00 |
584.002.492,00 |
564.290.956,00 |
320.173.692,00 |
|
|
b) Rendering of services:
40120 |
33.150,00 |
36.720,00 |
31.000,00 |
85.000,00 |
0,00 |
|
|
c) Income of financial nature of
holding companies: 40130 |
0,00 |
0,00 |
0,00 |
0,00 |
0,00 |
|
|
2. Changes in stocks of finished goods and work in
progress: 40200 |
0,00 |
0,00 |
0,00 |
0,00 |
0,00 |
|
|
3. Works carried out by the company for its assets:
40300 |
0,00 |
0,00 |
0,00 |
0,00 |
0,00 |
|
|
4. Supplies : 40400 |
-539.724.438,00 |
-517.712.775,00 |
-549.426.264,00 |
-498.053.023,00 |
-273.247.521,00 |
|
|
a) Stock consumption: 40410 |
-539.724.438,00 |
-517.712.775,00 |
-549.426.264,00 |
-498.053.023,00 |
-273.247.521,00 |
|
|
b) Consumption of raw materials
and miscellaneous consumable ones: 40420 |
0,00 |
0,00 |
0,00 |
0,00 |
0,00 |
|
|
c) Works carried out by other
companies: 40430 |
0,00 |
0,00 |
0,00 |
0,00 |
0,00 |
|
|
d) Impairment of stock, primary
material and other supplies: 40440 |
0,00 |
0,00 |
0,00 |
0,00 |
0,00 |
|
|
5. Other operating income: 40500 |
22.723.906,00 |
21.784.386,00 |
21.060.339,00 |
14.444.744,00 |
12.128.586,00 |
|
|
a) Auxiliary income and other from
current management: 40510 |
22.722.182,00 |
21.784.386,00 |
21.060.339,00 |
14.444.744,00 |
12.128.586,00 |
|
|
b) Operation subsidies included in
the Period's result: 40520 |
1.724,00 |
0,00 |
0,00 |
0,00 |
0,00 |
|
|
6. Personnel costs: 40600 |
-2.477.680,00 |
-1.265.474,00 |
-1.053.001,00 |
-297.029,00 |
-306.191,00 |
|
|
a) Wages, salaries et al.:
40610 |
-2.104.054,00 |
-1.167.012,00 |
-983.644,00 |
-250.583,00 |
-250.651,00 |
|
|
b) Social security costs:
40620 |
-373.626,00 |
-98.462,00 |
-69.357,00 |
-46.446,00 |
-55.540,00 |
|
|
c) Provisions : 40630 |
0,00 |
0,00 |
0,00 |
0,00 |
0,00 |
|
|
7. Other operating costs: 40700 |
-25.491.870,00 |
-23.819.649,00 |
-23.543.261,00 |
-17.365.625,00 |
-11.350.502,00 |
|
|
a) External services: 40710 |
-3.939.240,00 |
-2.690.569,00 |
-2.806.420,00 |
-3.792.764,00 |
-143.535,00 |
|
|
b) Taxes: 40720 |
-43.998,00 |
-45.329,00 |
-47.052,00 |
-42.642,00 |
-45.329,00 |
|
|
c) Losses, impairments and variation
in provisions from trade operations : 40730 |
122.556,00 |
-105.036,00 |
-282.854,00 |
14.299,00 |
-255.618,00 |
|
|
d) Other current management
expenditure : 40740 |
-21.631.188,00 |
-20.978.715,00 |
-20.406.935,00 |
-13.544.518,00 |
-10.906.020,00 |
|
|
e) Expenses due to greenhouse gas
emissions: 40750 |
0,00 |
0,00 |
0,00 |
0,00 |
0,00 |
|
|
8. Amortisation of fixed assets: 40800 |
-5.286,00 |
-3.524,00 |
-2.200,00 |
-255,00 |
-255,00 |
|
|
9. Allocation of subsidies of non-financial fixed
assets and other: 40900 |
0,00 |
0,00 |
0,00 |
0,00 |
0,00 |
|
|
10. Excess provisions : 41000 |
0,00 |
0,00 |
0,00 |
0,00 |
0,00 |
|
|
11. Impairment and result of transfers of fixed assets:
41100 |
0,00 |
0,00 |
0,00 |
117.222,00 |
0,00 |
|
|
a) Impairment and losses :
41110 |
0,00 |
0,00 |
0,00 |
0,00 |
0,00 |
|
|
b) Results for transfers and other
: 41120 |
0,00 |
0,00 |
0,00 |
117.222,00 |
0,00 |
|
|
c) Impairment and profit due to
disposals of assets of holding companies: 41130 |
0,00 |
0,00 |
0,00 |
0,00 |
0,00 |
|
|
12. Negative difference in combined businesses:
41200 |
0,00 |
0,00 |
0,00 |
0,00 |
0,00 |
|
|
13. Other results : 41300 |
-45.171,00 |
-2.674,00 |
0,00 |
0,00 |
0,00 |
|
|
A.1) OPERATING INCOME (1 + 2 + 3 + 4 + 5 + 6 + 7 + 8 +
9 + 10 + 11 + 12 + 13) : 49100 |
15.131.224,00 |
17.978.570,00 |
31.069.105,00 |
63.221.990,00 |
47.397.809,00 |
|
|
14. Financial income : 41400 |
1.836.489,00 |
3.446.349,00 |
8.817.319,00 |
7.887.874,00 |
3.627.573,00 |
|
|
a) Of shares in equity instruments
: 41410 |
0,00 |
0,00 |
0,00 |
0,00 |
96.560,00 |
|
|
a 1) In Group
companies and associates: 41411 |
0,00 |
0,00 |
0,00 |
0,00 |
0,00 |
|
|
a 2) In third
parties: 41412 |
0,00 |
0,00 |
0,00 |
0,00 |
96.560,00 |
|
|
b) From negotiable securities and
other financial instruments : 41420 |
1.836.489,00 |
3.446.349,00 |
8.817.319,00 |
7.887.874,00 |
3.531.013,00 |
|
|
b 1) From
Group companies and associates : 41421 |
1.818.045,00 |
3.411.353,00 |
8.783.851,00 |
7.884.344,00 |
3.531.013,00 |
|
|
b 2) From third
parties : 41422 |
18.444,00 |
34.996,00 |
33.468,00 |
3.530,00 |
0,00 |
|
|
c) Allocation of financial
subsidies, donations and legacies : 41430 |
0,00 |
0,00 |
0,00 |
0,00 |
0,00 |
|
|
15. Financial expenditure: 41500 |
-169.887,00 |
-251.317,00 |
-19.894,00 |
-27.497,00 |
-4.108,00 |
|
|
a) Amounts owed to Group companies
and associates : 41510 |
-169.616,00 |
-245.227,00 |
-3.939,00 |
0,00 |
0,00 |
|
|
b) For debts with third parties :
41520 |
-271,00 |
-6.090,00 |
-15.955,00 |
-27.497,00 |
-1.763,00 |
|
|
c) Stock renewal : 41530 |
0,00 |
0,00 |
0,00 |
0,00 |
-2.345,00 |
|
|
16. Changes in fair value of financial instruments :
41600 |
183.610,00 |
-740.545,00 |
2.202.275,00 |
-201.520,00 |
-510.356,00 |
|
|
a) Trading book and other :
41610 |
183.610,00 |
-740.545,00 |
2.202.275,00 |
-201.520,00 |
-510.356,00 |
|
|
b) Allocation of financial assets
held for sale to the result for the period: 41620 |
0,00 |
0,00 |
0,00 |
0,00 |
0,00 |
|
|
17. Exchange rate differences : 41700 |
-1.299.408,00 |
-1.328.792,00 |
-148.985,00 |
1.512.228,00 |
287.975,00 |
|
|
18. Impairment and result for transfers of financial
instruments: 41800 |
0,00 |
0,00 |
0,00 |
0,00 |
0,00 |
|
|
a) Impairment and losses :
41810 |
0,00 |
0,00 |
0,00 |
0,00 |
0,00 |
|
|
b) Results for transfers and other
: 41820 |
0,00 |
0,00 |
0,00 |
0,00 |
0,00 |
|
|
19. Other financial income and expenditure: 42100 |
0,00 |
0,00 |
0,00 |
0,00 |
0,00 |
|
|
a) Incorporation of financial
expenditure to assets: 42110 |
0,00 |
0,00 |
0,00 |
0,00 |
0,00 |
|
|
b) Financial income from arrangement
with creditors: 42120 |
0,00 |
0,00 |
0,00 |
0,00 |
0,00 |
|
|
c) Other income and expenditure:
42130 |
0,00 |
0,00 |
0,00 |
0,00 |
0,00 |
|
|
A.2) FINANCIAL REVENUE (14+15+16+17+18+19) :
49200 |
550.804,00 |
1.125.695,00 |
10.850.715,00 |
9.171.085,00 |
3.401.084,00 |
|
|
A.3) NET RESULT BEFORE TAXES (A.1+A.2) : 49300 |
15.682.028,00 |
19.104.265,00 |
41.919.820,00 |
72.393.075,00 |
50.798.893,00 |
|
|
20. Income taxes: 41900 |
-3.935.183,00 |
-5.356.192,00 |
-12.540.138,00 |
-21.759.453,00 |
-15.239.668,00 |
|
|
A.4) PROFIT AFTER TAXES (A.3+20) : 49400 |
11.746.845,00 |
13.748.073,00 |
29.379.682,00 |
50.633.622,00 |
35.559.225,00 |
|
|
21. Result of the year coming from interrupted operations
: 42000 |
0,00 |
0,00 |
0,00 |
0,00 |
0,00 |
|
|
A.5) RESULT OF THE PERIOD (A.4+21) : 49500 |
11.746.845,00 |
13.748.073,00 |
29.379.682,00 |
50.633.622,00 |
35.559.225,00 |
|
|
CASHFLOW
STATEMENT
|
|
|
|
|
Model:
Normal
>
Source of information: Data contained in this section is taken from the
information declared in the Annual Accounts submitted to the Trade Register.
|
Net Rights Granted |
2016 |
2015 |
2014 |
2013 |
2012 |
|
|
1. Fiscal year result before taxes.: 61100 |
15.682.028,00 |
19.104.265,00 |
41.919.820,00 |
72.393.075,00 |
50.798.893,00 |
|
|
2. Results adjustments.: 61200 |
-668.074,00 |
-1.757.680,00 |
-8.363.386,00 |
-9.386.649,00 |
-3.655.567,00 |
|
|
a) Fixed Assets Amortization (+).:
61201 |
5.286,00 |
3.524,00 |
2.200,00 |
255,00 |
255,00 |
|
|
b) Obsolescence Allowances (+/-).
: 61202 |
-122.556,00 |
105.036,00 |
282.854,00 |
-14.299,00 |
255.618,00 |
|
|
c) Variation in Provision (+/-). :
61203 |
0,00 |
0,00 |
0,00 |
0,00 |
-3.627.573,00 |
|
|
g) Financial income (-).:
61207 |
-1.836.489,00 |
-3.446.349,00 |
-8.817.319,00 |
-7.887.874,00 |
0,00 |
|
|
h) Financial Expenses (+). : 61208 |
169.887,00 |
251.317,00 |
19.894,00 |
27.497,00 |
4.108,00 |
|
|
i) Exchange differences (+/-). :
61209 |
1.299.408,00 |
1.328.792,00 |
148.985,00 |
-1.512.228,00 |
-287.975,00 |
|
|
j) Reasonable Value Variation in Financial
Instruments (+/-).: 61210 |
-183.610,00 |
0,00 |
0,00 |
0,00 |
0,00 |
|
|
3. Changes in current capital equity.: 61300 |
15.195.881,00 |
-57.986.963,00 |
45.211.714,00 |
-18.544.677,00 |
72.437.762,00 |
|
|
a) Stock (+/-).: 61301 |
0,00 |
0,00 |
2.508,00 |
6.100,00 |
-8.592,00 |
|
|
d) Debtors and other accounts
receivable (+/-). : 61302 |
8.545.152,00 |
-51.980.758,00 |
44.000.902,00 |
-64.131.935,00 |
65.230.040,00 |
|
|
c) Other current assets (+/-). :
61303 |
-376.347,00 |
1.083.506,00 |
-3.268.383,00 |
0,00 |
0,00 |
|
|
d) Creditors and other accounts
payable (+/-). : 61304 |
6.970.924,00 |
-7.016.415,00 |
3.730.296,00 |
45.578.952,00 |
7.216.314,00 |
|
|
e) Other current liabilities
(+/-).: 61305 |
56.152,00 |
-73.296,00 |
746.391,00 |
0,00 |
0,00 |
|
|
f) Other non-current assets and
liabilities (+/-).: 61306 |
0,00 |
0,00 |
0,00 |
2.206,00 |
0,00 |
|
|
4. Cash Flows from Other Operating Activities:
61400 |
1.666.602,00 |
3.195.032,00 |
8.797.425,00 |
7.860.377,00 |
3.623.465,00 |
|
|
a) Interest payments (-). :
61401 |
-169.887,00 |
-251.317,00 |
-19.894,00 |
-27.497,00 |
-4.108,00 |
|
|
b) Dividend payment collection
(+). : 61402 |
0,00 |
0,00 |
0,00 |
7.887.874,00 |
3.627.573,00 |
|
|
c) Interest collection (+). :
61403 |
1.836.489,00 |
3.446.349,00 |
8.817.319,00 |
0,00 |
0,00 |
|
|
5. Cash Flows from Operating Activities (1 + 2 + 3 + 4)
: 61500 |
31.876.437,00 |
-37.445.346,00 |
87.565.573,00 |
52.322.126,00 |
123.204.553,00 |
|
|
6. Payments for investment (-).: 62100 |
-16.360,00 |
89.709.093,00 |
-63.072.041,00 |
-16.900.279,00 |
-110.609.843,00 |
|
|
a) Companies of the group and
affiliates. : 62101 |
0,00 |
89.710.173,00 |
-63.046.012,00 |
-16.900.279,00 |
-110.607.824,00 |
|
|
c) Fixed assets. : 62103 |
-16.360,00 |
-1.080,00 |
-13.029,00 |
0,00 |
-1.019,00 |
|
|
e) Other financial assets. :
62105 |
0,00 |
0,00 |
-13.000,00 |
0,00 |
-1.000,00 |
|
|
7. Divestment payment collection (+). : 62200 |
10.254.033,00 |
0,00 |
2.063,00 |
0,00 |
0,00 |
|
|
a) Companies of the group and
affiliates. : 62201 |
10.254.033,00 |
0,00 |
2.063,00 |
0,00 |
0,00 |
|
|
8. Cash Flow from Investing Activities (6+7) less
Amortization: 62300 |
10.237.673,00 |
89.709.093,00 |
-63.069.978,00 |
-16.900.279,00 |
-110.609.843,00 |
|
|
9. Payment collection and payments for equity
instruments. : 63100 |
0,00 |
0,00 |
0,00 |
0,00 |
0,00 |
|
|
10. Payment collection and payments for financial
liabilities instruments.: 63200 |
-31.839.608,00 |
-30.953.041,00 |
-24.298.543,00 |
0,00 |
0,00 |
|
|
a) Issuance : 63201 |
3.922.126,00 |
11.216.562,00 |
21.483.410,00 |
0,00 |
0,00 |
|
|
2. Debts incurred with credit
institutions (+). : 63203 |
2.779,00 |
0,00 |
735,00 |
0,00 |
0,00 |
|
|
3. Debts incurred with companies
of the group and affiliates (+).: 63204 |
3.919.347,00 |
11.216.562,00 |
21.482.675,00 |
0,00 |
0,00 |
|
|
b) Repayment and amortization of :
63207 |
-35.761.734,00 |
-42.169.603,00 |
-45.781.953,00 |
0,00 |
0,00 |
|
|
2. Debts incurred with credit
institutions (-).: 63209 |
0,00 |
-4.452,00 |
0,00 |
0,00 |
0,00 |
|
|
3. Debts incurred with companies
of the group and affiliates (-). : 63210 |
-35.761.734,00 |
-42.165.151,00 |
-45.781.953,00 |
0,00 |
0,00 |
|
|
11. Payments from dividends and remunerations from
other assets instruments. : 63300 |
-9.000.000,00 |
-20.000.000,00 |
0,00 |
-35.555.336,00 |
-12.449.938,00 |
|
|
a) Dividends (-).: 63301 |
-9.000.000,00 |
-20.000.000,00 |
0,00 |
-35.559.224,00 |
-12.449.938,00 |
|
|
b) Remuneration from other assets
instruments (-).: 63302 |
0,00 |
0,00 |
0,00 |
3.888,00 |
0,00 |
|
|
12. Cash Flows from Financing Activities (9+10+11):
63400 |
-40.839.608,00 |
-50.953.041,00 |
-24.298.543,00 |
-35.555.336,00 |
-12.449.938,00 |
|
|
D) EFFECT OF EXCHANGE RATE CHANGES: 64000 |
-1.299.408,00 |
-1.328.792,00 |
-148.985,00 |
0,00 |
0,00 |
|
|
E) NET INCREASE/DECREASE OF CASH OR EQUIVALENT ASSETS
(+/-5+/-8+/12+/-D) : 65000 |
-24.906,00 |
-18.086,00 |
48.067,00 |
-133.489,00 |
144.772,00 |
|
|
Cash or equivalent assets as of
beginning of the fiscal year.: 65100 |
46.458,00 |
64.544,00 |
16.477,00 |
149.966,00 |
5.194,00 |
|
|
Cash or equivalent assets as of
end of the fiscal year.: 65200 |
21.552,00 |
46.458,00 |
64.544,00 |
16.477,00 |
149.966,00 |
|
FINANCIAL
DIAGNOSIS
|
>
Economic-Financial Comparative Analysis
Data
used in the following ratios and indicators is taken from the Annual Accounts
submitted by the company to the TRADE REGISTER.
>
Comparison within the Sector
|
Cash Flow |
2016 |
2015 |
Variación 2016 - 2015 |
|
|||
|
|
Empresa |
Sector |
Empresa |
Sector |
Empresa |
Sector |
|
|
Cash Flow over Sales: |
0,00 % |
0,01 % |
0,00 % |
0,06 % |
|
-83,58 % |
|
|
Net Financial Debt: |
-0,19 |
2,08 |
-0,06 |
2,84 |
-199,64 |
-26,98 |
|
|
Cash Flow Yield: |
0,00 % |
0,01 % |
0,00 % |
0,03 % |
|
-83,07 % |
|
|
EBITDA over Sales: |
2,71 % |
12,08 % |
3,34 % |
10,44 % |
-18,77 % |
15,71 % |
|
|
Profitability |
2016 |
2015 |
Variación 2016 - 2015 |
|
|||
|
|
Empresa |
Sector |
Empresa |
Sector |
Empresa |
Sector |
|
|
Operating economic profitability: |
13,31 % |
8,95 % |
14,68 % |
6,93 % |
-9,33 % |
29,11 % |
|
|
Total economic profitability: |
6,31 % |
5,18 % |
7,22 % |
3,20 % |
-12,57 % |
61,93 % |
|
|
Financial profitability: |
14,88 % |
7,82 % |
18,04 % |
4,16 % |
-17,53 % |
88,10 % |
|
|
Margin: |
2,60 % |
7,84 % |
3,21 % |
6,34 % |
-18,80 % |
23,70 % |
|
|
Mark-up: |
2,70 % |
7,35 % |
3,41 % |
3,78 % |
-20,81 % |
94,36 % |
|
|
Solvency |
2016 |
2015 |
Variación 2016 - 2015 |
|
|||
|
|
Empresa |
Sector |
Empresa |
Sector |
Empresa |
Sector |
|
|
Liquidity: |
0,00 |
0,16 |
0,00 |
0,14 |
|
13,51 |
|
|
Acid Test: |
1,56 |
0,89 |
1,44 |
0,87 |
8,39 |
2,66 |
|
|
Working Capital / Investment: |
0,36 |
0,03 |
0,31 |
0,03 |
17,57 |
0,87 |
|
|
Solvency: |
1,56 |
1,20 |
1,44 |
1,19 |
8,38 |
0,97 |
|
|
Indebtedness |
2016 |
2015 |
Variación 2016 - 2015 |
|
|||
|
|
Empresa |
Sector |
Empresa |
Sector |
Empresa |
Sector |
|
|
Indebtedness level: |
2,16 |
1,21 |
2,51 |
1,31 |
-14,09 |
-7,40 |
|
|
Borrowing Composition: |
0,06 |
1,02 |
0,03 |
1,04 |
106,65 |
-1,72 |
|
|
Repayment Ability: |
11,24 |
8,95 |
10,65 |
11,05 |
5,51 |
-19,01 |
|
|
Warranty: |
1,47 |
1,84 |
1,40 |
1,78 |
5,17 |
3,50 |
|
|
Generated resources / Total creditors: |
0,07 |
0,10 |
0,07 |
0,08 |
-4,05 |
25,47 |
|
|
Efficiency |
2016 |
2015 |
Variación 2016 - 2015 |
|
|||
|
|
Empresa |
Sector |
Empresa |
Sector |
Empresa |
Sector |
|
|
Productivity: |
7,13 |
1,92 |
15,21 |
1,80 |
-53,15 |
6,76 |
|
|
Turnover of Collection Rights : |
5,12 |
5,15 |
4,58 |
5,23 |
11,62 |
-1,42 |
|
|
Turnover of Payment Entitlements: |
3,96 |
3,54 |
3,99 |
3,69 |
-0,72 |
-4,10 |
|
|
Stock rotation: |
|
8,16 |
|
7,79 |
|
4,64 |
|
|
Assets turnover: |
5,11 |
1,14 |
4,58 |
1,09 |
11,66 |
4,37 |
|
|
Borrowing Cost: |
0,10 |
2,35 |
0,13 |
2,45 |
-24,10 |
-4,07 |
|
>
Trend of indicators under the General Accounting Plan of 2007 (2016, 2015,
2014, 2013, 2012)
|
Cash Flow |
2016 |
2015 |
2014 |
2013 |
2012 |
|
|
Cash Flow over Sales: |
0,00 % |
0,00 % |
0,00 % |
0,00 % |
0,00 % |
|
|
Net Financial Debt: |
-0,19 |
-0,06 |
-0,11 |
0,02 |
0,01 |
|
|
Cash Flow Yield: |
0,00 % |
0,00 % |
0,00 % |
0,00 % |
0,00 % |
|
|
EBITDA over Sales: |
2,71 % |
3,34 % |
5,32 % |
11,18 % |
14,80 % |
|
|
Profitability |
2016 |
2015 |
2014 |
2013 |
2012 |
|
|
Operating economic profitability: |
13,31 % |
14,68 % |
44,09 % |
55,15 % |
96,78 % |
|
|
Total economic profitability: |
6,31 % |
7,22 % |
13,62 % |
25,34 % |
24,99 % |
|
|
Financial profitability: |
14,88 % |
18,04 % |
35,63 % |
57,49 % |
48,71 % |
|
|
Margin: |
2,60 % |
3,21 % |
5,13 % |
10,92 % |
14,26 % |
|
|
Mark-up: |
2,70 % |
3,41 % |
6,93 % |
12,51 % |
15,29 % |
|
|
Solvency |
2016 |
2015 |
2014 |
2013 |
2012 |
|
|
Liquidity: |
0,00 |
0,00 |
0,00 |
0,00 |
0,00 |
|
|
Acid Test: |
1,56 |
1,44 |
1,46 |
2,04 |
1,56 |
|
|
Working Capital / Investment: |
0,36 |
0,31 |
0,31 |
0,51 |
0,36 |
|
|
Solvency: |
1,56 |
1,44 |
1,46 |
2,04 |
1,56 |
|
|
Indebtedness |
2016 |
2015 |
2014 |
2013 |
2012 |
|
|
Indebtedness level: |
2,16 |
2,51 |
2,71 |
2,25 |
1,79 |
|
|
Borrowing Composition: |
0,06 |
0,03 |
0,06 |
0,42 |
0,00 |
|
|
Repayment Ability: |
11,24 |
10,65 |
7,21 |
3,14 |
2,75 |
|
|
Warranty: |
1,47 |
1,40 |
1,37 |
1,44 |
1,56 |
|
|
Generated resources / Total creditors: |
0,07 |
0,07 |
0,13 |
0,26 |
0,27 |
|
|
Efficiency |
2016 |
2015 |
2014 |
2013 |
2012 |
|
|
Productivity: |
7,13 |
15,21 |
30,51 |
213,45 |
155,80 |
|
|
Turnover of Collection Rights : |
5,12 |
4,58 |
8,60 |
5,06 |
6,82 |
|
|
Turnover of Payment Entitlements: |
3,96 |
3,99 |
4,02 |
3,72 |
3,06 |
|
|
Stock rotation: |
|
|
|
205.710,38 |
33.101,48 |
|
|
Assets turnover: |
5,11 |
4,58 |
8,59 |
5,05 |
6,79 |
|
|
Borrowing Cost: |
0,10 |
0,13 |
0,01 |
0,01 |
0,00 |
|
COMPARATIVE SECTORIAL BALANCE
|
Sector-based
Comparison under the rules of the New General Accounting Plan.
|
Net Rights Granted |
Variación - |
|
|
|
Empresa |
Sector |
|
Net Rights Granted |
Variación - |
|
|
|
Empresa |
Sector |
|
Net Rights Granted |
Variación - |
|
|
|
Empresa |
Sector |
|
News |
--
Public
Tenders and Works Won
|
No
Public Tenders assigned to the name of the company.
Research
Summary
|
|
The subject was incorporated in December 2007 with a
Shareholder Equity that amounted to Euro 80,000 Whole and retail trade of
goods. |
Answer
to additional question
|
|
The subject is the result of the sale of the old ''''Carrefour''''supermarkets
in Portugal to the company ''''''Seoane'''''', which is a Shareholder of the
subject''''s parent company in Portugal. |
Sources
|
|
Registry of Commerce's Official Gazette. Own and
external data bases Company References |
FOREIGN EXCHANGE RATES
|
Currency |
Unit
|
Indian Rupees |
|
US Dollar |
1 |
INR 63.50 |
|
|
1 |
INR 90.92 |
|
Euro |
1 |
INR 79.07 |
|
EURO |
1 |
INR 78.91 |
Note :
Above are approximate rates obtained from sources believed to be correct
INFORMATION DETAILS
|
Analysis Done by
: |
PRI |
|
|
|
|
Report Prepared
by : |
DNS |
RATING EXPLANATIONS
|
Credit Rating |
Explanation |
Rating Comments |
|
A++ |
Minimum Risk |
Business dealings permissible with minimum
risk of default |
|
A+ |
Low Risk |
Business dealings permissible with low
risk of default |
|
A |
Acceptable Risk |
Business dealings permissible with
moderate risk of default |
|
B |
Medium Risk |
Business dealings permissible on a regular
monitoring basis |
|
C |
Medium High Risk |
Business dealings permissible preferably
on secured basis |
|
D |
High Risk |
Business dealing not recommended or on
secured terms only |
|
NB |
New Business |
No recommendation can be done due to
business in infancy stage |
|
NT |
No Trace |
No recommendation can be done as the
business is not traceable |
NB is stated where there is insufficient information to facilitate rating. However, it is not to be considered as unfavourable.
This score serves as a reference to assess
SC’s credit risk and to set the amount of credit to be extended. It is
calculated from a composite of weighted scores obtained from each of the major
sections of this report. The assessed factors are as follows:
·
Financial
condition covering various ratios
·
Company
background and operations size
·
Promoters
/ Management background
·
Payment
record
·
Litigation
against the subject
·
Industry
scenario / competitor analysis
·
Supplier
/ Customer / Banker review (wherever available)
This report is issued at
your request without any risk and responsibility on the part of MIRA INFORM
PRIVATE LIMITED (MIPL) or its officials.