|
|
|

MIRA INFORM REPORT
|
Report No. : |
488582 |
|
Report Date : |
30.01.2018 |
IDENTIFICATION DETAILS
|
Name : |
ASIAN STAR COMPANY LIMITED |
|
|
|
|
Registered
Office : |
114 – C, Mittal
Court, Nariman Point, Mumbai – 400021, |
|
Tel. No.: |
91-22-22813489/ 61541200 |
|
|
|
|
Country : |
India |
|
|
|
|
Financials (as
on) : |
31.03.2017 |
|
|
|
|
Date of
Incorporation : |
02.03.1995 |
|
|
|
|
Com. Reg. No.: |
11-086017 |
|
|
|
|
Capital Investment
/ Paid-up Capital : |
INR 160.068 Million |
|
|
|
|
CIN No.: [Company Identification
No.] |
L36910MH1995PLC086017 |
|
|
|
|
IEC No.: |
0388003111 |
|
|
|
|
TAN No.: [Tax Deduction &
Collection Account No.] |
Not Available |
|
|
|
|
PAN No.: [Permanent Account No.] |
AAACA4856B |
|
|
|
|
GSTIN/UIN : |
Not Divulged |
|
|
|
|
Legal Form : |
A Public Limited Liability Company. The Company’s Shares are Listed on
the Stock Exchanges. |
|
|
|
|
Line of Business
: |
Subject is primarily engaged in the business of diamond cutting and
polishing, jewellery manufacturing and retailing. The company is also engaged
in generation of electricity through wind power in India. (Registered
Activity) |
|
|
|
|
No. of Employees
: |
1165 (Approximately) |
RATING & COMMENTS
(Mira Inform has adopted New Rating mechanism w.e.f. 23rd
January 2017)
|
MIRA’s Rating : |
A |
|
Credit Rating |
Explanation |
Rating Comments |
|
A |
Acceptable Risk |
Business dealings permissible with moderate
risk of default |
|
Status : |
Good |
|
|
|
|
Payment Behaviour : |
Usually correct |
|
|
|
|
Litigation : |
Clear |
|
|
|
|
Comments : |
Subject was incorporated in the year 1995 and it is engaged in cutting and polishing of less than one carat diamonds. It also manufactures diamonds-studded and platinum jewelry. As per financials of March 2017, the company has registered a growth of 13.65% in its revenue as compared to its previous year’s revenue and has reported average profit margin of 1.65%. Rating takes into consideration the company’s established track record of business operations marked by healthy net worth base along with average debt coverage indicators and good liquidity position. Rating also takes into account the company’s global marketing network along with diversified geographical presence, established relationship with reputed domestic jewelry retailers and assured supply of roughs from world’s leading diamond mining companies. Rating continuous to derive strength from experienced management and its established position in Gems and Jewellery business. Share are quoted high on Stock Exchanges. (Share are traded at a price of INR 1474 against its face value of INR 10.) However, rating strength is partially offset by long working capital cycle being nature of the industry, risk of volatility in prices of rough and polished diamonds and susceptibility to volatile foreign exchange both imparting volatility to profitability and highly competitive nature of the Gems and Jewellery industry. As per financials of September 2017, the company has achieved a revenue of INR 6839.160 million and has reported profit margin of 0.08%. Payments are seems to be usually correct. In view of aforesaid, the company can be considered good for business dealings at usual trade terms and conditions. |
NOTES :
Any query related to this report can be made
on e-mail : infodept@mirainform.com
while quoting report number, name and date.
ECGC Country Risk Classification List
|
Country Name |
Previous Rating (30.06.2017) |
Current Rating (30.09.2017) |
|
India |
A1 |
A1 |
|
Risk Category |
ECGC
Classification |
|
Insignificant |
A1 |
|
Low Risk |
A2 |
|
Moderately Low Risk |
B1 |
|
Moderate Risk |
B2 |
|
Moderately High Risk |
C1 |
|
High Risk |
C2 |
|
Very High Risk |
D |
EXTERNAL AGENCY RATING
|
Rating Agency Name |
CARE |
|
Rating |
Long Term Rating=A- |
|
Rating Explanation |
Adequate degree of safety and low credit risk. |
|
Date |
05.12.2017 |
|
Rating Agency Name |
CARE |
|
Rating |
Short Term Rating=A2+ |
|
Rating Explanation |
Strong degree of safety and low credit risk. |
|
Date |
05.12.2017 |
RBI DEFAULTERS’ LIST STATUS
Subject’s name is not enlisted as a defaulter
in the publicly available RBI Defaulters’ list.
EPF (Employee Provident Fund) DEFAULTERS’ LIST STATUS
Subject’s name is not enlisted as a defaulter
in the publicly available EPF (Employee Provident Fund) Defaulters’ list as of
31-03-2016.
BIFR (Board for Industrial & Financial Reconstruction) LISTING
STATUS
Subject’s name is not listed as a Sick Unit in
the publicly available BIFR (Board for Industrial & Financial
Reconstruction) list as of 30.01.2018
IBBI (Insolvency and Bankruptcy Board of India) LISTING STATUS
Subject’s name is not listed in the publicly
available IBBI (Insolvency and Bankruptcy Board of India) list as of report
date.
INFORMATION DENIED
MANAGEMENT NON-COOPERATIVE (Tel. No.: 91-22-22813489/ 61541200)
(Tel. No.: 91-22-22811371 Number does not exists)
LOCATIONS
|
Registered Office/ Corporate Office : |
114 – C, Mittal
Court, Nariman Point, Mumbai – 400021, Maharashtra, India |
|
Tel. No.: |
91-22-22813489/ 61541200 |
|
Fax No.: |
91-22-22043747/
22842427 / 22043743 |
|
E-Mail : |
|
|
Website : |
|
|
|
|
|
Manufacturing Plant : |
Cut and Polished
Diamonds F.P. no. 138 / 151, Plot no.1, Near Sandesh Paper Press Purushottam Ginning Mill Compound, A K Road, Surat - 395008, Gujarat, India Diamond Studded
Jewellery Plot No.5, F-11/12, WICEL, Opposite SEEPZ, MIDC (Marol), Central Road, Andheri (East), Mumbai – 400093, Maharashtra, India Plot No. 21, New SIDCO Industrial Estate, Srinagar, Hosur - 635109, Tamilnadu, India Wind Energy · Sangli, Maharashtra · Dindugul and Coimbatore · Tamilnadu Palakkad ·
Kerala, India |
|
|
|
|
Sales and Marketing
Office : |
FW 6041-44, Bharat Diamond Bourse, Bandra (East), Mumbai - 400 051, Maharashtra, India |
|
Tel. No.: |
91-22-61541200 |
|
Fax No.: |
91-22-61541234/5 |
|
E-Mail : |
DIRECTORS
As on 31.03.2017
|
Name : |
Mr. Vipul Prabodh Shah |
|
Designation : |
Managing Director |
|
Address : |
Legend 220, Flat No.- 801 A, 8th Floor, Walkeshwar Road, Mumbai – 400006, Maharashtra, India |
|
Date of Appointment : |
07.03.1995 |
|
DIN No.: |
00004746 |
|
|
|
|
Name : |
Mr. Arvind Tarachand
Shah |
|
Designation : |
Whole-time Director |
|
Address : |
32-A, Atlas Apartment, 11 Harkness Road, Mumbai – 400006, Maharashtra, India |
|
Date of Appointment : |
07.03.1995 |
|
DIN No.: |
00004720 |
|
|
|
|
Name : |
Mr. Priyanshu Arvind
Shah |
|
Designation : |
Whole-time Director |
|
Address : |
32-A, Atlas Apartment, 11 Harkness Road, Mumbai – 400006, Maharashtra, India |
|
Date of Appointment : |
01.11.2004 |
|
DIN No.: |
00004759 |
|
|
|
|
Name : |
Mr. Dinesh Tarachand
Shah |
|
Designation : |
Director |
|
Address : |
41, Cliff Apartment, Ridge Road, Mumbai – 400006, Maharashtra, India |
|
Date of Appointment : |
07.03.1995 |
|
PAN No.: |
AAIPS0663F |
|
DIN No.: |
00004685 |
|
|
|
|
Name : |
Mr. Dharmesh Dinesh
Shah |
|
Designation : |
Director |
|
Address : |
41, Cliff Apartment, Ridge Road, Mumbai – 400006, Maharashtra, India |
|
Date of Appointment : |
07.03.1995 |
|
DIN No.: |
00004704 |
|
|
|
|
Name : |
Apurva Rajendra Shah |
|
Designation : |
Director |
|
Address : |
25, Sagar Mahal, 65, Walkeshwar Road, Mumbai – 400006, Maharashtra, India |
|
Date of Appointment : |
24.09.1999 |
|
DIN No.: |
00004781 |
|
|
|
|
Name : |
Kundapur Mohanram Pai |
|
Designation : |
Director |
|
Address : |
904, Salavation Apartment, C.H.S. Limited N. M. Kale Marg, Dadar, Mumbai – 400028, Maharashtra, India |
|
Date of Appointment : |
18.03.1995 |
|
DIN No.: |
00007198 |
|
|
|
|
Name : |
Ms. Neha Rajen Gada |
|
Designation : |
Director |
|
Address : |
A 704, Satguru Sharan II, Sant Ramdas Marg, Mulund (East), Mumbai – 400081, Maharashtra, India |
|
Date of Appointment : |
30.03.2015 |
|
DIN No.: |
01642373 |
|
|
|
|
Name : |
Mr. Milind Hasmukh
Gandhi |
|
Designation : |
Director |
|
Address : |
1001, Crescent Heights, V. N. Naik Marg, Forjett Street, Mumbai – 400036, Maharashtra, India |
|
Date of Appointment : |
16.10.2008 |
|
DIN No.: |
01658439 |
|
|
|
|
Name : |
Mr. Miyar Ramanath
Nayak |
|
Designation : |
Director |
|
Address : |
1106B, Tower I, Brigade Palm Spring, 24th Main Road, Puttenahalli, J.P. Nagar, 7th Phase, Bangalore – 560078, Karnataka, India |
|
Date of Appointment : |
17.01.2014 |
|
DIN No.: |
03352749 |
|
|
|
|
Name : |
Mr. Rahil Vipul Shah |
|
Designation : |
Director |
|
Address : |
Legend 220, Flat No.- 801 A, 8th Floor, Walkeshwar Road, Mumbai – 400006, Maharashtra, India |
|
Date of Appointment : |
17.01.2014 |
|
DIN No.: |
06811700 |
|
|
|
|
Name : |
Mr. Anand Hasmukh
Gandhi |
|
Designation : |
Additional Director |
|
Address : |
Flat No. 27, Jay Mahal, 5th Floor, Plot No.15, A Road, Churchgate, Mumbai – 400020, Maharashtra, India |
|
Date of Appointment : |
10.08.2017 |
|
DIN No.: |
01668879 |
KEY EXECUTIVES
|
Name : |
Mr. Dinesh Tarachand Shah |
|
Designation : |
Chief Financial Officer |
|
Address : |
41, Cliff Apartment, Ridge Road, Mumbai – 400006, Maharashtra, India |
|
Date of Appointment : |
01.04.2014 |
|
PAN No.: |
AAIPS0663F |
|
|
|
|
Name : |
Ms. Aparna Rajaram Shinde |
|
Designation : |
Company Secretary |
|
Address : |
B-307, Shri Nivas Society, Ghodekhot Ali, Agra Road, Kalyan (West), Thane – 421301, Maharashtra, India |
|
Date of Appointment : |
01.04.2014 |
|
PAN No.: |
DASPS9793H |
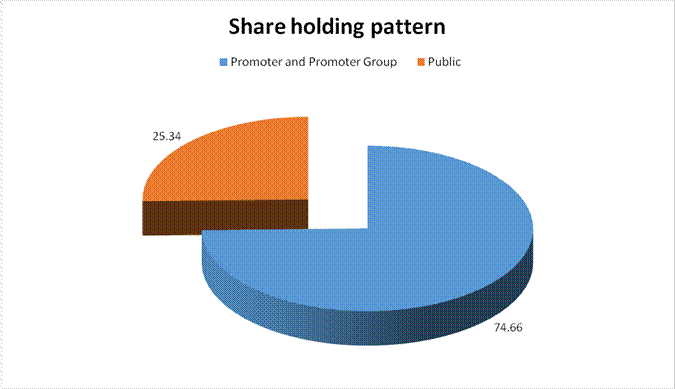
MAJOR SHAREHOLDERS / SHAREHOLDING PATTERN
As on 31.12.2017
|
Category of
shareholder |
No. of fully
paid up equity shares held |
Shareholding as
a % of total no. of shares (calculated as per SCRR, 1957)As a % of |
|
|
(A) Promoter and Promoter
Group |
11950000 |
74.66 |
|
|
(B) Public |
4056800 |
25.34 |
|
|
Grand
Total |
16006800 |
100.00 |
Statement showing shareholding pattern of the Promoter and
Promoter Group
|
Category of
shareholder |
No. of fully
paid up equity shares held |
Shareholding as
a % of total no. of shares (calculated as per SCRR, 1957)As a % of |
|
|
A1) Indian |
0.00 |
||
|
Individuals/Hindu
undivided Family |
10800000 |
67.47 |
|
|
PRIYANSHU ARVIND SHAH |
1215450 |
7.59 |
|
|
VIPUL PRABODH SHAH |
4000050 |
24.99 |
|
|
ARVIND TARACHAND SHAH |
1584450 |
9.90 |
|
|
DINESH TARACHAND SHAH |
1000050 |
6.25 |
|
|
RASILA ARVIND SHAH |
1200000 |
7.50 |
|
|
NIRMALABEN DINESH SHAH |
1800000 |
11.25 |
|
|
Sub Total A1 |
10800000 |
67.47 |
|
|
A2) Foreign |
0.00 |
||
|
Individuals (NonResident
Individuals/ Foreign Individuals) |
1150000 |
7.18 |
|
|
DHARMESH D SHAH |
1150000 |
7.18 |
|
|
Sub Total A2 |
1150000 |
7.18 |
|
|
A=A1+A2 |
11950000 |
74.66 |
Statement showing
shareholding pattern of the Public shareholder
|
Category & Name
of the Shareholders |
No. of fully
paid up equity shares held |
Shareholding %
calculated as per SCRR, 1957 As a % of |
|
|
B1) Institutions |
0 |
0.00 |
|
|
Insurance Companies |
713637 |
4.46 |
|
|
UNITED INDIA INSURANCE
COMPANY LIMITED |
713637 |
4.46 |
|
|
Sub Total B1 |
713637 |
4.46 |
|
|
B2) Central Government/
State Government(s)/ President of India |
0 |
0.00 |
|
|
Central Government/ State
Government(s)/ President of India |
150 |
0.00 |
|
|
Sub Total B2 |
150 |
0.00 |
|
|
B3) Non-Institutions |
0 |
0.00 |
|
|
Individual share capital
upto INR 0.200 Million |
22889 |
0.14 |
|
|
Any Other (specify) |
3320124 |
20.74 |
|
|
Overseas corporate bodies |
655356 |
4.09 |
|
|
LISTON INVESTMENTS
LIMITED |
605850 |
3.78 |
|
|
Bodies Corporate |
2614672 |
16.33 |
|
|
FLORA IMPEX PRIVATE
LIMITED |
784113 |
4.90 |
|
|
NISHANT IMPEX PRIVATE
LIMITED |
768790 |
4.80 |
|
|
RAHIL IMPEX PRIVATE
LIMITED |
692052 |
4.32 |
|
|
SHLOKA TRADERS PRIVATE
LIMITED |
368898 |
2.30 |
|
|
Clearing Members |
51 |
0.00 |
|
|
NRI – Non- Repat |
50021 |
0.31 |
|
|
NRI |
24 |
0.00 |
|
|
Sub Total B3 |
3343013 |
20.88 |
|
|
B=B1+B2+B3 |
4056800 |
25.34 |
BUSINESS DETAILS
|
Line of Business : |
Subject is primarily engaged in the business of diamond cutting and polishing,
jewellery manufacturing and retailing. The company is also engaged in
generation of electricity through wind power in India. (Registered Activity) |
||||
|
|
|
||||
|
Products/ Services : |
|
||||
|
|
|
||||
|
Brand Names : |
Not Available |
||||
|
|
|
||||
|
Agencies Held : |
Not Available |
||||
|
|
|
||||
|
Exports : |
Not Divulged |
||||
|
|
|
||||
|
Imports : |
Not Divulged |
||||
|
|
|
||||
|
Terms : |
Not Divulged |
PRODUCTION STATUS NOT AVAILABLE
GENERAL INFORMATION
|
Suppliers : |
|
|||||||||||||||
|
|
|
|||||||||||||||
|
Customers : |
|
|||||||||||||||
|
|
|
|||||||||||||||
|
No. of Employees : |
1165 (Approximately) |
|||||||||||||||
|
|
|
|||||||||||||||
|
Bankers : |
|
|||||||||||||||
|
|
|
|||||||||||||||
|
Facilities : |
|
|
Auditors : |
|
|
Name : |
V.A. Parikh and Associates LLP Chartered Accountants |
|
Address : |
1405-B Wing, One BKC, 14th Floor G Block, Bandra Kurla Complex, Bandra (East), Mumbai – 400051, Maharashtra, India |
|
Tel. No.: |
91-22-66958854/66955018 |
|
Fax No.: |
91-22-23615110 |
|
Website : |
|
|
|
|
|
Memberships : |
Not Available |
|
|
|
|
Collaborators : |
Not Available |
|
|
|
|
Wholly owned subsidiaries : |
|
|
|
|
|
Particulars of
Enterprises Under Common control of the Key Management Personnel : |
|
|
|
|
|
Other Related Party : |
Arvind T. Shah - HUF |
CAPITAL STRUCTURE
As on 31.03.2017
Authorised Capital :
|
No. of Shares |
Type |
Value |
Amount |
|
|
|
|
|
|
25000000 |
Equity Shares |
INR 10/- each |
INR 250.000 Million |
|
40000000 |
Redeemable Cumulative Preference Shares |
INR 10/- each |
INR 400.000 Million |
|
|
Total |
|
INR 650.000
Million |
Issued, Subscribed & Paid-up Capital :
|
No. of Shares |
Type |
Value |
Amount |
|
|
|
|
|
|
16006800 |
Equity Shares |
INR 10/- each |
INR 160.068 Million |
|
|
|
|
|
THE DETAILS OF
SHAREHOLDERS HOLDING MORE THAN 5% OF THE AGGREGATE SHARES IN THE COMPANY
|
Name of The Shareholders |
As At March
31, 2017 |
|
|
|
No. of Shares
Held |
% of Holding |
|
Vipul Prabodh Shah |
4000050 |
24.99 |
|
Nirmala Dinesh Shah |
1800000 |
11.25 |
|
Arvind Tarachand Shah |
1584450 |
9.90 |
|
Priyanshu Arvind Shah |
1215450 |
7.59 |
|
Rasila Arvind Shah |
1200000 |
7.50 |
|
Dharmesh Dinesh Shah |
1150000 |
7.18 |
|
Dinesh Tarachand Shah |
1000050 |
6.25 |
|
Total |
11950000 |
74.66 |
THE RECONCILIATION OF
THE NUMBER OF SHARES OUTSTANDING IS SET OUT BELOW
|
PARTICULARS |
31.03.2017 |
|
Equity shares at the beginning of the year |
16006800 |
|
Equity shares at the end of the year |
16006800 |
FINANCIAL DATA
[all figures are
in INR Million]
ABRIDGED
BALANCE SHEET (STANDALONE)
|
SOURCES OF FUNDS |
31.03.2017 |
31.03.2016 |
31.03.2015 |
|
I.
EQUITY
AND LIABILITIES |
|
|
|
|
(1)Shareholders' Funds |
|
|
|
|
(a) Share Capital |
160.068 |
160.068 |
160.068 |
|
(b) Reserves & Surplus |
6321.591 |
5919.792 |
4852.969 |
|
(c) Money
received against share warrants |
0.000 |
0.000 |
0.000 |
|
|
|
|
|
|
(2) Share Application money pending
allotment |
0.000 |
0.000 |
0.000 |
|
Total
Shareholders’ Funds (1) + (2) |
6481.659 |
6079.860 |
5013.037 |
|
|
|
|
|
|
(3)
Non-Current Liabilities |
|
|
|
|
(a) Long-term borrowings |
250.000 |
225.386 |
468.080 |
|
(b) Deferred tax liabilities (Net) |
508.205 |
510.355 |
222.381 |
|
(c) Other long term
liabilities |
651.589 |
677.905 |
0.000 |
|
(d) Long-term
provisions |
47.211 |
34.156 |
470.908 |
|
Total Non-current
Liabilities (3) |
1457.005 |
1447.802 |
1161.369 |
|
|
|
|
|
|
(4)
Current Liabilities |
|
|
|
|
(a) Short
term borrowings |
7540.788 |
7980.841 |
7922.627 |
|
(b) Trade
payables |
2777.611 |
1761.633 |
1991.472 |
|
(c) Other
current liabilities |
314.397 |
305.156 |
285.473 |
|
(d) Short-term
provisions |
0.000 |
0.000 |
223.594 |
|
Total Current
Liabilities (4) |
10632.796 |
10047.630 |
10423.166 |
|
|
|
|
|
|
TOTAL |
18571.460 |
17575.292 |
16597.572 |
|
|
|
|
|
|
II.
ASSETS |
|
|
|
|
(1) Non-current
assets |
|
|
|
|
(a) Fixed
Assets |
|
|
|
|
(i)
Tangible assets |
2473.686 |
2513.276 |
1597.859 |
|
(ii)
Intangible Assets |
0.000 |
0.000 |
0.000 |
|
(iii)
Capital work-in-progress |
0.000 |
293.130 |
269.126 |
|
(iv)
Intangible assets under development |
0.000 |
0.000 |
0.000 |
|
(b) Non-current Investments |
56.654 |
55.772 |
34.816 |
|
(c) Deferred tax assets (net) |
0.000 |
0.000 |
0.000 |
|
(d)
Long-term Loan and Advances |
37.042 |
33.395 |
125.176 |
|
(e) Other Non-current
assets |
1167.313 |
750.723 |
463.327 |
|
Total Non-Current
Assets |
3734.695 |
3646.296 |
2490.304 |
|
|
|
|
|
|
(2)
Current assets |
|
|
|
|
(a)
Current investments |
320.790 |
8.895 |
12.948 |
|
(b)
Inventories |
5621.484 |
4048.895 |
5463.415 |
|
(c) Trade
receivables |
6384.277 |
6326.441 |
6829.109 |
|
(d) Cash
and cash equivalents |
1779.798 |
1569.597 |
1455.297 |
|
(e)
Short-term loans and advances |
161.910 |
1704.490 |
346.499 |
|
(f) Other
current assets |
568.506 |
270.678 |
0.000 |
|
Total
Current Assets |
14836.765 |
13928.996 |
14107.268 |
|
|
|
|
|
|
TOTAL |
18571.460 |
17575.292 |
16597.572 |
PROFIT
& LOSS ACCOUNT (STANDALONE)
|
|
PARTICULARS |
31.03.2017 |
31.03.2016 |
31.03.2015 |
|
|
SALES |
|
|
|
|
|
Income |
26965.167 |
23726.179 |
22744.076 |
|
|
Other Income |
81.288 |
17.175 |
1.063 |
|
|
TOTAL |
27046.455 |
23743.354 |
22745.139 |
|
|
|
|
|
|
|
Less |
EXPENSES |
|
|
|
|
|
Cost of Materials
Consumed |
21028.108 |
16234.865 |
18725.736 |
|
|
Purchases of
Stock-in-Trade |
3280.538 |
2978.868 |
2109.577 |
|
|
Changes in inventories of
finished goods, work-in-progress and Stock-in-Trade |
(1175.504) |
1247.248 |
(1868.628) |
|
|
Employees benefits
expense |
512.189 |
395.625 |
359.626 |
|
|
Other expenses |
2325.005 |
1986.594 |
2490.673 |
|
|
Exceptional Items |
4.414 |
8.572 |
-56.898 |
|
|
TOTAL |
25974.750 |
22851.772 |
21760.086 |
|
|
|
|
|
|
|
|
PROFIT/ (LOSS) BEFORE INTEREST, TAX, DEPRECIATION AND AMORTISATION
|
1071.705 |
891.582 |
985.053 |
|
|
|
|
|
|
|
Less |
FINANCIAL EXPENSES |
244.571 |
191.160 |
222.580 |
|
|
|
|
|
|
|
|
PROFIT / (LOSS) BEFORE
TAX, DEPRECIATION AND AMORTISATION |
827.134 |
700.422 |
762.473 |
|
|
|
|
|
|
|
Less/ Add |
DEPRECIATION/
AMORTISATION |
156.862 |
142.163 |
148.240 |
|
|
|
|
|
|
|
|
PROFIT/ (LOSS) BEFORE TAX |
670.272 |
558.259 |
614.233 |
|
|
|
|
|
|
|
Less |
TAX |
225.425 |
156.635 |
182.125 |
|
|
|
|
|
|
|
|
PROFIT/ (LOSS) AFTER TAX
|
444.847 |
401.624 |
432.108 |
|
|
|
|
|
|
|
|
EARNINGS IN FOREIGN
CURRENCY |
|
|
|
|
|
F.O.B. Value of Exports |
17996.100 |
17368.700 |
16293.559 |
|
|
TOTAL EARNINGS |
17996.100 |
17368.700 |
16293.559 |
|
|
|
|
|
|
|
|
IMPORTS |
|
|
|
|
|
Raw Materials |
13945.600 |
84982.100 |
14724.707 |
|
|
TOTAL IMPORTS |
13945.600 |
84982.100 |
14724.707 |
|
|
|
|
|
|
|
|
Earnings / (Loss) Per
Share (INR) |
27.79 |
25.09 |
27.00 |
CURRENT MATURITIES OF LONG TERM DEBT DETAILS
|
Particulars |
31.03.2017 |
31.03.2016 |
31.03.2015 |
|
Current Maturities of Long term debt |
NA |
NA |
NA |
|
Cash generated from operations |
1503.467 |
777.658 |
413.761 |
|
Net cash flow from operating activity |
1290.327 |
579.114 |
223.157 |
QUARTERLY RESULTS
|
Particulars |
30.06.2017 |
30.09.2017 |
|
Unaudited |
1st Quarter |
2nd Quarter |
|
Net Sales |
7399.820 |
6839.160 |
|
Total Expenditure |
7132.480 |
6605.940 |
|
PBIDT (Excl OI) |
267.340 |
233.220 |
|
Other Income |
(0.050) |
33.960 |
|
Operating Profit |
267.290 |
267.180 |
|
Interest |
64.170 |
64.220 |
|
Exceptional Items |
NA |
(181.030) |
|
PBDT |
203.120 |
21.930 |
|
Depreciation |
39.210 |
34.420 |
|
Profit Before Tax |
163.910 |
(12.490) |
|
Tax |
56.470 |
(18.310) |
|
Provisions and contingencies |
NA |
NA |
|
Profit After Tax |
107.440 |
5.810 |
|
Extraordinary Items |
NA |
NA |
|
Prior Period Expenses |
NA |
NA |
|
Other Adjustments |
NA |
NA |
|
Net Profit |
107.440 |
5.810 |
KEY
RATIOS
EFFICIENCY RATIOS
|
PARTICULARS |
31.03.2017 |
31.03.2016 |
31.03.2015 |
|
Average Collection Days (Sundry
Debtors / Income * 365 Days) |
86.42 |
97.33 |
109.59 |
|
|
|
|
|
|
Account Receivables Turnover ( Income / Sundry Debtors) |
4.22 |
3.75 |
3.33 |
|
|
|
|
|
|
Average Payment Days (Sundry Creditors / Purchases * 365 Days) |
41.71 |
33.47 |
34.89 |
|
|
|
|
|
|
Inventory Turnover (Operating Income / Inventories) |
0.19 |
0.22 |
0.18 |
|
|
|
|
|
|
Asset Turnover (Operating Income / Net Fixed Assets) |
0.43 |
0.32 |
0.53 |
LEVERAGE RATIOS
|
PARTICULARS |
31.03.2017 |
31.03.2016 |
31.03.2015 |
|
Debt Ratio ((Borrowing
+ Current Liabilities) / Total Assets) |
0.59 |
0.58 |
0.66 |
|
|
|
|
|
|
Debt Equity Ratio (Total Liability / Networth) |
1.20 |
1.35 |
1.67 |
|
|
|
|
|
|
Current Liabilities to Networth (Current Liabilities / Net Worth) |
1.64 |
1.65 |
2.08 |
|
|
|
|
|
|
Fixed Assets to Networth (Net Fixed Assets / Networth) |
0.38 |
0.46 |
0.37 |
|
|
|
|
|
|
Interest Coverage Ratio (PBIT / Financial Charges) |
4.38 |
4.66 |
4.43 |
PROFITABILITY RATIOS
|
PARTICULARS |
|
31.03.2017 |
31.03.2016 |
31.03.2015 |
|
Net Profit Margin [(PAT / Sales)
* 100] |
% |
1.65 |
1.69 |
1.90 |
|
|
|
|
|
|
|
Return on Total Assets ((PAT / Total Assets) * 100) |
% |
2.40 |
2.29 |
2.60 |
|
|
|
|
|
|
|
Return on Investment (ROI) ((PAT / Networth) * 100) |
% |
6.86 |
6.61 |
8.62 |
SOLVENCY RATIOS
|
PARTICULARS |
31.03.2017 |
31.03.2016 |
31.03.2015 |
|
Current Ratio (Current
Assets / Current Liabilities) |
1.40 |
1.39 |
1.35 |
|
|
|
|
|
|
Quick Ratio ((Current Assets – Inventories) / Current
Liabilities) |
0.87 |
0.98 |
0.83 |
|
|
|
|
|
|
G-Score Ratio Financial (Networth / Total Assets) |
0.35 |
0.35 |
0.30 |
|
|
|
|
|
|
G-Score Ratio Debt (Debts / Equity Capital) |
48.67 |
51.27 |
52.42 |
|
|
|
|
|
|
G-Score Ratio Liquidity (Total Current Assets / Total Current Liabilities) |
1.40 |
1.39 |
1.35 |
Total
Liability = Short-term Debt + Long-term Debt + Current Maturities of Long-term
debts
STOCK
PRICES
|
Face Value |
INR 10.00/- |
|
Market Value |
INR 1474.00/- (BSE) |
FINANCIAL ANALYSIS
[all figures are
in INR Million]
DEBT EQUITY RATIO
|
Particular |
31.03.2015 |
31.03.2016 |
31.03.2017 |
|
|
INR In Million |
INR In Million |
INR In Million |
|
Share Capital |
160.068 |
160.068 |
160.068 |
|
Reserves & Surplus |
4852.969 |
5919.792 |
6321.591 |
|
Money received against
share warrants |
0.000 |
0.000 |
0.000 |
|
Share Application money
pending allotment |
0.000 |
0.000 |
0.000 |
|
Net worth |
5013.037 |
6079.860 |
6481.659 |
|
|
|
|
|
|
long-term borrowings |
468.080 |
225.386 |
250.000 |
|
Short term borrowings |
7922.627 |
7980.841 |
7540.788 |
|
Total borrowings |
8390.707 |
8206.227 |
7790.788 |
|
Debt/Equity ratio |
1.674 |
1.350 |
1.202 |
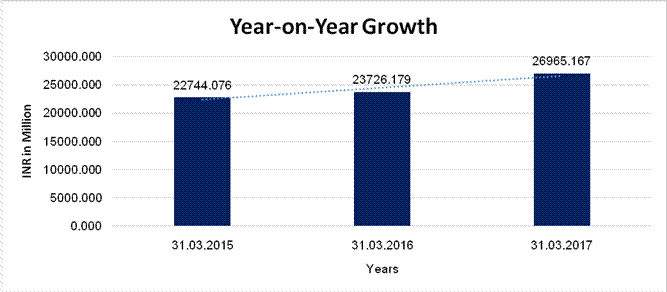
YEAR-ON-YEAR GROWTH
|
Year on Year Growth |
31.03.2015 |
31.03.2016 |
31.03.2017 |
|
|
INR In Million |
INR In Million |
INR In Million |
|
Sales |
22744.076 |
23726.179 |
26965.167 |
|
|
|
4.318 |
13.652 |
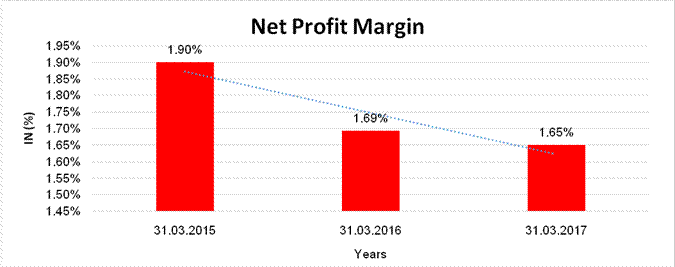
NET PROFIT MARGIN
|
Net Profit Margin |
31.03.2015 |
31.03.2016 |
31.03.2017 |
|
|
INR In Million |
INR In Million |
INR In Million |
|
Sales |
22744.076 |
23726.179 |
26965.167 |
|
Profit/(Loss) |
432.108 |
401.624 |
444.847 |
|
|
1.90% |
1.69% |
1.65% |
ABRIDGED
BALANCE SHEET (CONSOLIDATED)
|
SOURCES OF FUNDS |
|
31.03.2017 |
31.03.2016 |
|
|
|
|
|
|
I.
EQUITY AND LIABILITIES |
|
|
|
|
(1)Shareholders' Funds |
|
|
|
|
(a) Share Capital |
|
160.068 |
160.068 |
|
(b) Reserves &
Surplus |
|
8239.752 |
7670.191 |
|
(c) Money received
against share warrants |
|
0.000 |
0.000 |
|
|
|
|
|
|
(2) Share Application
money pending allotment |
|
0.000 |
0.000 |
|
Total Shareholders’ Funds
(1) + (2) |
|
8399.820 |
7830.259 |
|
|
|
|
|
|
(3) Non-Current
Liabilities |
|
|
|
|
(a) long-term borrowings |
|
250.000 |
225.386 |
|
(b) Deferred tax
liabilities (Net) |
|
508.208 |
510.358 |
|
(c) Other long term
liabilities |
|
641.816 |
671.615 |
|
(d) long-term provisions |
|
91.088 |
61.442 |
|
Total Non-current
Liabilities (3) |
|
1491.112 |
1468.801 |
|
|
|
|
|
|
(4) Current Liabilities |
|
|
|
|
(a) Short term borrowings |
|
9528.200 |
11000.252 |
|
(b) Trade payables |
|
3370.050 |
3077.550 |
|
(c) Other current
liabilities |
|
390.217 |
348.579 |
|
(d) Short-term provisions |
|
0.517 |
0.506 |
|
Total Current Liabilities
(4) |
|
13288.984 |
14426.887 |
|
|
|
|
|
|
TOTAL |
|
23179.916 |
23725.947 |
|
|
|
|
|
|
II.
ASSETS |
|
|
|
|
(1) Non-current assets |
|
|
|
|
(a) Fixed Assets |
|
|
|
|
(i) Tangible assets |
|
2602.309 |
2663.415 |
|
(ii) Intangible Assets |
|
0.293 |
0.000 |
|
(iii) Capital
work-in-progress |
|
0.000 |
293.125 |
|
(iv) Intangible assets
under development |
|
0.000 |
0.000 |
|
(b) Non-current
Investments |
|
0.000 |
0.000 |
|
(c) Deferred tax assets
(net) |
|
0.000 |
0.000 |
|
(d) Long-term Loan and Advances |
|
175.875 |
0.000 |
|
(e) Other Non-current
assets |
|
1185.592 |
786.722 |
|
Total Non-Current Assets |
|
3964.069 |
3743.262 |
|
|
|
|
|
|
(2) Current assets |
|
|
|
|
(a) Current investments |
|
320.790 |
8.895 |
|
(b) Inventories |
|
6301.286 |
4473.811 |
|
(c) Trade receivables |
|
8615.278 |
8663.849 |
|
(d) Cash and cash
equivalents |
|
2950.002 |
4646.672 |
|
(e) Short-term loans and
advances |
|
432.753 |
1902.746 |
|
(f) Other current assets |
|
595.738 |
286.712 |
|
Total Current Assets |
|
19215.847 |
19982.685 |
|
|
|
|
|
|
TOTAL |
|
23179.916 |
23725.947 |
PROFIT
& LOSS ACCOUNT (CONSOLIDATED)
|
|
PARTICULARS |
|
31.03.2017 |
31.03.2016 |
|
|
SALES |
|
|
|
|
|
Income |
|
34938.562 |
33022.020 |
|
|
Other Income |
|
71.717 |
2.209 |
|
|
TOTAL |
|
35010.279 |
33024.229 |
|
|
|
|
|
|
|
Less |
EXPENSES |
|
|
|
|
|
Cost of Materials
Consumed |
|
21592.024 |
16800.992 |
|
|
Purchases of
Stock-in-Trade |
|
10383.204 |
10884.440 |
|
|
Changes in inventories of
finished goods, work-in-progress and Stock-in-Trade |
|
-1444.543 |
1393.475 |
|
|
Employees benefits
expense |
|
654.150 |
519.621 |
|
|
Other expenses |
|
2466.626 |
2121.359 |
|
|
Exceptional Items |
|
4.415 |
8.478 |
|
|
TOTAL |
|
33655.876 |
31728.365 |
|
|
|
|
|
|
|
|
PROFIT/ (LOSS) BEFORE INTEREST, TAX, DEPRECIATION AND
AMORTISATION |
|
1354.403 |
1295.864 |
|
|
|
|
|
|
|
Less |
FINANCIAL EXPENSES |
|
275.850 |
219.968 |
|
|
|
|
|
|
|
|
PROFIT / (LOSS) BEFORE
TAX, DEPRECIATION AND AMORTISATION |
|
1078.553 |
1075.896 |
|
|
|
|
|
|
|
Less/ Add |
DEPRECIATION/
AMORTISATION |
|
178.472 |
163.738 |
|
|
|
|
|
|
|
|
PROFIT/ (LOSS) BEFORE TAX |
|
900.081 |
912.158 |
|
|
|
|
|
|
|
Less |
TAX |
|
238.779 |
168.985 |
|
|
|
|
|
|
|
|
PROFIT/ (LOSS) AFTER TAX
|
|
661.302 |
743.173 |
|
|
|
|
|
|
|
|
OTHER COMPREHENSIVE
INCOME |
|
|
|
|
|
Items that will not be
reclassified to profit or loss |
|
(13.299) |
(39.628) |
|
|
|
|
|
|
|
|
TOTAL OTHER COMPREHENSIVE
INCOME FOR THE PERIOD |
|
648.003 |
703.546 |
|
|
|
|
|
|
|
|
Earnings / (Loss) Per
Share (INR) |
|
41.31 |
46.43 |
LOCAL AGENCY FURTHER INFORMATION
|
Sr. No. |
Check list by
info agents |
Available in
Report (Yes/No) |
|
1 |
Year of establishment |
Yes |
|
2 |
Constitution of the entity -Incorporation
details |
Yes |
|
3 |
Locality of the entity |
Yes |
|
4 |
Premises details |
No |
|
5 |
Buyer visit details |
-- |
|
6 |
Contact numbers |
Yes |
|
7 |
Name of the person contacted |
No |
|
8 |
Designation of contact person |
No |
|
9 |
Promoter’s background |
Yes |
|
10 |
Date of Birth of Proprietor / Partners /
Directors |
No |
|
11 |
Pan Card No. of Proprietor / Partners |
Yes |
|
12 |
Voter Id Card No. of Proprietor / Partners |
No |
|
13 |
Type of business |
Yes |
|
14 |
Line of Business |
Yes |
|
15 |
Export/import details (if applicable) |
No |
|
16 |
No. of employees |
Yes |
|
17 |
Details of sister concerns |
Yes |
|
18 |
Major suppliers |
No |
|
19 |
Major customers |
No |
|
20 |
Banking Details |
Yes |
|
21 |
Banking facility details |
Yes |
|
22 |
Conduct of the banking account |
-- |
|
23 |
Financials, if provided |
Yes |
|
24 |
Capital in the business |
Yes |
|
25 |
Last accounts filed at ROC, if applicable |
Yes |
|
26 |
Turnover of firm for last three years |
Yes |
|
27 |
Reasons for variation <> 20% |
-- |
|
28 |
Estimation for coming financial year |
No |
|
29 |
Profitability for last three years |
Yes |
|
30 |
Major shareholders, if available |
Yes |
|
31 |
External Agency Rating, if available |
Yes |
|
32 |
Litigations that the firm/promoter
involved in |
-- |
|
33 |
Market information |
-- |
|
34 |
Payments terms |
No |
|
35 |
Negative Reporting by Auditors in the Annual
Report |
No |
DIAMOND INDUSTRY – INDIA
-
From time immemorial, India is well known in the world
as the birthplace for diamonds. It is difficult to trace the origin of
diamonds but history says that in the remote past, diamonds were mined only in
India. Diamond production in India can be traced back to almost 8th
Century B.C. India, in fact, remained undisputed leader till 18th
Century when Brazilian fields were discovered in 1725 followed by emergence of
S. Africa, Russia and Australia.
-
The achievement of the Indian diamond industry was
possible only due to combination of the manufacturing skills of the Indian
workforce and the untiring and unflagging efforts of the Indian diamantaires,
supported by progressive Government policies.
-
The area of study of family owned diamond businesses
derives its importance from the huge conglomerate of family run organizations
which operate in the diamond industry since many generations.
-
Some of the basic traits of family run business
enterprises include spirit of entrepreneurship, mutual trust lowers transaction
costs, small, nimble and quick to react, information as a source of advantage
and philanthropy.
-
Family owned diamond businesses need to improve on
many fronts including higher standard of corporate governance, long-term
performance – focused strategies, modern management and technology.
-
Utmost caution is to be exercised while dealing with
some medium and large diamond traders which are usually engaged in fictitious
import – export, inter-company transactions, financially assisted by banks. In
the process, several public sector banks lost several hundred million rupees.
They mostly diverted borrowed money for diamond business into real estate and
capital markets.
-
Excerpts from Times of India dated 30th October
2010 is as under –
-
Gem & Jewellery Export Promotion Council in its
statistical data has shown the export of polished diamonds to have increase by
28 % in February 2013. Compared to $ 1.4 bn worth of polished diamond export in
February, 2012, India exported $ 1.84 billion worth of polished diamonds in
February 2013. A senior executive of GJEPC said, “Export of cut and polished
diamonds started falling month-wise after the imposition of 2 % of import duty
on the polished diamonds. But February, 2013 has given a new ray of hope to the
industry as the export of polished diamonds has actually increased by 28 %. It
means the industry is on the track of recovery and round tripping of
diamonds has stopped completely.” Demand has started coming from the US, the
UK, Japan and China. India’s polished diamond export is expected to cross $ 21
bn in 2013-14.
-
The banking sector has started exercising restraint
while following prudent risk management norms when lending money to gems and
jewellery sector. This follows the implementation of Basel III accord – a
global voluntary regulatory standard on bank capital adequacy, stress testing
and market liquidity.
CORPORATE
INFORMATION
The company is a public limited company domiciled and incorporated in
India. Its shares are listed on the Bombay stock exchange in India. The company
is one of the world’s leading diamantaires primarily engaged in the business of
diamond cutting and polishing, jewellery manufacturing and retailing. The
company is also engaged in generation of electricity through wind power in
India.
PERFORMANCE OF THE
COMPANY
Company reported a top-line growth of 13.65% over the previous year with
sales of INR 26965.200 Million against that of INR 23726.200 Million in
previous year. The company’s profit after tax excluding exceptional items is
INR 449.200 Million that of INR 410.200 Million in previous year, an increase
of 9.50% over the previous year.
OUTLOOK
Global economic activity is picking up with a long awaited cyclical recovery in investment, manufacturing and trade. The growth in likely to be led by strengthening in commodity based countries, an acceleration of activity in India resulting from the implementation of important structural reforms; and a successful rebalancing of China’s economy.
In India Investor’s sentiment is very positive and confidence in the economy has been at unprecedented high level. Government’s commitment to carry out structural reforms will give major fillip to the economy. Prediction of good monsoon, increase in public wages and pensions among others is likely to boost the domestic consumption. With projection of strong economic growth, India is expected to remain one of the fastest growing economy.
Indian Gems and Jewellery industry is set to continue its growth trajectory with tangible signs of revival I demand from major consuming centers led by the US. Having crossed the USD 40 bn mark in exports 2016-17 the government is working on Vision2022, a strategy which will enable India to attain global leadership position in gems and jewelry in its 75th year of Independence. The strategic focus will be on growing exports to the level of USD 60 bn, training and education, employment generation, value addition and sustained marketing.
Outlook for the industry at domestic front is very positive with improved consumer confidence due to economic and political stability. Industry is witnessing structural changes in terms of development in the organized sector and branding. Established brands are guiding the organized market and are opening opportunities to grow. In the coming year, growth in Gems and Jewellery sector would be largely contributed by the development of large retailers/brands
UNSECURED LOAN
|
PARTICULARS |
31.03.2017 (INR
in Million) |
31.03.2016 (INR
in Million) |
|
Long-term
Borrowings |
|
|
|
Loan from Related Party-Directors |
250.000 |
225.386 |
|
Short-term
borrowings |
|
|
|
Loan from related party-Directors |
396.179 |
273.779 |
|
Total |
646.179 |
499.165 |
INDEX
OF CHARGES
|
Charges Registered |
||||||||
|
SNo |
SRN |
Charge Id |
Charge Holder Name |
Date of Creation |
Date of Modification |
Date of Satisfaction |
Amount |
Address |
|
1 |
B58300567 |
80060890 |
Bank of India |
21/07/2005 |
27/08/2012 |
- |
9075000000.0 |
Opera House Branch, Hermes House, Mama Parmanand Marg, Opera House, Mumbai MAHARASHTRA 400004 INDIA |
|
2 |
C52906302 |
80060891 |
Bank of India |
29/03/2005 |
01/12/2014 |
- |
11825000000.0 |
Opera House Branch, Hermes House, Mama Parmanand Marg, Opera House, Mumbai MAHARASHTRA 400004 INDIA |
|
3 |
B80388937 |
80066707 |
Bank of India |
29/01/2003 |
- |
19/07/2013 |
5729200000.0 |
Bullion Exchange Branch Mumbai Mumbai MAHARASHTRA 400002 INDIA |
|
4 |
B80388127 |
80066710 |
Bank of India |
30/07/2004 |
- |
19/07/2013 |
6105000000.0 |
Bullion Exchange Branch185, Sheikh Memon Street Mumbai MAHARASHTRA 400002 INDIA |
|
5 |
B80389265 |
80066709 |
Bank of India |
29/01/2003 |
- |
19/07/2013 |
5729200000.0 |
Bullion Exchange Branch Mumbai Mumbai MAHARASHTRA 400002 INDIA |
|
6 |
B28041796 |
10112943 |
BANK OF INDIA |
14/06/2008 |
- |
25/11/2011 |
104225000.0 |
BULLION EXCHANGE BRANCH 185, SHEIKH MEMON STREET, MUMBAI MAHARASHTRA 400002 INDIA |
|
7 |
B27178227 |
10112566 |
CORPORATION BANK |
14/06/2008 |
- |
15/11/2011 |
284250000.0 |
OVERSEAS BRANCH, 1ST FLOOR,EARNEST HOUSE, NARIMAN POINT MUMBAI MAHARASHTRA 400021 INDIA |
|
8 |
B12632543 |
80062440 |
STATE BANK OF INDORE |
26/03/1999 |
- |
28/04/2011 |
21000000.0 |
INDUSTRIAL FINANCE BRANCH 10, NANABHAI LANE, FORT MUMBAI MAHARASHTRA 400001 INDIA |
|
9 |
B08546756 |
10168644 |
STANDARD CHARTERED BANK |
21/07/2009 |
- |
14/03/2011 |
297000000.0 |
90, M G ROAD FORT MUMBAI MAHARASHTRA 400001 INDIA |
|
10 |
B07278500 |
80062101 |
BANK OF MAHARASHTRA |
20/09/2002 |
- |
26/02/2011 |
100000000.0 |
OVERSEAS BRANCH NARIMAN POINT MUMBAI MAHARASHTRA 400021 INDIA |
STANDALONE
UNAUDITED FINANCIAL RESULTS FOR THE QUARTER ENDED 30.09.2017
(INR in
million)
|
Particulars |
Quarter ended |
Half Year Ended |
|
|
|
30.09.2017 |
30.06.2017 |
30.09.2017 |
|
|
Unaudited |
Unaudited |
Unaudited |
|
INCOME FROM OPERATIONS |
|
|
|
|
Revenue From Operations |
6839.156 |
7399.819 |
14238.975 |
|
Other Income |
33.956 |
(0.047) |
33.909 |
|
Total
Income from Operations |
6873.112 |
7399.772 |
14272.884 |
|
|
|
|
|
|
EXPENSES |
|
|
|
|
Cost of materials consumed |
6694.459 |
5961.078 |
12655.537 |
|
Changes in inventories of finished goods and
work-in-progress |
(1056.654) |
315.119 |
(741.535) |
|
Processing Charges |
683.600 |
542.222 |
1225.822 |
|
Employee benefits expense |
156.051 |
146.932 |
302.983 |
|
Finance Cost |
64.219 |
64.171 |
128.390 |
|
Depreciation and Amortization expenses |
34.421 |
39.214 |
73.635 |
|
Other Expenditure |
128.481 |
167.117 |
295.598 |
|
Total
Expenses |
6704.577 |
7235.853 |
13940.430 |
|
|
|
|
|
|
Profit/(Loss)
from ordinary activities after finance cost but before exceptional items |
168.535 |
163.919 |
332.454 |
|
Exceptional Items |
(181.029) |
0.000 |
(181.029) |
|
Profit
/ (Loss) from ordinary activities before Tax |
(12.494) |
163.919 |
151.425 |
|
Tax Expense |
|
|
|
|
-Current Tax |
54.343 |
62.459 |
116.802 |
|
-Deferred Tax |
(72.650) |
(5.985) |
(78.635) |
|
Net
Profit / (Loss) from ordinary activities after tax after Tax |
5.813 |
107.445 |
113.258 |
|
Extraordinary Item |
-- |
-- |
-- |
|
Net Profit/
Loss for the period |
5.813 |
107.445 |
113.258 |
|
Other
Comprehensive Income |
|
|
|
|
a.i Items that will not be reclassified to profit or loss |
-- |
-- |
-- |
|
a.ii Income tax relating to items that will not be
reclassified to profit or loss |
-- |
-- |
-- |
|
b.i Items that will be reclassified to profit or loss |
-- |
-- |
-- |
|
b.ii Income tax relating to items that be reclassified to
profit or loss |
-- |
-- |
-- |
|
Total
Comprehensive Income |
5.813 |
107.445 |
113.258 |
|
Paid-up Equity Share Capital (Face value INR 10/- per
share) |
160.068 |
160.068 |
160.068 |
|
Reserves (excluding Revaluation Reserve) |
|
|
|
|
Earnings per Share (EPS) - INR |
|
|
|
|
Basic
|
0.36 |
6.71 |
7.08 |
|
Diluted |
0.36 |
6.71 |
7.08 |
SEGMENT –WISE
REVENUE, RESULTS AND CAPITAL EMPLOYED FOR THE QUARTER ENDED 30.09.2017
(INR in
million)
|
Particulars |
(Quarter Ended) |
Half Year Ended |
|
|
|
30.09.2017 (Unaudited) |
30.06.2017 (Unaudited) |
30.09.2017 (Unaudited) |
|
|
|
|
|
Diamonds |
5863.489 |
6898.498 |
12761.987 |
|
Jewellery |
1453.991 |
1030.423 |
2484.414 |
|
Others |
61.819 |
20.025 |
81.844 |
|
Total
|
7379.299 |
7948.946 |
15328.245 |
|
Less : Inter Segment revenue/ transfer |
506.187 |
549.174 |
1055.361 |
|
Net sales/ income from operations |
6873.112 |
7399.772 |
14272.884 |
|
|
|
|
|
|
|
|
|
|
Profit Before tax and Interest from each segment |
|
|
|
|
Diamonds |
155.156 |
192.741 |
347.897 |
|
Jewellery |
30.616 |
29.107 |
59.723 |
|
Others |
46.982 |
6.242 |
53.224 |
|
Total |
232.754 |
228.090 |
460.844 |
|
|
|
|
|
|
Less: Finance Costs |
64.219 |
64.171 |
128.390 |
|
Exceptional Items (Gain)/ Loss |
181.029 |
-- |
181.029 |
|
Other
Un-Allocable Expenditure Net off
Un-Allocable Income |
-- |
-- |
-- |
|
Total
|
245.248 |
64.171 |
309.419 |
|
Total
Profit Before Tax |
(12.494) |
163.919 |
151.425 |
|
|
|
|
|
(Segment Assets-Segment Liabilities) |
|
|
|
|
Diamonds |
4023.252 |
3972.049 |
4023.252 |
|
Jewellery |
1260.168 |
1256.333 |
1260.168 |
|
Others |
1311.475 |
1360.701 |
1311.475 |
|
Total |
6594.895 |
6589.083 |
6594.895 |
STATEMENT OF ASSETS AND LIABILITIES AS ON 30.09.2017
(INR In Million)
|
SOURCES OF FUNDS |
30.09.2017 (Unaudited) |
|
|
|
|
I.
EQUITY AND LIABILITIES |
|
|
(1)Shareholders' Funds |
|
|
(a) Share Capital |
160.068 |
|
(b) Reserves &
Surplus |
6434.827 |
|
(c) Money received
against share warrants |
0.000 |
|
|
|
|
(2) Share Application
money pending allotment |
0.000 |
|
Total Shareholders’ Funds
(1) + (2) |
6594.895 |
|
|
|
|
(3) Non-Current
Liabilities |
|
|
(a) long-term borrowings |
260.808 |
|
(b) Deferred tax
liabilities (Net) |
429.570 |
|
(c) Other long term
liabilities |
810.263 |
|
(d) long-term provisions |
24.212 |
|
Total Non-current Liabilities
(3) |
1524.853 |
|
|
|
|
(4) Current Liabilities |
|
|
(a) Short term borrowings |
7332.849 |
|
(b) Trade payables |
2918.434 |
|
(c) Other current
liabilities |
384.247 |
|
(d) Short-term provisions |
0.000 |
|
Total Current Liabilities
(4) |
10635.530 |
|
|
|
|
TOTAL |
18755.278 |
|
|
|
|
II.
ASSETS |
|
|
(1) Non-current assets |
|
|
(a) Fixed Assets |
|
|
(i) Tangible assets |
1873.690 |
|
(ii) Intangible Assets |
0.000 |
|
(iii) Capital
work-in-progress |
0.000 |
|
(iv) Intangible assets
under development |
0.000 |
|
(b) Non-current
Investments |
46.537 |
|
(c) Deferred tax assets
(net) |
0.000 |
|
(d) Long-term Loan and Advances |
38.746 |
|
(e) Other Non-current
assets |
1380.403 |
|
Total Non-Current Assets |
3339.376 |
|
|
|
|
(2) Current assets |
|
|
(a) Current investments |
351.600 |
|
(b) Inventories |
6066.400 |
|
(c) Trade receivables |
6218.288 |
|
(d) Cash and cash
equivalents |
1890.320 |
|
(e) Short-term loans and
advances |
727.490 |
|
(f) Other current assets |
161.804 |
|
Total Current Assets |
15415.902 |
|
|
|
|
TOTAL |
18755.278 |
Notes:
- The above unaudited financial results were reviewed by the Audit Committee and taken on record at the meeting of the Board of Directors held on November 10, 2017. The results for the quarter ended 30th September, 2017 have also been subjected to limited Review by the Statutory auditors of the Company. The results for the quarter ended 30th September, 2017 have also have been subjected to limited review by the statutory auditors of the company.
- Exceptional items represents profit/ loss on sale of assets
- The figures for the previous periods/year have been regrouped/reclassified to make them comparable with those of current period/year.
- The company recognises two reportable business segment viz., diamonds and jewellery. The business, which is not reportable during the quarter, has been grouped under 'Others' segment, this comprises wind energy generation.
- In view of The Ministry of Corporate Affairs (‘MCA’), Government of India, circular nos. 17/2011 dated April 21, 2011 and 18/2011 dated April 29, 2011, members are hereby requested to write letter addressed to our registered office address.
FIXED ASSETS
- Land
- Office Premises
- Factory Premises
- Plant and Machinery
- Vehicles
- Furniture and Fixtures
- Office Equipments
- Computer
CMT REPORT (Corruption, Money Laundering & Terrorism]
The Public Notice information has been collected from various sources
including but not limited to: The Courts,
1] INFORMATION ON
DESIGNATED PARTY
No exist designating subject or any of its beneficial owners, controlling
shareholders or senior officers as terrorist or terrorist organization or whom
notice had been received that all financial transactions involving their assets
have been blocked or convicted, found guilty or against whom a judgement or
order had been entered in a proceedings for violating money-laundering,
anti-corruption or bribery or international economic or anti-terrorism sanction
laws or whose assets were seized, blocked, frozen or ordered forfeited for
violation of money laundering or international anti-terrorism laws.
2] Court Declaration :
No records exist to suggest that subject is
or was the subject of any formal or informal allegations, prosecutions or other
official proceeding for making any prohibited payments or other improper
payments to government officials for engaging in prohibited transactions or
with designated parties.
3] Asset Declaration :
No records exist to suggest that the property or assets of the subject
are derived from criminal conduct or a prohibited transaction.
4] Record on Financial
Crime :
Charges or conviction
registered against subject: None
5] Records on Violation of
Anti-Corruption Laws :
Charges or
investigation registered against subject: None
6] Records on Int’l
Anti-Money Laundering Laws/Standards :
Charges or
investigation registered against subject: None
7] Criminal Records
No
available information exist that suggest that subject or any of its principals
have been formally charged or convicted by a competent governmental authority
for any financial crime or under any formal investigation by a competent
government authority for any violation of anti-corruption laws or international
anti-money laundering laws or standard.
8] Affiliation with
Government :
No record
exists to suggest that any director or indirect owners, controlling
shareholders, director, officer or employee of the company is a government
official or a family member or close business associate of a Government
official.
9] Compensation Package :
Our market survey
revealed that the amount of compensation sought by the subject is fair and
reasonable and comparable to compensation paid to others for similar services.
10] Press Report :
No press reports / filings exists on
the subject.
CORPORATE GOVERNANCE
MIRA INFORM as part of its Due Diligence do provide comments on
Corporate Governance to identify management and governance. These factors often
have been predictive and in some cases have created vulnerabilities to credit
deterioration.
Our Governance Assessment focuses principally on the interactions
between a company’s management, its Board of Directors, Shareholders and other
financial stakeholders.
CONTRAVENTION
Subject is not known to have contravened any existing local laws,
regulations or policies that prohibit, restrict or otherwise affect the terms
and conditions that could be included in the agreement with the subject.
FOREIGN EXCHANGE RATES
|
Currency |
Unit
|
INR |
|
US Dollar |
1 |
INR 63.54 |
|
|
1 |
INR 89.82 |
|
Euro |
1 |
INR 78.86 |
INFORMATION DETAILS
|
Information
Gathered by : |
AKS |
|
|
|
|
Analysis Done by
: |
VIV |
|
|
|
|
Report Prepared
by : |
SUD |
SCORE FACTORS
|
DEMERIT POINTS |
|
|
|
--BANK CHARGES |
YES/NO |
YES |
|
--LITIGATION |
YES/NO |
NO |
|
--OTHER ADVERSE INFORMATION |
YES/NO |
NO |
|
MERIT POINTS |
|
|
|
--SOLE DISTRIBUTORSHIP |
YES/NO |
NO |
|
--EXPORT ACTIVITIES |
YES/NO |
NO |
|
--AFFILIATION |
YES/NO |
YES |
|
--LISTED |
YES/NO |
YES |
|
--OTHER MERIT FACTORS |
YES/NO |
YES |
RATING EXPLANATIONS
|
Credit Rating |
Explanation |
Rating Comments |
|
A++ |
Minimum Risk |
Business dealings permissible with minimum
risk of default |
|
A+ |
Low Risk |
Business dealings permissible with low
risk of default |
|
A |
Acceptable Risk |
Business dealings permissible with
moderate risk of default |
|
B |
Medium Risk |
Business dealings permissible on a regular
monitoring basis |
|
C |
Medium High Risk |
Business dealings permissible preferably
on secured basis |
|
D |
High Risk |
Business dealing not recommended or on
secured terms only |
|
NB |
New Business |
No recommendation can be done due to
business in infancy stage |
|
NT |
No Trace |
No recommendation can be done as the
business is not traceable |
NB is stated where there is insufficient information to facilitate rating. However, it is not to be considered as unfavourable.
This score serves as a reference to assess
SC’s credit risk and to set the amount of credit to be extended. It is
calculated from a composite of weighted scores obtained from each of the major
sections of this report. The assessed factors are as follows:
·
Financial
condition covering various ratios
·
Company
background and operations size
·
Promoters
/ Management background
·
Payment
record
·
Litigation
against the subject
·
Industry
scenario / competitor analysis
·
Supplier
/ Customer / Banker review (wherever available)
This report is issued at
your request without any risk and responsibility on the part of MIRA INFORM
PRIVATE LIMITED (MIPL) or its officials.