|
|
|


MIRA INFORM REPORT
|
Report No. : |
488728 |
|
Report Date : |
30.01.2018 |
IDENTIFICATION DETAILS
|
Name : |
PNC INFRATECH LIMITED (w.e.f. 02.08.2007) |
|
|
|
|
Formerly Known
As : |
PNC CONSTRUCTION COMPANY LIMITED |
|
|
|
|
Registered
Office : |
NBCC Plaza, Tower II, 4th Floor, Pushp Vihar, Sector 5, New
Delhi – 110017 |
|
Tel. No.: |
91-11-29574800 (10 Lines) |
|
|
|
|
Country : |
India |
|
|
|
|
Financials (as
on) : |
31.03.2017 |
|
|
|
|
Date of
Incorporation : |
09.08.1999 |
|
|
|
|
Com. Reg. No.: |
55-195937 |
|
|
|
|
Capital
Investment / Paid-up Capital : |
INR 513.078 Million |
|
|
|
|
CIN No.: [Company Identification
No.] |
L45201DL1999PLC195937 |
|
|
|
|
IEC No.: |
Not Divulged |
|
|
|
|
GSTIN/UIN : |
09AACCP0377Q1ZU |
|
|
|
|
TAN No.: [Tax Deduction &
Collection Account No.] |
Not Available |
|
|
|
|
PAN No.: [Permanent Account No.] |
AACCP0377Q |
|
|
|
|
Legal Form : |
A Public Limited Liability Company. The Company’s Shares are Listed on
the Stock Exchanges. |
|
|
|
|
Line of Business
: |
The Company is engaged in India’s infrastructure development through the construction of highways including BOT (built, operate and transfer projects), airport runways, bridges, flyovers and power transmission projects. [Registered Activity] |
|
|
|
|
No. of Employees
: |
3748 (Approximately) |
RATING & COMMENTS
(Mira Inform has adopted New Rating mechanism w.e.f. 23rd
January 2017)
|
MIRA’s Rating : |
A |
|
Credit Rating |
Explanation |
Rating Comments |
|
A |
Acceptable Risk |
Business dealings permissible with
moderate risk of default |
|
Maximum credit limit: |
USD |
|
|
|
|
Status : |
Good |
|
|
|
|
Payment Behaviour : |
Regular |
|
|
|
|
Litigation : |
Clear |
|
|
|
|
Comments : |
Subject was incorporated in the year 1999 having fine track record. It is engaged in the business of construction activities such as highways, bridges, flyovers, airport runways, etc. As per the financial record of 2017, the company has reported marginal decline in its revenue as compared to its previous year and has maintained good profit margin. Rating takes into consideration the company’s comfortable capital structure, healthy liquidity position and strong debt protection metrics. Rating continue to derive strength from its long and established track record of its business operation and timely execution of the projects, experience of the promoters in the construction business. Further, the company is listed on BSE at the price quoted at INR 186.40 against its face value of INR 2. Further, as per quarterly results till September 2017, the company has registered steady operating margins but has shown drop in its revenue base. However, these rating strengths gets partially offset by regionally concentrated projects along with inherent cyclical trends associated with the construction sector and high working capital intensive nature of operations. Payments are seems to be regular. In view of aforesaid, the company can be considered for business dealings at usual trade terms and conditions. |
NOTES :
Any query related to this report can be made
on e-mail : infodept@mirainform.com
while quoting report number, name and date.
ECGC Country Risk Classification List
|
Country Name |
Previous Rating (30.06.2017) |
Current Rating (30.09.2017) |
|
India |
A1 |
A1 |
|
Risk Category |
ECGC
Classification |
|
Insignificant |
A1 |
|
Low Risk |
A2 |
|
Moderately Low Risk |
B1 |
|
Moderate Risk |
B2 |
|
Moderately High Risk |
C1 |
|
High Risk |
C2 |
|
Very High Risk |
D |
EXTERNAL AGENCY RATING
|
Rating Agency Name |
CARE |
|
Rating |
Long Term Bank Facilities – AA- |
|
Rating Explanation |
High degree of safety and very low credit risk |
|
Date |
13.02.2017 |
|
Rating Agency Name |
CARE |
|
Rating |
Short Term Bank Facilities – A1+ |
|
Rating Explanation |
Very strong degree of safety and carry lowest credit risk |
|
Date |
13.02.2017 |
RBI DEFAULTERS’ LIST STATUS
Subject’s name is not enlisted as a defaulter
in the publicly available RBI Defaulters’ list.
EPF (Employee Provident Fund) DEFAULTERS’ LIST STATUS
Subject’s name is not enlisted as a defaulter
in the publicly available EPF (Employee Provident Fund) Defaulters’ list as of
31-03-2016.
BIFR (Board for Industrial & Financial Reconstruction) LISTING
STATUS
Subject’s name is not listed as a Sick Unit in
the publicly available BIFR (Board for Industrial & Financial Reconstruction)
list as of 30.01.2018.
IBBI (Insolvency and Bankruptcy Board of India) LISTING STATUS
Subject’s name is not listed in the publicly
available IBBI (Insolvency and Bankruptcy Board of India) list as of report
date.
INFORMATION PARTED BY [GENERAL DETAILS]
|
Name : |
Mr. Pankaj |
|
Designation : |
Accounts Head |
|
Contact No.: |
91-562-4054400 |
|
Date : |
29.01.2018 |
LOCATIONS
|
Registered Office : |
NBCC Plaza, Tower II, 4th Floor, Pushp Vihar, Sector 5, New
Delhi – 110017, India |
|
Tel. No.: |
91-11-29574800/29566511/64724122 |
|
Fax No.: |
91-11-29563844 |
|
E-Mail : |
|
|
Website : |
|
|
|
|
|
Corporate Office/ Head Office : |
PNC Tower, 3/22-D, Civil Lines, Bypass Road, NH-2, Agra – 282002, New
Delhi, India |
|
Tel. No.: |
91-562-4054400 (30 Lines) 91-562-4070000 (30 Lines) |
|
Fax No.: |
91-562-4070011 |
|
E-Mail : |
|
|
|
|
|
Project Address : |
PNC Dausa Lalsot Kautha Project Village, Post Pyariwas, Tehsil –
Nangal, District Dausa, Rajasthan, India |
DIRECTORS
AS ON 31.03.2017
|
Name : |
Mr. Pradeep Kumar Jain |
|
Designation : |
Chairman and Managing Director |
|
Address : |
D-23 Kamla Nagar, Agra – 282005, Uttar Pradesh, India |
|
Date of Appointment : |
09.08.1999 |
|
DIN No.: |
00086653 |
|
|
|
|
Name : |
Mr. Subhash Chander Kalia |
|
Designation : |
Director |
|
Address : |
4507-08, Tower D Ashoka Towers, Opposite Bharat Mata Cinema, Parel Mumbai – 400012, Maharashtra, India |
|
Date of Appointment : |
30.06.2014 |
|
DIN No.: |
00075644 |
|
|
|
|
Name : |
Mr. Chakresh Kumar Jain |
|
Designation : |
Managing Director |
|
Address : |
D-53 Kamla Nagar, Agra – 282005, Uttar Pradesh, India |
|
Date of Appointment : |
09.08.1999 |
|
PAN No : |
AAVPJ6427F |
|
DIN No.: |
00086768 |
|
|
|
|
Name : |
Mr. Yogesh Kumar Jain |
|
Designation : |
Managing Director |
|
Address : |
D-23 Kamla Nagar, Agra – 282005, Uttar Pradesh, India |
|
Date of Appointment : |
09.08.1999 |
|
DIN No.: |
00086811 |
|
|
|
|
Name : |
Mr. Naveen Kumar Jain |
|
Designation : |
Whole-time Director |
|
Address : |
D-53 Kamla Nagar, Agra – 282005, Uttar Pradesh, India |
|
Date of Appointment : |
20.02.2006 |
|
DIN No.: |
00086841 |
|
|
|
|
Name : |
Mr. Chhotu Ram Sharma |
|
Designation : |
Director |
|
Address : |
J-3/18, D L F Phase-II Gurugram – 122002, Haryana, India |
|
Date of Appointment : |
25.10.2007 |
|
DIN No.: |
00522678 |
|
|
|
|
Name : |
Mr. Anil Kumar Rao |
|
Designation : |
Whole-time Director |
|
Address : |
26/190/203 Navjyoti Building, Bye Pass, Agra – 282005, Uttar Pradesh, India |
|
Date of Appointment : |
17.11.2000 |
|
DIN No.: |
01224525 |
|
|
|
|
Name : |
Mr. Ashok Kumar Gupta |
|
Designation : |
Director |
|
Address : |
E-19 Kamla Nagar, Agra – 282005, Uttar Pradesh, India |
|
Date of Appointment : |
20.09.2009 |
|
DIN No.: |
02808356 |
|
|
|
|
Name : |
Mr. Rakesh Kumar Gupta |
|
Designation : |
Director |
|
Address : |
PW-6 Dilkusha Colony, Lucknow – 226001, Uttar Pradesh, India |
|
Date of Appointment : |
20.08.2014 |
|
DIN No.: |
06947037 |
|
|
|
|
Name : |
Ms. Deepika Mittal |
|
Designation : |
Director |
|
Address : |
99, Natrajpuram, Kamla Nagar Dayal Bagh, Agra – 282005, Uttar Pradesh, India |
|
Date of Appointment : |
08.09.2014 |
|
DIN No.: |
06966373 |
KEY EXECUTIVES
|
Name : |
Chakresh Kumar Jain |
|
Designation : |
Chief Financial Officer |
|
Address : |
D-53 Kamla Nagar, Agra – 282005, Uttar Pradesh, India |
|
Date of Appointment : |
11.08.2017 |
|
PAN No.: |
AAVPJ6427F |
|
Name : |
Mr. Tapan Jain |
|
Designation : |
Company Secretary |
|
Address : |
32/31, Kana Patel, Khati Para, Loha Mandi, Agra – 282002, Uttar Pradesh, India |
|
Date of Appointment : |
20.01.2017 |
|
PAN No.: |
ANEPJ9193Q |
SHAREHOLDING PATTERN
AS ON December 2017
|
Category of
shareholder |
No. of fully
paid up equity shares held |
Shareholding as
a % of total no. of shares (calculated as per SCRR, 1957) As a % |
|
|
(A) Promoter &
Promoter Group |
143841000 |
56.07 |
|
|
(B) Public |
112698165 |
43.93 |
|
|
Grand
Total |
256539165 |
100.00 |

STATEMENT SHOWING SHAREHOLDING PATTERN OF THE PROMOTER AND
PROMOTER GROUP
|
Category of
shareholder |
No. of fully
paid up equity shares held |
Shareholding as a
% of total no. of shares (calculated as per SCRR, 1957) As a % |
|
|
A1) Indian |
|
||
|
Individuals/Hindu
undivided Family |
119076000 |
46.42 |
|
|
Navin Kumar Jain |
18096000 |
7.05 |
|
|
Madhavi Jain |
17998500 |
7.02 |
|
|
Yogesh Kumar Jain |
16794000 |
6.55 |
|
|
Pradeep Kumar Jain |
15349500 |
5.98 |
|
|
Renu Jain |
11671500 |
4.55 |
|
|
Chakresh Kumar Jain HUF |
9256500 |
3.61 |
|
|
Ashita Jain |
7873500 |
3.07 |
|
|
Meena Jain |
7426500 |
2.89 |
|
|
Pradeep Kumar Jain HUF |
5250000 |
2.05 |
|
|
Yogesh Kumar Jain HUF |
5101500 |
1.99 |
|
|
Chakresh Kumar Jain |
2514000 |
0.98 |
|
|
Abhinandan Jain |
1743000 |
0.68 |
|
|
Naveen Kumar Jain HUF |
1500 |
0.00 |
|
|
Any Other (specify) |
24765000 |
9.65 |
|
|
PPPL Constructions
Private Limited |
23921250 |
9.32 |
|
|
NCJ Infrsturcture Private
Limited |
843750 |
0.33 |
|
|
Sub Total A1 |
143841000 |
56.07 |
|
|
A2) Foreign |
0.00 |
||
|
A=A1+A2 |
143841000 |
56.07 |
STATEMENT SHOWING SHAREHOLDING PATTERN OF THE PUBLIC
SHAREHOLDER
|
Category &
Name of the Shareholders |
No. of fully
paid up equity shares held |
Shareholding %
calculated as per SCRR, 1957 As a % |
|
|
B1) Institutions |
0 |
0.00 |
|
|
Mutual Funds/ |
56906781 |
22.18 |
|
|
Hdfc Trustee Company
Limited A/C HDFC Balanced Fund |
7266000 |
2.83 |
|
|
Sbi Magnum Multicap Fund |
2811495 |
1.10 |
|
|
Icici Prudential Balanced
Fund |
2765252 |
1.08 |
|
|
Sundaram Mutual Fund A/C
Sundaram Smile Fund |
2660022 |
1.04 |
|
|
HDFC Trustee Company
Limited HDFC Mf Monthly Income Plan Long Term Plan |
2566870 |
1.00 |
|
|
Foreign Portfolio
Investors |
13922642 |
5.43 |
|
|
Goldman Sachs India
Limited |
6969061 |
2.72 |
|
|
India Midcap (Mauritius)
Limited |
3739205 |
1.46 |
|
|
Financial Institutions/
Banks |
66787 |
0.03 |
|
|
Sub Total B1 |
70896210 |
27.64 |
|
|
B2) Central Government/
State Government(s)/ President of India |
0 |
0.00 |
|
|
B3) Non-Institutions |
0 |
0.00 |
|
|
Individual share capital
upto INR 0.200 Million |
7477125 |
2.91 |
|
|
Any Other (specify) |
34324830 |
13.38 |
|
|
Foreign Nationals |
1000 |
0.00 |
|
|
HUF |
321113 |
0.13 |
|
|
NRI – Non- Repat |
62473 |
0.02 |
|
|
NRI – Repat |
406625 |
0.16 |
|
|
Clearing Members |
417359 |
0.16 |
|
|
Bodies Corporate |
33116260 |
12.91 |
|
|
Alberta Realtors |
15812500 |
6.16 |
|
|
Ghpl Projects |
9075000 |
3.54 |
|
|
Sub Total B3 |
41801955 |
16.29 |
|
|
B=B1+B2+B3 |
112698165 |
43.93 |
BUSINESS DETAILS
|
Line of Business : |
The Company is engaged in India’s infrastructure development through the construction of highways including BOT (built, operate and transfer projects), airport runways, bridges, flyovers and power transmission projects. [Registered Activity] |
||||
|
|
|
||||
|
Products / Services
: |
|
||||
|
|
|
||||
|
Brand Names : |
Not Available |
||||
|
|
|
||||
|
Agencies Held : |
Not Available |
||||
|
|
|
||||
|
Exports : |
Not Divulged |
||||
|
|
|
||||
|
Imports : |
Not Divulged |
||||
|
|
|
||||
|
Terms : |
|
||||
|
Selling : |
Cheque |
||||
|
|
|
||||
|
Purchasing : |
Cheque |
PRODUCTION STATUS – (NOT AVAILABLE)
GENERAL INFORMATION
|
Suppliers : |
|
||||||||||||||||||||||||||||||
|
|
|
||||||||||||||||||||||||||||||
|
Customers : |
|
||||||||||||||||||||||||||||||
|
|
|
||||||||||||||||||||||||||||||
|
No. of Employees : |
3748 (Approximately) |
||||||||||||||||||||||||||||||
|
|
|
||||||||||||||||||||||||||||||
|
Bankers : |
|
||||||||||||||||||||||||||||||
|
|
|
||||||||||||||||||||||||||||||
|
Facilities : |
The requisite
particulars in respect of secured borrowings are as under: Loan repayable on demand from banks- Cash credit facilities and working capital demand loans from consortium of banks are secured by: (i) Hypothecation against first charge of Stocks viz raw material, stocks in process, finished goods, stores and spares, packing material and book debts of the company. (ii) Further secured by hypothecation of plant and machinery (excepting to hypothecated to Banks and NBFCs) (iii) Equitable mortgage of 6 properties (Land & Building) as per joint deed of Hypothecation belonging to the Directors and Group Company. (iv) Corporate Guarantee of Taj Infrabuilders Private Limited. (v) Personal guarantee of promoters. |
|
Auditors 1: |
|
|
Name : |
Purushottam Agrawal and Company Chartered Accountants |
|
Address : |
401, 4th Floor, 118/8 Maruti Plaza, Sanjay Place, Agra – 282002, Uttar Pradesh, India |
|
|
|
|
Auditors 2: |
|
|
Name : |
S.S. Kothari Mehta and Company |
|
Address : |
146-149 Tribhuvan Complex, Ishwar Nagar, Mathura Road, New Delhi – 110065, India |
|
|
|
|
Memberships : |
Not Available |
|
|
|
|
Collaborators : |
Not Available |
|
|
|
|
Subsidiaries : |
|
|
|
|
|
Joint Ventures : |
|
|
|
|
|
Associates : |
|
|
|
|
|
Entities
controlled/ influenced by KMP and their relatives with whom Transections have
taken place during the period : |
|
CAPITAL STRUCTURE
AS ON 31.03.2017
Authorised Capital :
|
No. of Shares |
Type |
Value |
Amount |
|
|
|
|
|
|
275000000 |
Equity Shares |
INR 02/- each |
INR 550.000 Million |
|
|
|
|
|
Issued, Subscribed & Paid-up Capital :
|
No. of Shares |
Type |
Value |
Amount |
|
|
|
|
|
|
256539165 |
Equity Shares |
INR 02/- each |
INR 513.078 Million |
|
|
|
|
|
RECONCILIATION
OF NUMBER OF SHARES OUTSTANDING AT THE BEGINNING AND AT THE END OF THE
REPORTING PERIOD:
|
Particulars |
Nos. |
|
Opening |
256539165 |
|
Add: Issued during the period |
- |
|
Less:Deductions |
- |
|
Closing |
256539165 |
DETAILS
OF SHARES HELD BY SHAREHOLDERS HOLDING MORE THAN 5% OF THE AGGREGATE SHARES IN
THE COMPANY:
|
Particulars |
31.03.2017 |
|
|
|
No of Shares |
% Holdings |
|
PPPL
Construction Private Limited |
23.921 |
9.32 |
|
HDFC
Mutual Fund |
18.268 |
7.12 |
|
Madhvi
Jain |
17.999 |
7.02 |
|
Naveen
Kumar Jain |
17.758 |
6.92 |
|
Yogesh
Kumar Jain |
16.456 |
6.41 |
|
Pradeep
Kumar Jain |
16.363 |
6.38 |
|
Alberta
Realtors Private Limited |
15.812 |
6.16 |
|
NYLIM
Jacob Ballas India (FVCI) Fund III, LLC |
- |
- |
|
Alberta
Merchants Private Limited |
- |
- |
|
Renu
Jain |
- |
- |
|
PNC
Project Private Limited |
- |
- |
RIGHTS
AND RESTRICTIONS ATTACHED TO EQUITY SHARES
The Company has only one class of equity shares having a par value of INR 2 per share. Each shareholder is eligible for one vote per share held. In case any dividend is proposed by the Board of Directors the same is subject to the approval of the shareholders in the ensuing Annual General Meeting, except in the case of Interim Dividend. There are no restrictions attached to Equity Shares after the issue of 12921708 shares, prior to the IPO, the equity shares were subject to restriction as per investment agreement dated 11th January 2011 and subsequent amendment thereto.
The company has split the face value of its Equity shares to INR 2 per shares as approved by the shareholder of the company through postal ballot on 19th July 2016, as per IND AS 33 “Earning per Share” per share calculation for the corresponding period presented above are based on increased number of Equity Share.
No Bonus Shares/Shares have been issued for consideration other than cash and no Shares have been bought back during the period of five years immediately preceding the current financial year.
FINANCIAL DATA
[all figures are
INR Million]
ABRIDGED
BALANCE SHEET [STANDALONE]
|
SOURCES OF FUNDS |
31.03.2017 |
31.03.2016 |
31.03.2015 |
|
|
|
|
|
|
I.
EQUITY AND LIABILITIES |
|
|
|
|
(1)Shareholders' Funds |
|
|
|
|
(a) Share Capital |
513.078 |
513.078 |
398.078 |
|
(b) Reserves &
Surplus |
15208.646 |
13270.627 |
6786.340 |
|
(c) Money received
against share warrants |
0.000 |
0.000 |
0.000 |
|
|
|
|
|
|
(2) Share Application
money pending allotment |
0.000 |
0.000 |
0.000 |
|
Total Shareholders’ Funds
(1) + (2) |
15721.724 |
13783.705 |
7184.418 |
|
|
|
|
|
|
(3) Non-Current
Liabilities |
|
|
|
|
(a) long-term borrowings |
576.268 |
60.306 |
237.620 |
|
(b) Deferred tax
liabilities (Net) |
0.000 |
0.000 |
3.880 |
|
(c) Other long term
liabilities |
1640.005 |
1567.789 |
2456.990 |
|
(d) long-term provisions |
34.909 |
28.201 |
42.014 |
|
Total Non-current
Liabilities (3) |
2251.182 |
1656.296 |
2740.504 |
|
|
|
|
|
|
(4) Current Liabilities |
|
|
|
|
(a) Short term borrowings |
897.212 |
1.867 |
3002.646 |
|
(b) Trade payables |
2368.993 |
942.236 |
1081.225 |
|
(c) Other current
liabilities |
2492.082 |
2313.787 |
1491.059 |
|
(d) Short-term provisions |
206.252 |
202.414 |
276.966 |
|
Total Current Liabilities
(4) |
5964.539 |
3460.304 |
5851.896 |
|
|
|
|
|
|
TOTAL |
23937.445 |
18900.305 |
15776.818 |
|
|
|
|
|
|
II.
ASSETS |
|
|
|
|
(1) Non-current assets |
|
|
|
|
(a) Fixed Assets |
|
|
|
|
(i) Tangible assets |
3458.971 |
2105.919 |
2103.444 |
|
(ii) Intangible Assets |
19.902 |
19.321 |
1.320 |
|
(iii) Capital
work-in-progress |
78.162 |
18.682 |
56.634 |
|
(iv) Intangible assets
under development |
0.000 |
0.000 |
13.054 |
|
(b) Non-current
Investments |
4675.735 |
4643.635 |
4235.372 |
|
(c) Deferred tax assets
(net) |
22.541 |
29.885 |
0.000 |
|
(d) Long-term Loan and Advances |
0.000 |
0.000 |
1035.734 |
|
(e) Other Non-current
assets |
4297.109 |
2397.011 |
70.471 |
|
Total Non-Current Assets |
12552.420 |
9214.453 |
7516.029 |
|
|
|
|
|
|
(2) Current assets |
|
|
|
|
(a) Current investments |
0.000 |
0.000 |
0.000 |
|
(b) Inventories |
1534.787 |
2363.774 |
2225.263 |
|
(c) Trade receivables |
6308.622 |
3762.980 |
3667.377 |
|
(d) Cash and cash
equivalents |
354.932 |
970.504 |
211.558 |
|
(e) Short-term loans and
advances |
0.000 |
0.000 |
2143.057 |
|
(f) Other current assets |
3186.684 |
2588.594 |
13.534 |
|
Total Current Assets |
11385.025 |
9685.852 |
8260.789 |
|
|
|
|
|
|
TOTAL |
23937.445 |
18900.305 |
15776.818 |
PROFIT
& LOSS ACCOUNT [STANDALONE]
|
|
PARTICULARS |
31.03.2017 |
31.03.2016 |
31.03.2015 |
|
|
SALES |
|
|
|
|
|
Income |
16891.141 |
20141.609 |
15609.854 |
|
|
Other Income |
465.546 |
253.365 |
138.208 |
|
|
TOTAL |
17356.687 |
20394.974 |
15748.062 |
|
|
|
|
|
|
|
Less |
EXPENSES |
|
|
|
|
|
Cost of Materials
Consumed |
8167.962 |
8794.664 |
6317.339 |
|
|
Changes in inventories of
finished goods, work-in-progress and Stock-in-Trade |
248.126 |
345.066 |
(600.815) |
|
|
Employees benefits
expense |
1003.383 |
835.187 |
737.359 |
|
|
Other expenses |
5261.481 |
7506.468 |
6989.764 |
|
|
TOTAL |
14680.952 |
17481.385 |
13443.647 |
|
|
|
|
|
|
|
|
PROFIT/ (LOSS) BEFORE INTEREST, TAX, DEPRECIATION AND
AMORTISATION |
2675.735 |
2913.589 |
2304.415 |
|
|
|
|
|
|
|
Less |
FINANCIAL EXPENSES |
203.103 |
399.397 |
462.351 |
|
|
|
|
|
|
|
|
PROFIT / (LOSS) BEFORE
TAX, DEPRECIATION AND AMORTISATION |
2472.632 |
2514.192 |
1842.064 |
|
|
|
|
|
|
|
Less |
DEPRECIATION/
AMORTISATION |
533.341 |
570.443 |
363.663 |
|
|
|
|
|
|
|
|
PROFIT/ (LOSS) BEFORE TAX |
1939.291 |
1943.749 |
1478.401 |
|
|
|
|
|
|
|
Less |
TAX |
(157.569) |
(401.929) |
474.797 |
|
|
|
|
|
|
|
|
PROFIT/ (LOSS) AFTER TAX
|
2096.860 |
2345.678 |
1003.604 |
|
|
|
|
|
|
|
Add |
PREVIOUS YEARS’ BALANCE
BROUGHT FORWARD |
7356.765 |
5104.159 |
4018.398 |
|
|
|
|
|
|
|
Add |
Re-Measurement of Defined
Benefit Obligation |
2.217 |
(0.443) |
1844.067 |
|
|
|
|
|
|
|
|
APPROPRIATIONS |
|
|
|
|
|
Transfer
to General Reserve |
0.000 |
0.000 |
29.362 |
|
|
Dividend
Paid |
161.058 |
92.629 |
76.959 |
|
|
Adjustment
of depreciation |
0.000 |
0.000 |
164.660 |
|
|
Corporate
Dividend Tax |
0.000 |
0.000 |
15.666 |
|
|
Total |
161.058 |
92.629 |
286.647 |
|
|
|
|
|
|
|
|
Balance Carried to the
B/S |
9294.784 |
7356.765 |
6579.422 |
|
|
|
|
|
|
|
|
Earnings / (Loss) Per
Share (INR) |
33.59 |
6.72 |
25.21 |
CURRENT MATURITIES
OF LONG TERM DEBT DETAILS
|
Particulars |
31.03.2017 |
31.03.2016 |
31.03.2015 |
|
Current Maturities of Long term debt |
217.920 |
56.699 |
285.189 |
|
Cash generated from operations |
(249.471) |
517.422 |
1130.506 |
|
Net cash flow from (used in) operations |
(85.699) |
(906.909) |
632.282 |
QUARTERLY
RESULTS
|
PARTICULARS |
|
30.06.2017 1st
Quarter |
30.09.2017 2nd
Quarter |
|
Unaudited |
|
|
|
|
Net Sales |
|
3566.520 |
2685.660 |
|
Total Expenditure |
|
3046.940 |
2288.720 |
|
PBIDT (Excl OI) |
|
519.580 |
396.940 |
|
Other Income |
|
55.040 |
52.100 |
|
Operating Profit |
|
574.620 |
449.040 |
|
Interest |
|
80.000 |
76.810 |
|
Exceptional Items |
|
NA |
NA |
|
PBDT |
|
494.610 |
372.230 |
|
Depreciation |
|
175.220 |
184.44 |
|
Profit Before Tax |
|
319.390 |
187.790 |
|
Tax |
|
21.310 |
21.270 |
|
Provisions and contingencies |
|
NA |
NA |
|
Profit After Tax |
|
298.080 |
166.520 |
|
Extraordinary Items |
|
NA |
NA |
|
Prior Period Expenses |
|
NA |
NA |
|
Other Adjustments |
|
NA |
NA |
|
Net Profit |
|
298.080 |
166.520 |
KEY
RATIOS
EFFICIENCY RATIOS
|
PARTICULARS |
31.03.2017 |
31.03.2016 |
31.03.2015 |
|
Average Collection Days (Sundry Debtors /Income * 365 Days) |
136.32 |
68.19 |
85.75 |
|
|
|
|
|
|
Account Receivables Turnover (Income / Sundry
Debtors) |
2.68 |
5.35 |
4.26 |
|
|
|
|
|
|
Average Payment Days (Sundry Creditors
/ Purchases * 365 Days) |
105.86 |
39.11 |
62.47 |
|
|
|
|
|
|
Inventory Turnover (Operating Income
/ Inventories) |
1.74 |
1.23 |
1.04 |
|
|
|
|
|
|
Asset Turnover (Operating Income
/ Net Fixed Assets) |
0.75 |
1.36 |
1.06 |
LEVERAGE RATIOS
|
PARTICULARS |
31.03.2017 |
31.03.2016 |
31.03.2015 |
|
Debt Ratio ((Borrowing + Current Liabilities) / Total
Assets) |
0.28 |
0.19 |
0.40 |
|
|
|
|
|
|
Debt Equity Ratio (Total Liability /
Networth) |
0.11 |
0.01 |
0.49 |
|
|
|
|
|
|
Current Liabilities to Networth (Current
Liabilities / Net Worth) |
0.38 |
0.25 |
0.81 |
|
|
|
|
|
|
Fixed Assets to Networth (Net Fixed Assets
/ Networth) |
0.23 |
0.16 |
0.30 |
|
|
|
|
|
|
Interest Coverage Ratio (PBIT / Financial
Charges) |
13.17 |
7.29 |
4.98 |
PROFITABILITY RATIOS
|
PARTICULARS |
|
31.03.2017 |
31.03.2016 |
31.03.2015 |
|
PAT to Sales [(PAT/Sales) * 100) |
% |
12.41 |
11.65 |
6.43 |
|
|
|
|
|
|
|
Return on Total Assets ((PAT / Total
Assets) * 100) |
% |
8.76 |
12.41 |
6.36 |
|
|
|
|
|
|
|
Return on Investment (ROI) ((PAT / Networth)
* 100) |
% |
13.34 |
17.02 |
13.97 |
SOLVENCY RATIOS
|
PARTICULARS |
31.03.2017 |
31.03.2016 |
31.03.2015 |
|
Current Ratio (Current Assets / Current Liabilities) |
1.91 |
2.80 |
1.41 |
|
|
|
|
|
|
Quick Ratio ((Current Assets
– Inventories) / Current Liabilities) |
1.65 |
2.12 |
1.03 |
|
|
|
|
|
|
G-Score Ratio Financial (Networth / Total
Assets) |
0.66 |
0.73 |
0.46 |
|
|
|
|
|
|
G-Score Ratio Debt (Debts / Equity
Capital) |
3.30 |
0.23 |
8.86 |
|
|
|
|
|
|
G-Score Ratio Liquidity (Total Current
Assets / Total Current Liabilities) |
1.91 |
2.80 |
1.41 |
Total Liability = Short-term Debt + Long-term
Debt + Current Maturities of Long-term debts
STOCK
PRICES
|
Face Value |
INR 2/- |
|
Market Value |
INR 186.40/- |
FINANCIAL ANALYSIS
[all figures are
INR Million]
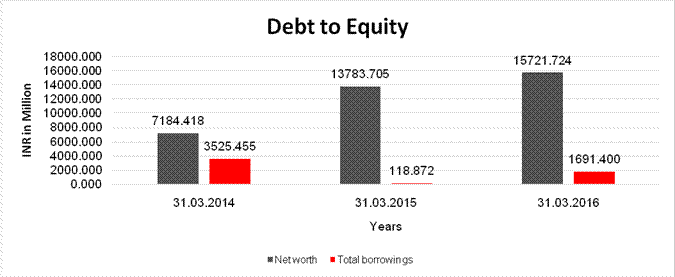
DEBT EQUITY RATIO
|
Particular |
31.03.2015 |
31.03.2016 |
31.03.2017 |
|
|
INR In
Million |
INR
In Million |
INR
In Million |
|
Share Capital |
398.078 |
513.078 |
513.078 |
|
Reserves & Surplus |
6786.340 |
13270.627 |
15208.646 |
|
Net
worth |
7184.418 |
13783.705 |
15721.724 |
|
|
|
|
|
|
Long Term borrowings |
237.620 |
60.306 |
576.268 |
|
Short Term borrowings |
3002.646 |
1.867 |
897.212 |
|
Current Maturities of Long term debt |
285.189 |
56.699 |
217.920 |
|
Total
borrowings |
3525.455 |
118.872 |
1691.400 |
|
Debt/Equity
ratio |
0.491 |
0.009 |
0.108 |
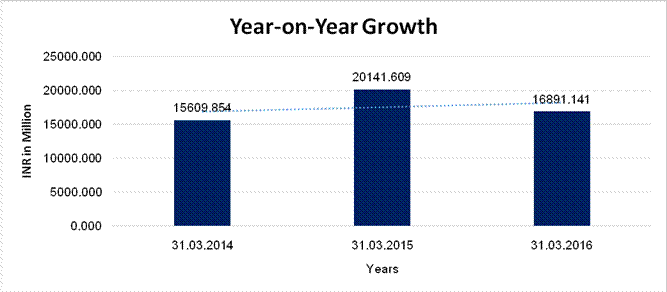
YEAR-ON-YEAR GROWTH
|
Year
on Year Growth |
31.03.2015 |
31.03.2016 |
31.03.2017 |
|
|
INR
In Million |
INR
In Million |
INR
In Million |
|
Sales
|
15609.854 |
20141.609 |
16891.141 |
|
|
|
29.031 |
(16.138) |
NET PROFIT MARGIN
|
Net
Profit Margin |
31.03.2015 |
31.03.2016 |
31.03.2017 |
|
|
INR
In Million |
INR
In Million |
INR
In Million |
|
Sales
|
15609.854 |
20141.609 |
16891.141 |
|
Profit |
1003.604 |
2345.678 |
2096.860 |
|
|
6.43% |
11.65% |
12.41% |

ABRIDGED
BALANCE SHEET [CONSOLIDATED]
|
SOURCES OF FUNDS |
31.03.2017 |
31.03.2016 |
|
|
|
|
|
I.
EQUITY AND LIABILITIES |
|
|
|
(1)Shareholders' Funds |
|
|
|
(a) Share Capital |
513.078 |
513.078 |
|
(b) Reserves &
Surplus |
14097.235 |
13065.581 |
|
(c) Money received
against share warrants |
0.084 |
0.510 |
|
|
|
|
|
(2) Share Application
money pending allotment |
0.000 |
0.000 |
|
Total Shareholders’ Funds
(1) + (2) |
14610.397 |
13579.169 |
|
|
|
|
|
(3) Non-Current
Liabilities |
|
|
|
(a) long-term borrowings |
16733.656 |
15713.421 |
|
(b) Deferred tax
liabilities (Net) |
622.239 |
631.573 |
|
(c) Other long term
liabilities |
1769.175 |
1563.010 |
|
(d) long-term provisions |
648.831 |
172.519 |
|
Total Non-current
Liabilities (3) |
19773.901 |
18080.523 |
|
|
|
|
|
(4) Current Liabilities |
|
|
|
(a) Short term borrowings |
1212.866 |
299.172 |
|
(b) Trade payables |
13805.772 |
13940.838 |
|
(c) Other current
liabilities |
3205.207 |
2778.524 |
|
(d) Short-term provisions |
199.197 |
192.946 |
|
Total Current Liabilities
(4) |
18423.042 |
17211.480 |
|
|
|
|
|
TOTAL |
52807.340 |
48871.172 |
|
|
|
|
|
II.
ASSETS |
|
|
|
(1) Non-current assets |
|
|
|
(a) Fixed Assets |
|
|
|
(i) Tangible assets |
3512.103 |
2169.981 |
|
(ii) Intangible Assets |
20536.160 |
22301.936 |
|
(iii) Capital
work-in-progress |
78.162 |
18.682 |
|
(iv) Intangible assets under
development |
0.000 |
0.000 |
|
(b) Non-current
Investments |
351.629 |
558.883 |
|
(c) Deferred tax assets
(net) |
633.349 |
518.007 |
|
(d) Long-term Loan and Advances |
0.000 |
0.000 |
|
(e) Other Non-current
assets |
4506.458 |
2524.923 |
|
Total Non-Current Assets |
29617.861 |
28092.412 |
|
|
|
|
|
(2) Current assets |
|
|
|
(a) Current investments |
675.301 |
102.898 |
|
(b) Inventories |
1534.787 |
2363.774 |
|
(c) Trade receivables |
18135.582 |
15010.659 |
|
(d) Cash and cash equivalents |
465.517 |
1065.817 |
|
(e) Short-term loans and
advances |
0.000 |
0.000 |
|
(f) Other current assets |
2378.292 |
2235.612 |
|
Total Current Assets |
23189.479 |
20778.760 |
|
|
|
|
|
TOTAL |
52807.340 |
48871.172 |
PROFIT
& LOSS ACCOUNT [CONSOLIDATED]
|
|
PARTICULARS |
31.03.2017 |
31.03.2016 |
|
|
SALES |
|
|
|
|
Income |
22523.320 |
28367.842 |
|
|
Other Income |
405.957 |
247.464 |
|
|
TOTAL |
22929.277 |
28615.306 |
|
|
|
|
|
|
Less |
EXPENSES |
|
|
|
|
Cost of Materials
Consumed |
8167.962 |
8804.772 |
|
|
Changes in inventories of
finished goods, work-in-progress and Stock-in-Trade |
248.126 |
345.066 |
|
|
Employees benefits
expense |
1189.625 |
952.459 |
|
|
Share in profit/loss of associates |
207.254 |
125.682 |
|
|
Other expenses |
6676.845 |
12042.196 |
|
|
TOTAL |
16489.812 |
22270.175 |
|
|
|
|
|
|
|
PROFIT/ (LOSS) BEFORE INTEREST, TAX, DEPRECIATION AND
AMORTISATION |
6439.465 |
6345.131 |
|
|
|
|
|
|
Less |
FINANCIAL EXPENSES |
3101.921 |
2574.003 |
|
|
|
|
|
|
|
PROFIT / (LOSS) BEFORE
TAX, DEPRECIATION AND AMORTISATION |
3337.544 |
3771.128 |
|
|
|
|
|
|
Less |
DEPRECIATION/
AMORTISATION |
2415.673 |
2127.283 |
|
|
|
|
|
|
|
PROFIT/ (LOSS) BEFORE TAX |
921.871 |
1643.845 |
|
|
|
|
|
|
Less |
TAX |
(260.910) |
(442.790) |
|
|
|
|
|
|
|
PROFIT/ (LOSS) AFTER TAX
|
1182.781 |
2086.635 |
|
|
|
|
|
|
|
Earnings / (Loss) Per
Share (INR) |
|
|
|
Basic |
48.75 |
6.72 |
|
|
|
Diluted |
16.10 |
2.290 |
LOCAL AGENCY FURTHER INFORMATION
|
Sr. No. |
Check list by
info agents |
Available in
Report (Yes/No) |
|
1 |
Year of establishment |
Yes |
|
2 |
Constitution of the entity -Incorporation
details |
Yes |
|
3 |
Locality of the entity |
Yes |
|
4 |
Premises details |
No |
|
5 |
Buyer visit details |
-- |
|
6 |
Contact numbers |
Yes |
|
7 |
Name of the person contacted |
Yes |
|
8 |
Designation of contact person |
Yes |
|
9 |
Promoter’s background |
Yes |
|
10 |
Date of Birth of Proprietor / Partners /
Directors |
No |
|
11 |
Pan Card No. of Proprietor / Partners |
No |
|
12 |
Voter Id Card No. of Proprietor / Partners |
No |
|
13 |
Type of business |
Yes |
|
14 |
Line of Business |
Yes |
|
15 |
Export/import details (if applicable) |
No |
|
16 |
No. of employees |
Yes |
|
17 |
Details of sister concerns |
Yes |
|
18 |
Major suppliers |
No |
|
19 |
Major customers |
No |
|
20 |
Banking Details |
Yes |
|
21 |
Banking facility details |
Yes |
|
22 |
Conduct of the banking account |
-- |
|
23 |
Financials, if provided |
Yes |
|
24 |
Capital in the business |
Yes |
|
25 |
Last accounts filed at ROC, if applicable |
Yes |
|
26 |
Turnover of firm for last three years |
Yes |
|
27 |
Reasons for variation <> 20% |
-- |
|
28 |
Estimation for coming financial year |
No |
|
29 |
Profitability for last three years |
Yes |
|
30 |
Major shareholders, if available |
Yes |
|
31 |
External Agency Rating, if available |
Yes |
|
32 |
Litigations that the firm/promoter involved
in |
-- |
|
33 |
Market information |
-- |
|
34 |
Payments terms |
Yes |
|
35 |
Negative Reporting by Auditors in the
Annual Report |
No |
COMPANY OVERVIEW:
Subject was incorporated on
9th August 1999 as PNC Construction Company Private Limited. The Company was
converted into a limited company in 2001 and was renamed PNC Infratech Limited
in 2007. The Company has raised the equity capital by issue and allotment of
equity share through Initial Public Offer (IPO) during the current year in May
2015 and listed with National Stock Exchange and Bombay Stock Exchange.
The Company is engaged in
India’s infrastructure development through the construction of highways
including BOT (built, operate and transfer projects), airport runways, bridges,
flyovers and power transmission projects, among others.
In case of BOT, the company
bid as a sponsor either alone or in the joint venture with other venturer and
once the project is awarded then it is executed by incorporating a company
(special purpose vehicle).
The Company’s registered
office is located in New Delhi, corporate office in Agra and operations are
spread across Haryana, Karnataka, Madhya Pradesh, Maharashtra, Punjab,
Rajasthan, Tamilnadu, Uttar Pradesh, Uttarakhand, Assam, West Bengal and Bihar
among others.
The Company is ISO
9001:2008-certified, awarded ‘SS’ (Super Special) class from the Military
Engineering Services as well as appreciation from NHAI and the Military
Engineer Services, Ministry of Defence.
The
Consolidated financial statements were authorised for issue in accordance with
the resolution of the directors on 24th May 2017.
MANAGEMENT DISCUSSION AND
ANALYSIS
GLOBAL ECONOMIC
OVERVIEW:
The global economy has picked up pace, thanks to the recovery in industrial activity, increasing consumer confidence, constantly low oil prices and benign interest rates. Global trade is also picking up after two years of marked weakness.
As per the estimation of World Bank’s June 2017 Global Economic Prospects, global growth is projected to be 2.7% in 2017 and 2.9% in 2018 &19. The growth of advanced economies is forecasted to increase by 1.9% in 2017 and 1.8% in 2018 while the emerging markets and developing economies (EMDEs) are expected to record growth of 4.1 % in 2017 and 4.5 % in 2018. Among the advanced economies, United States will be leading the growth followed by European Countries and Japan. Investment across advanced economies has firmed and domestic demand and exports have also strengthened. Among EMDEs, South Asian countries and East Asia and Pacific countries will be recording the highest growth. India and China would continue to grow at a much higher rate of 7.2% and 6.5% in 2017 respectively. EMDEs are benefitting from robust capital inflows in the first half of 2017. However, gradual tightening of monetary policies worldwide may weigh on capital flows in future.
INDIAN ECONOMIC
OVERVIEW:
Indian economy has undergone series of structural reforms that are being undertaken by the present government.
The passage of important legislations like GST, Bankruptcy Bill etc. have boosted the confidence in Indian economy. According to Moody’s, “GST will support higher government revenuecompliance and administration. Both will be positive for India’s credit profile, which is constrained by a relatively low revenue base”. Last year, the government announced demonetisation of high value old currencies to tab black money operations, encourage digitalisation as well as to control tax evasion. Although demonetisation may have caused some temporary headwinds, it is believed that it would prove beneficial in the long-term. These efforts will likely boost the overall growth of the Indian economy. As per the estimation of CSO, Indian economy will grow by 7.1% during the current
fiscal. The recent economic indicators are also pointing to recovery in the Indian economy as inflation and interest rates have come down, manufacturing activity and ease of doing business has improved and fiscal deficit is also under control. IMD’s rainfall forecasts are also above normal for this year which will in turn boost the agriculture income and overall consumer consumption especially in the rural economies.
OUTLOOK:
The outlook of road sector is encouraging and strong, supported by government’s concentration on the development of Transportation Infrastructure in country as it acts as a catalyst for socio-economic development. With established relationships with public sector clientele and excellent prequalification credentials the Company is very well-placed to take the benefit of government’s focus on infrastructure development in the country.
The year gone by has strengthened management’s capability to steer the Company through difficult operating environment for the sector. The Company with its in-house design and engineering capability support by in house construction and equipment bank provides an execution edge. The robust order book backed by superior execution capabilities and strong balance sheet will help Company to outperform in the upcoming years. The Infrastructure development thrust of the Government will help the industry to move forward with a renewed vigor and as a key industry participant their Company is expected to maximize every stakeholder’s value.
INDEX OF CHARGE:
|
SNO |
SRN |
CHARGE ID |
CHARGE HOLDER NAME |
DATE OF CREATION |
DATE OF MODIFICATION |
DATE OF SATISFACTION |
AMOUNT |
ADDRESS |
|
1 |
G67614362 |
100136353 |
YES BANK
LIMITED |
10/11/2017 |
- |
- |
10921842.0 |
IFC 2, 24TH
FLOOR, SENAPATI BAPAT MARG, ELEPHINSTONE (WEST), MUMBAI – 400013,
MAHARASHTRA, INDIA |
|
2 |
G65673584 |
100135953 |
AXIS BANK
LIMITED |
08/11/2017 |
- |
- |
9781920.0 |
TRISHUL 3RD
FLOOR OPPOSITE SAMARTHESHWAR TEMPLELAW GARDEN ELLISBRIDGE, AHMEDABAD –
380006, INDIA |
|
3 |
G67553818 |
100136304 |
HDFC BANK
LIMITED |
06/11/2017 |
- |
- |
7009200.0 |
HDFC BANK HOUSE,
SENAPATI BAPAT MARG, LOWER PAREL (WEST), MUMBAI – 400013, MAHARASHTRA, INDIA |
|
4 |
G67599928 |
100136336 |
HDFC BANK
LIMITED |
06/11/2017 |
- |
- |
34621200.0 |
HDFC BANK
HOUSE, SENAPATI BAPAT MARG, LOWER PAREL (WEST), MUMBAI – 400013, MAHARASHTRA,
INDIA |
|
5 |
G60770815 |
100132227 |
AXIS BANK
LIMITED |
31/10/2017 |
- |
- |
7009200.0 |
TRISHUL 3RD
FLOOR OPPOSITE SAMARTHESHWAR TEMPLELAW GARDEN ELLISBRIDGE, AHMEDABAD –
380006, INDIA |
|
6 |
G60899465 |
100132440 |
YES BANK
LIMITED |
27/10/2017 |
- |
- |
54205200.0 |
YES BANK
TOWER, IFC 2, 24TH FLOOR,ELEPHINSTONE(W), SENAPATI BAPAT
MARG,MUMBAIMH400013IN |
|
7 |
G58677972 |
100129767 |
HDFC BANK
LIMITED |
06/10/2017 |
- |
- |
4131000.0 |
HDFC BANK HOUSE,
SENAPATI BAPAT MARG, LOWER PAREL (WEST), MUMBAI – 400013, MAHARASHTRA, INDIA |
|
8 |
G56946916 |
100128082 |
HDFC BANK
LIMITED |
04/10/2017 |
- |
- |
11395000.0 |
HDFC BANK
HOUSE, SENAPATI BAPAT MARG, LOWER PAREL (WEST), MUMBAI – 400013, MAHARASHTRA,
INDIA |
|
9 |
G56948268 |
100128086 |
HDFC BANK
LIMITED |
04/10/2017 |
- |
- |
16382766.0 |
HDFC BANK
HOUSE, SENAPATI BAPAT MARG, LOWER PAREL (WEST), MUMBAI – 400013, MAHARASHTRA,
INDIA |
|
10 |
G61580064 |
100133138 |
YES BANK
LIMITED |
27/09/2017 |
- |
- |
38769040.0 |
IFC TOWER
2, 06 TH FLOOR, ELEPHINSTONE ROAD – (WEST), MUMBAI – 400013, MAHARASHTRA,
INDIA |
CONTINGENT
LIABILITIES:
(INR in million)
|
PARTICULARS |
31.03.2017 |
31.03.2016 |
|
Claims against The Company not acknowledged
as debts |
|
|
|
Disputed demand of Income Tax (includes, net of advance tax and TDS under verification, adjusted from demand of INR 335.100 million arised in assessment of search proceedings up to AY 2012-13) for which company has won the appeal, but limitation of period for further appeal has not expired. |
112.593 |
112.593 |
|
Disputed demand of Sales Tax/ VAT for which company preferred appeal |
187.048 |
311.515 |
|
Disputed demand of Service Tax for which company preferred appeal |
52.690 |
50.339 |
|
Disputed demand of Entry Tax for which company preferred appeal |
9.841 |
75.785 |
|
Others (including motor accident, labour and civil matters) |
46.313 |
103.304 |
|
(Interest and penalties if any, on above cases will be decided at the time of settlement) |
|
|
|
Other |
|
|
|
- Letter of Credit outstanding |
76.004 |
159.653 |
|
- Being difference between normat tax and MAT for FY 2015-16* |
- |
- |
|
(In case normal tax liability is crystalised, MAT credit entitlement reversal wil take place) |
|
|
* Contingent Liability of INR 277.963 Million being difference between normal tax and MAT for FY 2015-16 has not been disclosed as MAT Liability has been accepted by the department in previous year’s assessement.
STANDALONE UNAUDITED
FINANCIAL RESULTS FOR THE QUARTER ENDED 30.09.2017
(INR In Million)
|
Particulars |
Quarter ended |
Half Year Ended |
|
|
|
30.09.2017 |
30.06.2016 |
30.09.2017 |
|
|
Unaudited |
Unaudited |
Unaudited |
|
INCOME FROM OPERATIONS |
|
|
|
|
Net Sales |
2685.655 |
3566.517 |
6252.172 |
|
Other Operating Income |
52.101 |
55.042 |
107.143 |
|
Total
Income from Operations |
2737.756 |
3621.559 |
6359.315 |
|
|
|
|
|
|
EXPENSES |
|
|
|
|
Cost of materials consumed |
1753.584 |
2302.098 |
4055.682 |
|
Changes in inventories of finished goods and
work-in-progress |
11.700 |
81.534 |
93.234 |
|
Employee benefits expense |
237.753 |
264.024 |
501.777 |
|
Finance Cost |
76.811 |
80.001 |
156.812 |
|
Depreciation and Amortization expenses |
184.436 |
175.225 |
134.176 |
|
Other Expenditure |
285.685 |
399.286 |
684.971 |
|
Total
Expenses |
2549.969 |
3302.168 |
5852.137 |
|
Profit/(Loss)
from Operations before Other Income, Finance Costs, & Net Exceptional
income/ (Expenditure) |
187.787 |
319.391 |
507.178 |
|
Exceptional items |
0.000 |
0.000 |
0.000 |
|
Profit
/ (Loss) before Tax |
187.787 |
319.391 |
507.178 |
|
Tax
Expense |
|
|
|
|
Current Tax |
27.991 |
18.114 |
46.105 |
|
Taxation in respect of earlier years |
0.000 |
0.000 |
0.000 |
|
Deferred Tax |
(6.723) |
3.198 |
(3.525) |
|
Total
provision of Tax |
21.268 |
21.312 |
42.580 |
|
|
|
|
|
|
Profit
/ (Loss) after Tax |
166.519 |
298.079 |
464.598 |
|
|
|
|
|
|
Other
Comprehensive Income |
|
|
|
|
Item
that will not be reclassified to
profit and loss (Net of Tax) |
5.58 |
5.57 |
11.15 |
|
Item
that will be reclassified to profit and loss (Net of Tax) |
0.000 |
0.000 |
0.000 |
|
Total
Comprehensive Income (Net of Taxes) |
167.077 |
298.636 |
465.713 |
|
|
|
|
|
|
Paid-up Equity Share Capital (Face value INR 02/- per
share) |
513.078 |
513.078 |
513.078 |
|
Reserves (excluding Revaluation Reserve) |
15513.301 |
15507.283 |
15513.301 |
|
Earnings per Share (EPS) – INR Basic and Diluted (Face value INR 02/- per share) |
0.65 |
1.16 |
1.81 |
Notes:
1. The above unaudited standalone results, reviewed and recommended by the Audit Committee, were approved by the Board of Directors at its meeting held on 14.11.2017.
2. The standalone financial results for the quarter/half year ended on
September 30, 2017 are in compliance with Indian Accounting Standards (Ind-AS)
notified by the Ministry of Corporate Affairs read with SEB1 Circular No CIR/CFD/FAC/62/2016
dated 5th July, 2016 and were subject to limited review by the auditors.
3. During the half year ended September 30, 2017, three new subsidiaries
"PNC Chitradurga Highways Private Limited", "PNC Bundelkhand
Highways Private Limited" and "PNC Khajuraho Highways Private
Limited" have been incorporated.
4. The Company has only single reportable primary segment which is
Infrastructure Development and construction/project activities.
5. The Company has opted not to submit the Consolidated Financial results
pursuant to regulation 33(3) (b) of SEBI (Listing Obligations and Disdosures
Requirements) Regulations, 2015.
6. Figures relating to previous period have been regrouped /rearranged,
wherever necessary, to make them comparable with this current quarter/period.
STANDALONE
STATEMENT OF ASSTES AND LIABILITIES AS ON 30.09.2017
(INR In Million)
|
SOURCES OF FUNDS |
|
|
30.09.2017 (Unaudited) |
|
I.
EQUITY
AND LIABILITIES |
|
|
|
|
(1)Shareholders' Funds |
|
|
|
|
(a) Share Capital |
|
|
513.078 |
|
(b) Reserves & Surplus |
|
|
15513.301 |
|
Sub-total Shareholders’ |
|
|
16026.379 |
|
|
|
|
|
|
(2) Non-Current Liabilities |
|
|
|
|
(a) long-term borrowings |
|
|
724.147 |
|
(b) Deferred tax liabilities (Net) |
|
|
0.000 |
|
(c) Other long term liabilities |
|
|
2703.818 |
|
(d) long-term provisions |
|
|
37.674 |
|
Sub-total of
Non-Current liabilities |
|
|
3465.639 |
|
|
|
|
|
|
(3)
Current liabilities |
|
|
|
|
(a) Short
term borrowings |
|
|
162.029 |
|
(b) Trade
payables |
|
|
2857.138 |
|
(c) Other
current liabilities |
|
|
2462.319 |
|
(d) Short-term
provisions |
|
|
316.696 |
|
Sub-total of Current liabilities |
|
|
5798.182 |
|
|
|
|
|
|
TOTAL |
|
|
25290.200 |
|
|
|
|
|
|
II.
ASSETS |
|
|
|
|
(1)
Non-current assets |
|
|
|
|
(a) Fixed
Assets |
|
|
|
|
(i) Tangible assets |
|
|
3506.617 |
|
(ii) Intangible Assets |
|
|
18.098 |
|
(iii) Capital work-in-progress |
|
|
30.570 |
|
(iv) Intangible assets under development |
|
|
0.000 |
|
(b)
Non-Current investments |
|
|
4853.735 |
|
(c) Deferred
tax assets (net) |
|
|
25.492 |
|
(d) Long
term loans and advances |
|
|
0.000 |
|
(e) Other
non-current assets |
|
|
4789.926 |
|
Sub-total of
Non-Current Assets |
|
|
13224.438 |
|
|
|
|
|
|
(2)
Current assets |
|
|
|
|
(a)
Current investments |
|
|
0.000 |
|
(b)
Inventories |
|
|
1803.880 |
|
(c) Trade receivables |
|
|
5356.328 |
|
(d) Cash
and cash equivalents |
|
|
1387.226 |
|
(e)
Short-term loans and advances |
|
|
0.000 |
|
(f) Other
current assets |
|
|
3518.328 |
|
Sub-total of
Current Assets |
|
|
12065.762 |
|
|
|
|
|
|
TOTAL |
|
|
25290.200 |
FIXED ASSETS:
·
Land
·
Building
·
Plant and Machinery
·
Office Equipment
·
Furniture and Fixture
·
Computer
·
Vehicles
CMT REPORT (Corruption, Money Laundering & Terrorism]
The Public Notice information has been collected from various sources including
but not limited to: The Courts,
1] INFORMATION ON
DESIGNATED PARTY
No exist designating subject or any of its beneficial owners,
controlling shareholders or senior officers as terrorist or terrorist organization
or whom notice had been received that all financial transactions involving
their assets have been blocked or convicted, found guilty or against whom a
judgement or order had been entered in a proceedings for violating
money-laundering, anti-corruption or bribery or international economic or
anti-terrorism sanction laws or whose assets were seized, blocked, frozen or
ordered forfeited for violation of money laundering or international
anti-terrorism laws.
2] Court Declaration :
No records exist to suggest that subject is
or was the subject of any formal or informal allegations, prosecutions or other
official proceeding for making any prohibited payments or other improper
payments to government officials for engaging in prohibited transactions or
with designated parties.
3] Asset Declaration :
No records exist to suggest that the property or assets of the subject
are derived from criminal conduct or a prohibited transaction.
4] Record on Financial
Crime :
Charges or conviction
registered against subject: None
5] Records on Violation of
Anti-Corruption Laws :
Charges or
investigation registered against subject: None
6] Records on Int’l
Anti-Money Laundering Laws/Standards :
Charges or
investigation registered against subject: None
7] Criminal Records
No
available information exist that suggest that subject or any of its principals
have been formally charged or convicted by a competent governmental authority
for any financial crime or under any formal investigation by a competent government
authority for any violation of anti-corruption laws or international anti-money
laundering laws or standard.
8] Affiliation with
Government :
No record
exists to suggest that any director or indirect owners, controlling
shareholders, director, officer or employee of the company is a government
official or a family member or close business associate of a Government
official.
9] Compensation Package :
Our market
survey revealed that the amount of compensation sought by the subject is fair
and reasonable and comparable to compensation paid to others for similar
services.
10] Press Report :
No press reports / filings exists on
the subject.
CORPORATE GOVERNANCE
MIRA INFORM as part of its Due Diligence do provide comments on
Corporate Governance to identify management and governance. These factors often
have been predictive and in some cases have created vulnerabilities to credit
deterioration.
Our Governance Assessment focuses principally on the interactions
between a company’s management, its Board of Directors, Shareholders and other
financial stakeholders.
CONTRAVENTION
Subject is not known to have contravened any existing local laws,
regulations or policies that prohibit, restrict or otherwise affect the terms
and conditions that could be included in the agreement with the subject.
FOREIGN EXCHANGE RATES
|
Currency |
Unit
|
INR |
|
US Dollar |
1 |
INR 63.55 |
|
|
1 |
INR 78.87 |
|
Euro |
1 |
INR 89.82 |
INFORMATION DETAILS
|
Information
Gathered by : |
PNM |
|
|
|
|
Analysis Done by
: |
NSG |
|
|
|
|
Report Prepared
by : |
GEET |
SCORE FACTORS
|
DEMERIT POINTS |
|
|
|
--BANK CHARGES |
YES/NO |
YES |
|
--LITIGATION |
YES/NO |
NO |
|
--OTHER ADVERSE INFORMATION |
YES/NO |
NO |
|
MERIT POINTS |
|
|
|
--SOLE DISTRIBUTORSHIP |
YES/NO |
NO |
|
--EXPORT ACTIVITIES |
YES/NO |
NO |
|
--AFFILIATION |
YES/NO |
YES |
|
--LISTED |
YES/NO |
YES |
|
--OTHER MERIT FACTORS |
YES/NO |
YES |
RATING EXPLANATIONS
|
Credit Rating |
Explanation |
Rating Comments |
|
A++ |
Minimum Risk |
Business dealings permissible with minimum
risk of default |
|
A+ |
Low Risk |
Business dealings permissible with low
risk of default |
|
A |
Acceptable Risk |
Business dealings permissible with
moderate risk of default |
|
B |
Medium Risk |
Business dealings permissible on a regular
monitoring basis |
|
C |
Medium High Risk |
Business dealings permissible preferably
on secured basis |
|
D |
High Risk |
Business dealing not recommended or on
secured terms only |
|
NB |
New Business |
No recommendation can be done due to
business in infancy stage |
|
NT |
No Trace |
No recommendation can be done as the
business is not traceable |
NB is stated where there is insufficient information to facilitate rating. However, it is not to be considered as unfavourable.
This score serves as a reference to assess
SC’s credit risk and to set the amount of credit to be extended. It is
calculated from a composite of weighted scores obtained from each of the major
sections of this report. The assessed factors are as follows:
·
Financial
condition covering various ratios
·
Company
background and operations size
·
Promoters
/ Management background
·
Payment
record
·
Litigation
against the subject
·
Industry
scenario / competitor analysis
·
Supplier
/ Customer / Banker review (wherever available)
This report is issued at
your request without any risk and responsibility on the part of MIRA INFORM
PRIVATE LIMITED (MIPL) or its officials.