|
|
|


MIRA INFORM REPORT
|
Report No. : |
515072 |
|
Report Date : |
22.06.2018 |
IDENTIFICATION DETAILS
|
Name : |
INTERMAS NETS SA. |
|
|
|
|
Registered Office : |
Calle Collsabadell 11 ( Pol. Ind. Collsabadell ) - Llinars Del Valles -
08450 - Barcelona |
|
|
|
|
Country : |
Spain |
|
|
|
|
Financials (as on) : |
2016 |
|
|
|
|
Date of Incorporation : |
14.02.1996 |
|
|
|
|
Legal Form : |
Public company |
|
|
|
|
Line of Business : |
Manufacture of plastic packing goods |
|
|
|
|
No. of Employees : |
275 [2017] |
RATING & COMMENTS
(Mira Inform has adopted New Rating mechanism w.e.f. 23rd
January 2017)
|
MIRA’s Rating : |
A+ |
|
Credit Rating |
Explanation |
Rating Comments |
|
A+ |
Low Risk |
Business dealings permissible with low
risk of default |
|
Status : |
Good |
|
|
|
|
Payment Behaviour : |
No Complaints |
|
|
|
|
Litigation : |
Clear |
NOTES :
Any query related to this report can be made
on e-mail : infodept@mirainform.com
while quoting report number, name and date.
ECGC Country Risk Classification List
|
Country Name |
Previous Rating (31.12.2017) |
Current Rating (01.04.2018) |
|
Spain |
A1 |
A1 |
|
Risk Category |
ECGC
Classification |
|
Insignificant |
A1 |
|
Low Risk |
A2 |
|
Moderately Low Risk |
B1 |
|
Moderate Risk |
B2 |
|
Moderately High Risk |
C1 |
|
High Risk |
C2 |
|
Very High Risk |
D |
SPAIN - ECONOMIC OVERVIEW
After a prolonged recession that began in 2008 in the wake of the global financial crisis, Spain marked the fourth full year of positive economic growth in 2017, with economic activity surpassing its pre-crisis peak, largely because of increased private consumption. The financial crisis of 2008 broke 16 consecutive years of economic growth for Spain, leading to an economic contraction that lasted until late 2013. In that year, the government successfully shored up its struggling banking sector - heavily exposed to the collapse of Spain’s real estate boom - with the help of an EU-funded restructuring and recapitalization program.
Until 2014, contraction in bank lending, fiscal austerity, and high unemployment constrained domestic consumption and investment. The unemployment rate rose from a low of about 8% in 2007 to more than 26% in 2013, but labor reforms prompted a modest reduction to 16.4% in 2017. High unemployment strained Spain's public finances, as spending on social benefits increased while tax revenues fell. Spain’s budget deficit peaked at 11.4% of GDP in 2010, but Spain gradually reduced the deficit to about 3.3% of GDP in 2017. Public debt has increased substantially – from 60.1% of GDP in 2010 to nearly 96.7% in 2017.
Strong export growth helped bring Spain's current account into surplus in 2013 for the first time since 1986 and sustain Spain’s economic growth. Increasing labor productivity and an internal devaluation resulting from moderating labor costs and lower inflation have improved Spain’s export competitiveness and generated foreign investor interest in the economy, restoring FDI flows.
In 2017, the Spanish Government’s minority status constrained its ability to implement controversial labor, pension, health care, tax, and education reforms. The European Commission expects the government to meet its 2017 budget deficit target and anticipates that expected economic growth in 2018 will help the government meet its deficit target. Spain’s borrowing costs are dramatically lower since their peak in mid-2012, and increased economic activity has generated a modest level of inflation, at 2% in 2017.
|
Source : CIA |
EXECUTIVE
SUMMARY
|
|
|
|
|
|
Name: |
INTERMAS
NETS SA. |
|
NIF
/ Fiscal code: |
A61056099 |
|
Trade
Name |
INTERMAS
NETS SA |
|
Status: |
ACTIVE |
|
Incorporation
Date: |
14/02/1996 |
|
Register Data |
Register
Section 8 Sheet 144036 |
|
Last Publication in BORME: |
16/02/2018
[Revocations] |
|
Last
Published Account Deposit: |
2016 |
|
Share
Capital: |
845.727,20 |
|
|
|
|
Localization: |
CALLE
COLLSABADELL 11 ( POL. IND. COLLSABADELL ) - LLINARS DEL VALLES - 08450 -
BARCELONA |
|
Telephone - Fax - Email - Website: |
Telephone.
938 425 700 Email. info@intermas.com Website. www.intermas.com |
|
|
|
|
Activity: |
|
|
NACE: |
2222
- Manufacture of plastic packing goods |
|
Registered
Trademarks: |
|
|
Audited
/ Opinion: |
Si
/ |
|
Tenders
and Awards: |
|
|
Subsidies: |
0
for a total cost of 0 |
|
Quality
Certificate: |
No |
|
|
|
|
Payment
Behaviour: |
No
complaints |
|
Prospects: |
Consolidation |
|
Industry
situation: |
Maturity |
|
|
|
|
Defaults, Legal Claims and
Insolvency Proceedings : |
|
|
|
|
|
|
|
Number |
Amount
(€) |
Most
Recent Entry |
|
Insolvency
Proceedings, Bankruptcy and Suspension of Payments |
|
Unpublished |
--- |
--- |
|
Defaults
on debt with Financial Institutions and Large Companies |
|
None |
--- |
--- |
|
Judicial
Claims (Notices, Executive Proceedings, Attachments, Auctions, Bad Debt) |
|
None |
0 |
--- |
|
Proceedings
heard by the Civil Court |
|
Unpublished |
0 |
--- |
|
Proceedings
heard by the Labour Court |
|
1 |
0 |
--- |
|
|
|
Partners: |
|
|
|
ACCIONES
PROPIAS DE INTERMAS NETS, S.A. |
24.01
% |
|
|
NEW
PLUS 3 SL |
58.51
% |
|
|
OTROS
ACCIONISTAS DE INTERMAS NETS, S.A. |
4.65
% |
|
|
PALESTRINS
SL |
12.83
% |
|
|
BESICART
SL |
|
|
|
GREENVEST
SL |
|
|
|
PALESTRINS
SL |
|
|
|
NEW
PLUS 3 SL |
|
|
|
Shares: |
13 |
|
|
Other
Links: |
14 |
|
|
No.
of Active Corporate Bodies: |
SINGLE
ADMINISTRATOR 1 |
|
|
Ratios |
2016 |
2015 |
Change |
|
|
|
|
|
Guarantees: |
|
|
Properties
Registered: |
Company
NO, Administrator NO |
|
Financing
/ Guarantee Sources : |
Sources
YES, Guarantees YES |
|
|
|
|
|
|
|
INVESTIGATION
SUMMARY |
|
|
The
company was incorporated in 1996, which currently has a shareholder equity that
amounts to Euro 845,727 It is engaged in the manufacture of plastic products. |
|
|
Interviewed
Person: |
|
|
|
|
|
Enquiry Details |
|
|
|
|
|
Identification
|
|
|
Social Denomination: |
INTERMAS NETS SA. |
|
Trade Name: |
INTERMAS NETS SA |
|
NIF / Fiscal code: |
A61056099 |
|
Corporate Status: |
ACTIVE |
|
Start of activity: |
1996 |
|
Registered Office: |
CALLE COLLSABADELL 11 (
POL. IND. COLLSABADELL ) |
|
Locality: |
LLINARS DEL VALLES |
|
Province: |
BARCELONA |
|
Postal Code: |
08450 |
|
Telephone: |
938 425 700 |
|
Fax: |
938 425 701 |
|
Website: |
www.intermas.com |
|
Email: |
info@intermas.com |
|
Interviewed Person: |
Administración (Srta
Maite). |
|
|
|
|
Branch Offices |
|
|
|
|
|
|
|
|
Activity
|
|
|
NACE: |
2222 |
|
Corporate Purpose: |
The company is engaged in
the manufacture, marketing, distribution and sale of plastic transformation
by injection, blowing and extrusion. It is also engaged in the manufacture of
machinery inherent to the transformation of plastic, marketing, distribution
and sale of packaging, construction, gardening and agricultural products. |
|
Additional Information: |
It is leader in the
manufacture and trade of extruded plastic meshes for different sectors. |
|
Additional Address: |
The Registered Office and
premises are located at the heading address, with a large area. |
|
Franchise: |
No |
|
Import / export: |
EXPORTS |
|
Future Perspective: |
Consolidation |
|
Industry situation: |
Maturity |
|
|
|
|
Number
of Employees
|
|
|
|
|
|
|
Year |
No. of employees |
Established |
Incidentals |
|
|
|
2017 |
275 |
|
|
|
The data of employees is from the latest available financial statements. Failing that, are estimates data calculated by statistical methods
|
Chronological
Summary
|
|||
|
|
|
|
|
|
|
Year |
Act |
|
|
|
1996 |
Appointments/ Re-elections (1) Company Formation (1) Other Concepts/
Events (1) |
|
|
|
1997 |
Accounts deposit (year 1996) Appointments/ Re-elections (7)
Cessations/ Resignations/ Reversals (2) Change of Social Denomination (2)
Change of Social Purpose (1) Change of Social address (1) Company Transformation
(1) Increase of Capital (2) Loss of the sole propietorship condition (1)
Other Concepts/ Events (2) Take-over Merger (5) |
|
|
|
1998 |
Accounts deposit (year 1997) Appointments/ Re-elections (2)
Cessations/ Resignations/ Reversals (1) Statutory Modifications (1) |
|
|
|
1999 |
Accounts deposit (year 1998) Appointments/ Re-elections (2)
Cessations/ Resignations/ Reversals (1) |
|
|
|
2000 |
Accounts deposit (year 1999) Appointments/ Re-elections (4)
Cessations/ Resignations/ Reversals (4) Change of Social address (1) Increase
of Capital (1) Other Concepts/ Events (1) Statutory Modifications (1)
Take-over Merger (5) |
|
|
|
2001 |
Accounts deposit (year 2000) Appointments/ Re-elections (3) Increase
of Capital (1) |
|
|
|
2002 |
Accounts deposit (year 2000 consolidated, 2001 consolidated, 2001)
Appointments/ Re-elections (6) Cessations/ Resignations/ Reversals (3) |
|
|
|
2003 |
Accounts deposit (year 2002 consolidated, 2002) Appointments/
Re-elections (5) Cessations/ Resignations/ Reversals (3) Statutory
Modifications (1) |
|
|
|
2004 |
Accounts deposit (year 2003 consolidated, 2003) Appointments/ Re-elections
(2) Board Meeting (1) |
|
|
|
2005 |
Accounts deposit (year 2004 consolidated, 2004) Appointments/
Re-elections (4) Cessations/ Resignations/ Reversals (1) Increase of Capital
(1) Statutory Modifications (1) |
|
|
|
2006 |
Accounts deposit (year 2005 consolidated, 2005) Appointments/
Re-elections (3) Cessations/ Resignations/ Reversals (2) |
|
|
|
2007 |
Accounts deposit (year 2006 consolidated, 2006) Appointments/ Re-elections
(4) Cessations/ Resignations/ Reversals (3) Increase of Capital (1) |
|
|
|
2008 |
Accounts deposit (year 2007 consolidated, 2007) Appointments/
Re-elections (4) Cessations/ Resignations/ Reversals (2) |
|
|
|
2009 |
Accounts deposit (year 2008 consolidated, 2008) Appointments/
Re-elections (4) Cessations/ Resignations/ Reversals (4) Change of Social
Purpose (1) Statutory Modifications (1) Take-over Merger (5) |
|
|
|
2010 |
Accounts deposit (year 2009 consolidated, 2009) Appointments/
Re-elections (5) Cessations/ Resignations/ Reversals (2) |
|
|
|
2011 |
Accounts deposit (year 2010 consolidated, 2010) Appointments/
Re-elections (2) |
|
|
|
2012 |
Accounts deposit (year 2011 consolidated, 2011) Appointments/
Re-elections (3) Cessations/ Resignations/ Reversals (2) Other Concepts/
Events (1) Statutory Modifications (1) |
|
|
|
2013 |
Accounts deposit (year 2012 consolidated, 2012) Appointments/
Re-elections (2) Board Meeting (1) Cessations/ Resignations/ Reversals (1)
Statutory Modifications (1) |
|
|
|
2014 |
Accounts deposit (year 2013 consolidated, 2013) Appointments/ Re-elections
(3) Cessations/ Resignations/ Reversals (3) |
|
|
|
2015 |
Accounts deposit (year 2014 consolidated, 2014) Appointments/
Re-elections (3) |
|
|
|
2016 |
Accounts deposit (year 2015 consolidated, 2015) Appointments/ Re-elections
(2) Cessations/ Resignations/ Reversals (1) |
|
|
|
2017 |
Accounts deposit (year 2016 consolidated, 2016) Appointments/
Re-elections (6) Cessations/ Resignations/ Reversals (5) Statutory
Modifications (2) |
|
|
|
2018 |
Cessations/ Resignations/ Reversals (1) Other Concepts/ Events (1)
Statutory Modifications (1) |
|
|
|
|
|
|
|
Main
Historic Changes
|
|||
|
|
|
|
|
|
Concept |
Publication |
Act |
Date |
|
Corporate Purpose Changes: |
LA FABRICACION, COMERCIALIZACION, DISTRIBUCION Y VENTA DE
TRANSFORMADOS PLASTICOS POR INYECCION, SOPLADO Y EXTRUSION, FABRICACION DE
MAQUINARIA INHERENTE A LA TRANSFORMACION DE MATERIA PLASTICA Y FACILITAR EL
USO DE LOS PR... |
Corporate Purpose Change |
21/03/1997 |
|
|
LA COMPRA,VENTA,ALQUILER,PARCELACION Y URBANIZACION DE
SOLARES,TERRENOS,Y FIONCAS DE CUALQUIER NATURALEZA PUDIENDO PROCEDER A LA
EDIFICACION DE LOS MISMOS INTEGRAMENTE,EN FORMA PARCIAL,ETC. |
Company Formation |
15/04/1996 |
|
|
|
|
|
|
Breakdown
of Owners' Equity
|
|
|
Registered Capital: |
845.727,20 |
|
Paid up capital: |
845.727,20 |
|
|
|
|
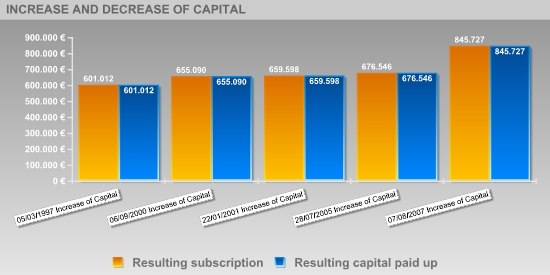
Updated Evolution of the Subscribed and Paid-in Capital |
|||||
|
|
|
|
|
|
|
|
|
|||||
|
|
|
|
|
|
|
|
Publishing Date |
Registration Type |
Capital Subscribed |
Paid up capital |
Underwritten result |
Disbursed Result |
|
19/03/1996 |
Company Formation |
3.005 |
3.005 |
3.005 |
3.005 |
|
05/03/1997 |
Increase of Capital |
57.096 |
57.096 |
60.101 |
60.101 |
|
05/03/1997 |
Increase of Capital |
540.911 |
540.911 |
601.012 |
601.012 |
|
06/09/2000 |
Increase of Capital |
54.090 |
54.090 |
655.090 |
655.090 |
|
22/01/2001 |
Increase of Capital |
4.508 |
4.508 |
659.598 |
659.598 |
|
28/07/2005 |
Increase of Capital |
16.948 |
16.948 |
676.546 |
676.546 |
|
07/08/2007 |
Increase of Capital |
169.182 |
169.182 |
845.727 |
845.727 |
|
|
|
|
|
|
|
|
Founding
Partners
|
|
|
|
|
|
|
Partner Name |
NIF |
% Shareholding stake |
|
|
|
NEW PLUS 3 SL |
B62026869 |
58 |
|
|
|
PALESTRINS SL |
B62026877 |
13 |
|
|
|
BESICART SL |
B63663710 |
|
|
|
|
OTROS ACCIONISTAS |
|
5 |
|
|
|
|
|
|
|
|
Active
Social Bodies
|
|
|
|
|
|
Post published |
Social Body's Name |
Appointment Date |
Other Positions in this Company |
|
SINGLE ADMINISTRATOR |
NEW PLUS 3 SL |
05/12/2017 |
8 |
|
JOINT ATTORNEY |
MORENO PELETEIRO OSCAR |
16/03/2017 |
1 |
|
JOINT ATTORNEY/COMBINED PROXY |
LOPETEGUI LARRUSCAIN JOSE MARIA |
27/10/2015 |
3 |
|
PROXY |
SERRA JUBAL JOSE |
21/10/2010 |
4 |
|
REPRESENTATIVE |
FRANCOIS MOUCHET |
05/12/2017 |
10 |
|
|
BESAS ICART NATALIA |
28/08/2008 |
3 |
|
ACCOUNTS' AUDITOR / HOLDER |
PRICEWATERHOUSECOOPERS AUDITORES SL |
07/08/2017 |
8 |
|
CONSOLIDATED ACCOUNTS' AUDITOR |
PRICEWATERHOUSECOOPERS AUDITORES SL |
07/08/2017 |
8 |
|
|
|
|
|
|
Historical
Social Bodies
|
|
|
|
|
|
Social Body's Name |
Post published |
End Date |
Other Positions in this Company |
|
3I IBERICA DE INVERSIONES INDUSTRIALES SA |
MEMBER OF THE BOARD |
04/04/2002 |
2 |
|
|
MEMBER OF THE BOARD |
20/02/2003 |
|
|
ADELL RAMON RAMON |
REPRESENTATIVE |
30/04/2009 |
2 |
|
|
REPRESENTATIVE |
05/12/2017 |
|
|
ALBERT FORT MAURI |
REPRESENTATIVE |
17/02/2006 |
1 |
|
AURICA XXI SCR DE REGIMEN SIMPLIFICADO SA |
MEMBER OF THE BOARD |
24/04/2013 |
4 |
|
|
MEMBER OF THE BOARD |
24/04/2013 |
|
|
|
MEMBER OF THE BOARD |
12/07/2017 |
|
|
|
JOINT ATTORNEY |
12/07/2017 |
|
|
AYAS CARRETERO MARCO ANTONIO |
PROXY |
02/03/2007 |
1 |
|
BANUS NOGUE MIGUEL |
MEMBER OF THE BOARD |
04/04/2002 |
4 |
|
|
MEMBER OF THE BOARD |
20/02/2003 |
|
|
|
MEMBER OF THE BOARD |
09/03/2005 |
|
|
|
CHIEF EXECUTIVE OFFICER |
09/03/2005 |
|
|
BANUS NOGUE MIQUEL |
REPRESENTATIVE |
05/12/2017 |
1 |
|
BESAS CAMPS LLUIS |
MEMBER OF THE BOARD |
09/03/2005 |
8 |
|
|
MEMBER OF THE BOARD |
07/08/2007 |
|
|
|
PROXY |
06/06/2003 |
|
|
|
PROXY |
23/03/2016 |
|
|
|
REPRESENTATIVE |
09/03/2000 |
|
|
|
REPRESENTATIVE |
20/02/2003 |
|
|
|
REPRESENTATIVE |
10/10/2007 |
|
|
|
PRESIDENT |
09/03/2005 |
|
|
BESAS CAMPS LUIS |
MEMBER OF THE BOARD |
14/12/1998 |
1 |
|
BESAS ICART NATALIA |
MEMBER OF THE BOARD |
05/12/2017 |
3 |
|
|
REPRESENTATIVE |
28/08/2008 |
|
|
BESICART SL |
MEMBER OF THE BOARD |
18/06/2010 |
8 |
|
|
MEMBER OF THE BOARD |
12/07/2017 |
|
|
|
MEMBER OF THE BOARD |
12/07/2017 |
|
|
|
MEMBER OF THE BOARD |
05/12/2017 |
|
|
|
JOINT ATTORNEY |
12/07/2017 |
|
|
|
CHIEF EXECUTIVE OFFICER |
28/08/2008 |
|
|
|
PRESIDENT |
12/07/2017 |
|
|
|
PRESIDENT |
05/12/2017 |
|
|
CECILE MARGUERITE SUZANNE DEIXONNE |
JOINT ATTORNEY |
22/08/2017 |
1 |
|
CLAVELL CAMP ANTONI |
MEMBER OF THE BOARD |
04/04/2002 |
8 |
|
|
MEMBER OF THE BOARD |
20/02/2003 |
|
|
|
MEMBER OF THE BOARD |
09/03/2005 |
|
|
|
PROXY |
10/10/1997 |
|
|
|
PROXY |
21/10/2010 |
|
|
|
PROXY |
23/03/2016 |
|
|
|
REPRESENTATIVE |
09/03/2005 |
|
|
|
SECRETARY |
05/03/1997 |
|
|
CLAVELL CAMP ANTONIO |
PROXY |
23/03/2016 |
2 |
|
|
REPRESENTATIVE |
05/12/2017 |
|
|
CLAVELL CAMPS ANTONI |
PROXY |
19/07/2006 |
1 |
|
COOPERS AND LYBRAND SA |
ACCOUNTS' AUDITOR / HOLDER |
09/03/2000 |
1 |
|
CP 4 MONTELLS SL |
MEMBER OF THE BOARD |
05/12/2017 |
3 |
|
|
JOINT ATTORNEY |
05/12/2017 |
|
|
|
MEMBER OF THE BOARD |
16/04/2014 |
|
|
FANYTAS BIPB SL |
MEMBER OF THE BOARD |
16/04/2014 |
3 |
|
|
MEMBER OF THE BOARD |
05/12/2017 |
|
|
|
JOINT ATTORNEY |
05/12/2017 |
|
|
FORNESA REBES TOMAS |
REPRESENTATIVE |
28/08/2008 |
2 |
|
|
NON CONSELLOR ASSISTANT SECRETARY |
07/11/2000 |
|
|
FORT FERRE JACINTO |
PROXY |
10/10/1997 |
3 |
|
|
PROXY |
23/06/2000 |
|
|
|
REPRESENTATIVE |
14/12/1998 |
|
|
FORT FERRER JACINT |
MEMBER OF THE BOARD |
23/06/2000 |
1 |
|
FORT MARAI ALBERT |
MEMBER OF THE BOARD |
05/12/2017 |
1 |
|
FORT MAURI ALBERT |
MEMBER OF THE BOARD |
28/07/2003 |
5 |
|
|
PROXY |
23/03/2016 |
|
|
|
REPRESENTATIVE |
28/07/2003 |
|
|
|
REPRESENTATIVE |
09/03/2005 |
|
|
|
REPRESENTATIVE |
20/03/2009 |
|
|
FORTUNY MONTALT MONTSERRAT |
PROXY |
23/03/2016 |
1 |
|
FRANCOIS MOUCHET |
REPRESENTATIVE |
05/12/2017 |
10 |
|
|
CHIEF EXECUTIVE OFFICER |
05/12/2017 |
|
|
|
JOINT ATTORNEY |
05/12/2017 |
|
|
|
MEMBER OF THE BOARD |
05/12/2017 |
|
|
|
JOINT ATTORNEY |
08/02/2018 |
|
|
|
MEMBER OF THE BOARD |
12/04/2012 |
|
|
|
JOINT ATTORNEY |
16/04/2014 |
|
|
|
REPRESENTATIVE |
12/07/2017 |
|
|
|
REPRESENTATIVE |
12/07/2017 |
|
|
GALLO MARTINEZ PABLO |
REPRESENTATIVE |
15/10/2002 |
1 |
|
GIRBAU PEDRAGOSA RAMON |
NON CONSELLOR SECRETARY |
05/12/2017 |
1 |
|
GREENVEST SL |
MEMBER OF THE BOARD |
09/03/2005 |
6 |
|
|
MEMBER OF THE BOARD |
18/06/2010 |
|
|
|
MEMBER OF THE BOARD |
12/07/2017 |
|
|
|
MEMBER OF THE BOARD |
12/07/2017 |
|
|
|
MEMBER OF THE BOARD |
05/12/2017 |
|
|
|
JOINT ATTORNEY |
12/07/2017 |
|
|
GUINDOLA ASESORES SL |
MEMBER OF THE BOARD |
16/04/2014 |
1 |
|
GUINDOLA CONSULTORES SA |
CHIEF EXECUTIVE OFFICER |
09/03/2000 |
2 |
|
|
PRESIDENT |
09/03/2000 |
|
|
GUINDOLA CONSULTORES SL |
MEMBER OF THE BOARD |
09/03/2000 |
2 |
|
|
CHIEF EXECUTIVE OFFICER |
05/12/2017 |
|
|
GUINDOLA GESTION SL |
MEMBER OF THE BOARD |
04/04/2002 |
5 |
|
|
MEMBER OF THE BOARD |
20/02/2003 |
|
|
|
CHIEF EXECUTIVE OFFICER |
04/04/2002 |
|
|
|
CHIEF EXECUTIVE OFFICER |
20/02/2003 |
|
|
|
PRESIDENT |
20/02/2003 |
|
|
LOPETEGUI LARRUSCAIN JOSE MARIA |
PROXY |
06/07/2015 |
3 |
|
|
COMBINED PROXY |
27/10/2015 |
|
|
LOPEZ PALOMINO MARIA DEL CARMEN |
ADMINISTRATOR |
05/03/1997 |
1 |
|
MALLAS CARDEDEU SL |
SINGLE PARTNER |
06/09/2000 |
1 |
|
MASIA MARTI LORENA |
NON CONSELLOR ASSISTANT SECRETARY |
14/02/2002 |
1 |
|
MUÑOZ GUTIERREZ LAURA |
NON CONSELLOR ASSISTANT SECRETARY |
05/12/2017 |
1 |
|
NEW PLUS 3 |
CHIEF EXECUTIVE OFFICER |
20/02/2003 |
1 |
|
NEW PLUS 3 SL |
MEMBER OF THE BOARD |
04/04/2002 |
8 |
|
|
MEMBER OF THE BOARD |
20/02/2003 |
|
|
|
MEMBER OF THE BOARD |
09/03/2005 |
|
|
|
MEMBER OF THE BOARD |
30/04/2009 |
|
|
|
CHIEF EXECUTIVE OFFICER |
04/04/2002 |
|
|
|
CHIEF EXECUTIVE OFFICER |
20/02/2003 |
|
|
|
CHIEF EXECUTIVE OFFICER |
09/03/2005 |
|
|
NEW PLUS SL |
MEMBER OF THE BOARD |
09/03/2000 |
2 |
|
|
CHIEF EXECUTIVE OFFICER |
09/03/2000 |
|
|
OYA LOPEZ JOSE FRANCISCO |
PROXY |
23/03/2016 |
1 |
|
PALAY CABALLE EMILIO |
PROXY |
28/01/2014 |
2 |
|
|
REPRESENTATIVE |
30/04/2009 |
|
|
PALESTRINS SL |
MEMBER OF THE BOARD |
04/04/2002 |
4 |
|
|
MEMBER OF THE BOARD |
20/02/2003 |
|
|
|
MEMBER OF THE BOARD |
09/03/2005 |
|
|
|
MEMBER OF THE BOARD |
30/04/2009 |
|
|
PERALTA PECURUL JOSE |
PROXY |
15/06/2010 |
1 |
|
PERALTA PECURUL JOSE LUIS |
MEMBER OF THE BOARD |
30/04/2009 |
1 |
|
PLA VILA AGUSTIN |
REPRESENTATIVE |
30/04/1999 |
2 |
|
|
REPRESENTATIVE |
20/02/2003 |
|
|
PRICE WATERHOUSE COOPERS AUDITORES S L |
ACCOUNTS' AUDITOR / HOLDER |
19/10/2007 |
2 |
|
|
CONSOLIDATED ACCOUNTS' AUDITOR |
19/10/2007 |
|
|
PRICE WATERHOUSE COOPERS AUDITORES SL |
ACCOUNTS' AUDITOR / HOLDER |
26/06/2001 |
26 |
|
|
ACCOUNTS' AUDITOR / HOLDER |
25/07/2002 |
|
|
|
ACCOUNTS' AUDITOR / HOLDER |
31/07/2003 |
|
|
|
ACCOUNTS' AUDITOR / HOLDER |
20/07/2004 |
|
|
|
ACCOUNTS' AUDITOR / HOLDER |
30/01/2006 |
|
|
|
ACCOUNTS' AUDITOR / HOLDER |
19/07/2006 |
|
|
|
ACCOUNTS' AUDITOR / HOLDER |
29/09/2008 |
|
|
|
ACCOUNTS' AUDITOR / HOLDER |
04/08/2009 |
|
|
|
ACCOUNTS' AUDITOR / HOLDER |
30/06/2010 |
|
|
|
ACCOUNTS' AUDITOR / HOLDER |
04/07/2011 |
|
|
|
ACCOUNTS' AUDITOR / HOLDER |
20/12/2012 |
|
|
|
ACCOUNTS' AUDITOR / HOLDER |
03/10/2013 |
|
|
|
ACCOUNTS' AUDITOR / HOLDER |
31/07/2014 |
|
|
|
CONSOLIDATED ACCOUNTS' AUDITOR |
29/10/2001 |
|
|
|
CONSOLIDATED ACCOUNTS' AUDITOR |
25/07/2002 |
|
|
|
CONSOLIDATED ACCOUNTS' AUDITOR |
31/07/2003 |
|
|
|
CONSOLIDATED ACCOUNTS' AUDITOR |
20/07/2004 |
|
|
|
CONSOLIDATED ACCOUNTS' AUDITOR |
30/01/2006 |
|
|
|
CONSOLIDATED ACCOUNTS' AUDITOR |
19/07/2006 |
|
|
|
CONSOLIDATED ACCOUNTS' AUDITOR |
29/09/2008 |
|
|
|
CONSOLIDATED ACCOUNTS' AUDITOR |
04/08/2009 |
|
|
|
CONSOLIDATED ACCOUNTS' AUDITOR |
30/06/2010 |
|
|
|
CONSOLIDATED ACCOUNTS' AUDITOR |
04/07/2011 |
|
|
|
CONSOLIDATED ACCOUNTS' AUDITOR |
20/12/2012 |
|
|
|
CONSOLIDATED ACCOUNTS' AUDITOR |
03/10/2013 |
|
|
|
CONSOLIDATED ACCOUNTS' AUDITOR |
31/07/2014 |
|
|
PRICE WATERHOUSE COOPERS SL |
ACCOUNTS' AUDITOR / HOLDER |
10/03/2001 |
1 |
|
PRICEWATERHOUSECOOPERS AUDITORES SL |
ACCOUNTS' AUDITOR / HOLDER |
28/06/2016 |
8 |
|
|
CONSOLIDATED ACCOUNTS' AUDITOR |
28/06/2016 |
|
|
|
ACCOUNTS' AUDITOR / HOLDER |
07/08/2017 |
|
|
|
CONSOLIDATED ACCOUNTS' AUDITOR |
07/08/2017 |
|
|
|
ACCOUNTS' AUDITOR / HOLDER |
10/11/2015 |
|
|
|
CONSOLIDATED ACCOUNTS' AUDITOR |
10/11/2015 |
|
|
RAMON ADELL RAMON |
REPRESENTATIVE |
12/07/2017 |
1 |
|
RODRIGUEZ SABATER RAUL |
REPRESENTATIVE |
12/07/2017 |
1 |
|
SALINAS PEÑA CARLOS |
NON CONSELLOR ASSISTANT SECRETARY |
12/07/2017 |
1 |
|
SANCHEZ CAMARA ALBA ANTONIO |
PROXY |
10/10/1997 |
6 |
|
|
PROXY |
23/03/2016 |
|
|
|
REPRESENTATIVE |
09/03/2000 |
|
|
|
REPRESENTATIVE |
20/02/2003 |
|
|
|
REPRESENTATIVE |
29/03/2012 |
|
|
|
REPRESENTATIVE |
16/04/2014 |
|
|
SERRA JUBAL JOSE |
PROXY |
10/10/1997 |
4 |
|
|
PROXY |
02/07/1998 |
|
|
|
PROXY |
21/10/2010 |
|
|
TORRES RIBAS JOSEP |
MEMBER OF THE BOARD |
18/06/2010 |
5 |
|
|
MEMBER OF THE BOARD |
16/04/2014 |
|
|
|
CHIEF EXECUTIVE OFFICER |
16/04/2014 |
|
|
|
CHIEF EXECUTIVE OFFICER |
18/06/2010 |
|
|
|
CHIEF EXECUTIVE OFFICER |
16/04/2014 |
|
|
VENTURA SANTAMANS CARLOS |
REPRESENTATIVE |
21/04/2009 |
1 |
|
|
|
|
|
|
Executive
board
|
||
|
|
|
|
|
Post |
NIF |
Name |
|
COMPUTER SCIENCE DIRECTOR |
|
NURIA MOLGO |
|
ADMINISTRADOR UNICO |
B62026869 |
NEW PLUS 3 SL |
|
APODERADO SOLIDARIO |
|
OSCAR MORENO PELETEIRO |
|
APODERADO SOLIDARIO |
|
JOSE MARÍA LOPETEGUI LARRUSCAIN |
|
APODERADO SOLIDARIO |
|
JOSEP SERRA JUBAL |
|
|
|
|
|
Defaults, Legal Claims and Insolvency Proceedings |
|
|
|
|
Section enabling assessment of the degree of compliance of the company queried
with its payment obligations. It provides information on the existence and
nature of all stages of Insolvency and Legal Proceedings published with
reference to the Company in the country's various Official Bulletins and
national newspapers, as well Defaults Registered in the main national credit
bureaus (ASNEF Industrial and RAI ).
Chronological
summary
|
|
|
Number
of Publications |
Amount
(€) |
Start
date |
End
date |
|
Insolvency
Proceedings, Bankruptcy and Suspension of Payments |
|
Unpublished |
--- |
--- |
--- |
|
Request/Declaration |
|
0 |
--- |
date |
|
|
Proceedings |
|
--- |
--- |
|
--- |
|
Resolution |
|
--- |
--- |
|
--- |
|
Defaults
on debt with Financial Institutions and Large Companies |
Bank
and Commercial Delinquency |
None |
0 |
|
|
|
Status:
Friendly |
|
--- |
|
|
|
|
Status:
Pre-Litigation |
|
--- |
|
|
|
|
Status:
Litigation |
|
--- |
|
|
|
|
Status:
Non-performing |
|
--- |
|
|
|
|
Status:
insolvency proceedings, bankruptcy and suspension of payments |
|
--- |
|
|
|
|
Other
status |
|
--- |
|
|
|
|
Legal
and Administrative Proceedings |
|
Unpublished |
--- |
|
|
|
Notices
of defaults and enforcement |
|
--- |
--- |
|
--- |
|
Seizures |
|
--- |
--- |
|
--- |
|
Auctions |
|
--- |
--- |
|
--- |
|
Declarations
of insolvency and bad debt |
|
--- |
--- |
|
--- |
|
Proceedings
heard by the Civil Court |
|
Unpublished |
--- |
|
|
|
Proceedings
heard by the Labour Court |
|
1 |
--- |
02/03/2018 |
02/03/2018 |
Basis
for scoring
|
Positive Factors |
Adverse Factors |
|
No irregular payment performance has been detected based on
information obtained from credit bureaus. At domestic level, it is one of the companies with high turnover
volume. INTERMAS NETS SA. 's borrowing cost is appropriate according to its
volume of external financing sources. Significant operating income. The Company has the necessary return on
the investments for its main activity in comparison with its assets. This
return is higher than that of the financial year 2015 which means that the
company's financial situation has improved. It presents a efficient productivity. EBITDA shows adequate company costs
management as income exceed operating expenses. |
INTERMAS NETS SA. has a tight level of Financial Autonomy. The
Internal Funds of the entity represent the 22.74% of the total amount of
funding sources. |
|
TREND
OF SCORING
|
|
|
|
|
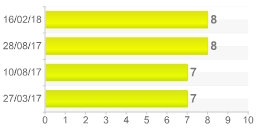
> Latest Scoring Changes
:
|
Scoring |
Evolution |
Date |
Event |
|
|
Neutral |
16/02/18 |
Update
of relevant information about Social Bodies |
|
Positive |
28/08/17 |
Updating
of financial statements. |
|
|
Neutral |
10/08/17 |
Revision
of the scoring due to modifications in activity consideration |
|
|
Neutral |
27/03/17 |
Updating
of relevant commercial information. |
Probability
of default
|
> Estimated Probability of Default for the next 12 months: 0.490 %
|
Sector in which comparison is carried out: 222 Manufacture of plastics products |
|
|
Relative Position:
|
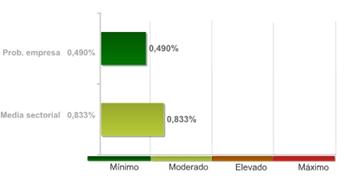
The company's comparative analysis with the rest of the companies that comprise the sector, shows the company holds a better position with regard to the probability of non-compliance.
The 99.00% of the companies of the sector INTERMAS NETS SA. belongs to show a higher probability of non-compliance.
The probability of the company's non-compliance with its payment obligations within deadlines estimated by our qualifications models is 0,490%.
In the event they fail to comply with the payment, the seriousness of the loss will depend on factors such as the promptness of the commencement of the charging management, the existence of executive documents which match the credit or the existence of guarantees and free debt assets under the name of the debtor. Therefore, the probability of non-compliance should not be solely interpreted as the total loss of the owed amount.
|
Result of query submitted to the
R.A.I. (Spanish Bad Debt Register) on |
|
|
LEGAL
CLAIMS
|
|
Summary
of Judicial Claims |
|
|
|
|
|
|
|
|
||
|
|
|
Not
published |
|
|
|
|
Not
published |
|
|
|
|
||
|
|
|
Not
published |
|
|
|
|
Not
published |
|
|
|
|
Not
published |
|
|
|
|
Not
published |
|
|
|
|
||
|
|
|
Not
published |
|
|
|
|
Not
published |
|
|
|
|
||
|
|
|
1
Incidence the amount of which has not been published |
|
|
Guarantees |
|
References |
|
|
|
|
|
|
Clients |
|
|
|
Name |
NIF |
Telephone |
|
|
|
LEROY MERLIN |
|
|
|
|
|
BRICO DETTO |
|
|
|
|
|
AKIN |
|
|
|
|
|
Suppliers |
|
|
|
Name |
NIF |
Telephone |
|
|
|
REPSOL |
|
|
|
|
|
LK WALTER |
|
|
|
|
|
CDL |
|
|
|
|
Link
List
|
|
ABSORBS TO: |
3 Entities |
|
BELONGS TO THE
ADMINISTRATION BOARD OF: |
2 Entities |
|
HAS IN ITS ADMINISTRATION
BOARD TO: |
1 Entities |
|
IS RELATED WITH: |
8 Entities |
|
PARTICIPATES IN: |
13 Entities |
|
SHAREHOLDERS: |
8 Entities |
> Shareholders
|
Relationship |
Entity |
Province |
Shareholding stake |
|
SHAREHOLDERS |
ACCIONES PROPIAS DE
INTERMAS NETS, S.A. |
|
24.01 |
|
|
NEW PLUS 3 SL |
BARCELONA |
58.51 |
|
|
OTROS ACCIONISTAS DE
INTERMAS NETS, S.A. |
|
4.65 |
|
|
PALESTRINS SL |
BARCELONA |
12.83 |
|
SHAREHOLDERS |
BESICART SL |
BARCELONA |
|
|
|
GREENVEST SL |
BARCELONA |
|
|
|
PALESTRINS SL |
BARCELONA |
|
|
|
NEW PLUS 3 SL |
BARCELONA |
|
|
PARTICIPATES IN |
PROJECTES DIM 3 S.L. |
BARCELONA |
50 |
|
|
NOPLEX ARTES GRAFICAS SL |
VALENCIA |
75.02 |
|
|
CELLOPLAST SAS (FRANCIA) |
|
|
|
|
NORTENE TECHNOLOGIES SAS
(FRANCIA) |
|
|
|
|
INTERMAS EASTERN EUROPE
KFT (HUNGRIA) |
|
100 |
|
|
INTERMAS ITALIA, S.L. |
|
100 |
|
|
INTERMAS POLSKA ZOO (POLONIA) |
|
|
|
|
VISCORET, SOCIEDAD
LIMITADA, (ITALIA) |
|
|
|
|
INTERMAS NETS USA INC
(ESTADOS UNIDOS) |
|
100 |
|
|
TAVERINVER SOCIEDAD
LIMITADA |
VALENCIA |
100 |
|
|
INTERMAS HOLDGING FRANCE
SAS (FRANCIA) |
|
100 |
|
|
INTERMAS NETHERLANDS BV
(HOLANDA) |
|
100 |
|
|
GAVIONES Y MUROS DE
CONTENCION SL |
CANTABRIA |
100 |
> Other relationships
|
Relationship |
Entity |
Province |
Shareholding stake |
|
IS RELATED WITH |
| | |
|
|
|
|
INTERMAS USA INC (ESTADOS
UNIDOS) |
|
|
|
|
CELLOPLAST SAS (FRANCIA) |
|
|
|
|
JARDINS DE NORTENE SAS
(FRANCIA) |
|
|
|
|
NORTENE TECHNOLOGIES SAS
(FRANCIA) |
|
|
|
|
DAUMPLUS SARL (MARRUECOS) |
|
|
|
|
AURICA XXI SOCIEDAD DE CAPITAL
RIESGO DE REGIMEN SIMPLIFICADO SA |
BARCELONA |
20 |
|
|
GUINDOLA ASESORES SL |
MADRID |
|
|
IS RELATED WITH |
DAUMAS SL |
CASTELLON |
50 |
|
ABSORBS TO |
MALLAS CARDEDEU, S.L. |
BARCELONA |
|
|
|
MALLAS AGROTEXTILES SL |
BARCELONA |
|
|
|
SEIFIL PERCAN SL |
BARCELONA |
|
|
HAS IN ITS ADMINISTRATION
BOARD TO |
NEW PLUS 3 SL |
BARCELONA |
|
|
|
INTERMAS NETS RECYCLING SL |
BARCELONA |
|
|
BELONGS TO THE
ADMINISTRATION BOARD OF |
NOPLEX ARTES GRAFICAS SL |
VALENCIA |
|
|
|
|
|
|
|
|
|
|
|
|
Turnover
|
|
|
Total Sales 2016 |
79.523.427 |
The sales data is from the
latest available financial statements. Failing that, are estimates data
calculated by statistical methods.
|
Estimated
Balance
|
|
This is a medium-level company,
whose Volumen of Business increased by 5% in 2016. The Balance Sheet shows a
Liquidity Ratio (2/1) and Treasury (1,4/1), balanced. A low, long-term Trust
Ratio (0,87/1) and a low Total Solvency (1,3/1). |
|
Financial
Accounts and Balance Sheets
|
|
|
|
|
|
Ejercicio |
Tipo
de Cuentas Anuales |
Fecha
Presentacion |
|
2016 |
Consolidadas |
August
2017 |
|
2016 |
Normales |
August
2017 |
|
2015 |
Consolidadas |
November
2016 |
|
2015 |
Normales |
November
2016 |
|
2014 |
Consolidadas |
August
2015 |
|
2014 |
Normales |
August
2015 |
|
2013 |
Consolidadas |
July
2014 |
|
2013 |
Normales |
July
2014 |
|
2012 |
Consolidadas |
August
2013 |
|
2012 |
Normales |
August
2013 |
|
2011 |
Consolidadas |
November
2012 |
|
2011 |
Normales |
July
2012 |
|
2010 |
Consolidadas |
July
2011 |
|
2010 |
Normales |
July
2011 |
|
2009 |
Consolidadas |
July
2010 |
|
2009 |
Normales |
July
2010 |
|
2008 |
Consolidadas |
September
2009 |
|
2008 |
Normales |
August
2009 |
|
2007 |
Consolidadas |
September
2008 |
|
2007 |
Normales |
September
2008 |
|
2006 |
Consolidadas |
July
2007 |
|
2006 |
Normales |
July
2007 |
|
2005 |
Consolidadas |
June
2006 |
|
2005 |
Normales |
June
2006 |
|
2004 |
Consolidadas |
August
2005 |
|
2004 |
Normales |
August
2005 |
|
2003 |
Consolidadas |
July
2004 |
|
2003 |
Normales |
July
2004 |
|
2002 |
Consolidadas |
August
2003 |
|
2002 |
Normales |
August
2003 |
|
2001 |
Consolidadas |
July
2002 |
|
2001 |
Normales |
July
2002 |
|
2000 |
Consolidadas |
December
2001 |
|
2000 |
Normales |
September
2001 |
|
1999 |
Normales |
May
2000 |
|
1998 |
Normales |
July
1999 |
|
1997 |
Normales |
August
1998 |
|
1996 |
Normales |
July
1997 |
The data in the report regarding
the last Company Accounts submitted by the company is taken from the TRADE REGISTER
serving the region in which the company's address is located 31/12/2016
>
Normal format Balance in accordance with the New Accounting Plan 2007
Information
corresponding to the fiscal year
2016 2015 2014 2013 2012 is taken from information
submitted to the TRADE REGISTER. Data corresponding to fiscal years before
2016 2015 2014 2013 2012 has been compiled based on
the equivalence criteria stipulated in Act JUS/206/2009. Where the provisions
of the Act did not establish relevant equivalence criteria. To view details on
the methodology.
|
|
ORIGINAL |
ORIGINAL |
ORIGINAL |
ORIGINAL |
ORIGINAL |
|
|
Assets |
2016 |
2015 |
2014 |
2013 |
2012 |
|
|
A)
NON-CURRENT ASSETS: 11000 |
39.248.042,00 |
35.267.737,00 |
33.630.340,00 |
34.222.527,00 |
34.156.330,00 |
|
|
I. Intangible fixed assets : 11100 |
5.174.632,00 |
5.416.250,00 |
5.553.303,00 |
4.619.134,00 |
4.898.177,00 |
|
|
1. Development: 11110 |
0,00 |
0,00 |
0,00 |
0,00 |
0,00 |
|
|
2. Concessions: 11120 |
0,00 |
0,00 |
0,00 |
0,00 |
0,00 |
|
|
3. Patents, licencing, trade marks and
similar: 11130 |
2.341.605,00 |
2.486.883,00 |
2.632.160,00 |
2.565.475,00 |
2.700.500,00 |
|
|
4. Goodwill: 11140 |
0,00 |
0,00 |
0,00 |
0,00 |
0,00 |
|
|
5. IT applications: 11150 |
1.978.164,00 |
2.156.852,00 |
1.625.753,00 |
1.796.175,00 |
2.158.154,00 |
|
|
6. Investigation: 11160 |
0,00 |
0,00 |
0,00 |
0,00 |
0,00 |
|
|
7. Intellectual property: 11180 |
0,00 |
0,00 |
0,00 |
0,00 |
0,00 |
|
|
8. Greenhouse gas emission allowance:
11190 |
0,00 |
0,00 |
0,00 |
0,00 |
0,00 |
|
|
9. Other intangible fixed assets. :
11170 |
854.863,00 |
772.515,00 |
1.295.390,00 |
257.484,00 |
39.523,00 |
|
|
II. Tangible fixed assets : 11200 |
8.529.640,00 |
7.570.464,00 |
6.063.787,00 |
6.131.464,00 |
6.990.588,00 |
|
|
1. Land and buildings: 11210 |
760.053,00 |
797.148,00 |
834.244,00 |
871.340,00 |
717.867,00 |
|
|
2. Technical installations and other
tangible fixed assets: 11220 |
6.992.896,00 |
4.500.367,00 |
4.847.983,00 |
4.988.712,00 |
5.478.287,00 |
|
|
3. Tangible asset in progress and
advances: 11230 |
776.691,00 |
2.272.949,00 |
381.560,00 |
271.412,00 |
794.434,00 |
|
|
III. Real estate investment: 11300 |
1.301.277,00 |
1.346.793,00 |
1.392.309,00 |
1.437.824,00 |
1.278.000,00 |
|
|
1. Land: 11310 |
330.281,00 |
330.281,00 |
330.281,00 |
330.281,00 |
290.000,00 |
|
|
2. Buildings: 11320 |
970.996,00 |
1.016.512,00 |
1.062.028,00 |
1.107.543,00 |
988.000,00 |
|
|
IV. Long-term investments in Group companies and associates :
11400 |
22.472.160,00 |
18.630.674,00 |
18.614.980,00 |
19.624.868,00 |
19.012.349,00 |
|
|
1. Equity instruments: 11410 |
18.031.491,00 |
17.008.005,00 |
17.067.311,00 |
18.077.199,00 |
16.360.052,00 |
|
|
2. Credits to businesses: 11420 |
4.440.669,00 |
1.622.669,00 |
1.547.669,00 |
1.547.669,00 |
2.652.297,00 |
|
|
3. Debt securities: 11430 |
0,00 |
0,00 |
0,00 |
0,00 |
0,00 |
|
|
4. Derivatives : 11440 |
0,00 |
0,00 |
0,00 |
0,00 |
0,00 |
|
|
5. Other financial assets : 11450 |
0,00 |
0,00 |
0,00 |
0,00 |
0,00 |
|
|
6. Other investments: 11460 |
0,00 |
0,00 |
0,00 |
0,00 |
0,00 |
|
|
V. Long-term financial investments: 11500 |
252.729,00 |
238.292,00 |
138.025,00 |
217.278,00 |
226.778,00 |
|
|
1. Equity instruments: 11510 |
0,00 |
0,00 |
0,00 |
0,00 |
0,00 |
|
|
2. Credits to third parties : 11520 |
0,00 |
0,00 |
0,00 |
0,00 |
0,00 |
|
|
3. Debt securities: 11530 |
361,00 |
361,00 |
361,00 |
361,00 |
361,00 |
|
|
4. Derivatives : 11540 |
0,00 |
0,00 |
0,00 |
0,00 |
0,00 |
|
|
5. Other financial assets : 11550 |
252.368,00 |
237.931,00 |
137.664,00 |
216.917,00 |
226.417,00 |
|
|
6. Other investments: 11560 |
0,00 |
0,00 |
0,00 |
0,00 |
0,00 |
|
|
VII. Non-current trade debts : 11700 |
0,00 |
0,00 |
0,00 |
0,00 |
0,00 |
|
|
VI. Assets for deferred tax : 11600 |
1.517.604,00 |
2.065.264,00 |
1.867.936,00 |
2.191.959,00 |
1.750.438,00 |
|
|
B)
CURRENT ASSETS: 12000 |
52.099.845,00 |
43.907.874,00 |
39.047.280,00 |
38.818.403,00 |
38.788.033,00 |
|
|
I. Non-current assets held for sale : 12100 |
0,00 |
0,00 |
0,00 |
0,00 |
0,00 |
|
|
II. Stocks: 12200 |
14.999.352,00 |
14.631.832,00 |
14.671.824,00 |
13.702.724,00 |
16.013.742,00 |
|
|
1. Commercial: 12210 |
7.948.228,00 |
7.622.826,00 |
6.273.700,00 |
6.269.928,00 |
6.783.783,00 |
|
|
2. Primary material and other supplies:
12220 |
3.243.997,00 |
3.463.002,00 |
3.227.707,00 |
2.638.983,00 |
3.823.780,00 |
|
|
a) Long-term primary
material and other supplies: 12221 |
0,00 |
0,00 |
0,00 |
0,00 |
0,00 |
|
|
b) Short-term primary
material and other supplies: 12222 |
0,00 |
0,00 |
0,00 |
0,00 |
0,00 |
|
|
3. Work in progress: 12230 |
582.028,00 |
413.379,00 |
805.053,00 |
793.731,00 |
0,00 |
|
|
a) Of long-term
production cycle : 12231 |
0,00 |
0,00 |
0,00 |
0,00 |
0,00 |
|
|
b) Of short-term
production cycle : 12232 |
0,00 |
0,00 |
805.053,00 |
793.731,00 |
0,00 |
|
|
4. Finished goods: 12240 |
3.206.542,00 |
3.128.057,00 |
4.359.315,00 |
3.989.307,00 |
5.388.111,00 |
|
|
a) Of long-term
production cycle : 12241 |
0,00 |
0,00 |
0,00 |
0,00 |
0,00 |
|
|
b) Of short-term
production cycle : 12242 |
0,00 |
0,00 |
4.359.315,00 |
3.989.307,00 |
5.388.111,00 |
|
|
5. By-products, residues and recycled
materials: 12250 |
0,00 |
0,00 |
0,00 |
0,00 |
0,00 |
|
|
6. Advances to suppliers: 12260 |
18.557,00 |
4.568,00 |
6.049,00 |
10.775,00 |
18.068,00 |
|
|
III. Trade debtors and others receivable accounts: 12300 |
17.651.952,00 |
21.760.226,00 |
19.021.290,00 |
20.863.723,00 |
21.358.478,00 |
|
|
1. Trade debtors / accounts receivable:
12310 |
12.135.867,00 |
16.011.458,00 |
14.135.657,00 |
16.395.822,00 |
17.138.173,00 |
|
|
a) Long-term
receivables from sales and services supplied : 12311 |
0,00 |
0,00 |
0,00 |
0,00 |
0,00 |
|
|
b) Customers for
sales and provisions of services : 12312 |
0,00 |
0,00 |
14.135.657,00 |
16.395.822,00 |
17.138.173,00 |
|
|
2. Customers, Group companies and
associates : 12320 |
3.508.511,00 |
3.275.736,00 |
3.167.675,00 |
2.738.202,00 |
2.310.130,00 |
|
|
3. Other accounts receivable: 12330 |
0,00 |
0,00 |
0,00 |
0,00 |
0,00 |
|
|
4. Personnel: 12340 |
2.971,00 |
16.990,00 |
51.376,00 |
123.469,00 |
200.495,00 |
|
|
5. Assets for deferred tax: 12350 |
148.076,00 |
783.772,00 |
516.279,00 |
244.678,00 |
351.094,00 |
|
|
6. Other debtors, including tax and social
security: 12360 |
1.856.527,00 |
1.672.270,00 |
1.150.303,00 |
1.361.552,00 |
1.358.586,00 |
|
|
7. Called up share capital: 12370 |
0,00 |
0,00 |
0,00 |
0,00 |
0,00 |
|
|
IV. Short-term investments in Group companies and associates:
12400 |
9.076.961,00 |
6.519.805,00 |
3.859.805,00 |
2.697.253,00 |
1.231.357,00 |
|
|
1. Equity instruments: 12410 |
0,00 |
0,00 |
0,00 |
0,00 |
0,00 |
|
|
2. Credits to businesses: 12420 |
9.076.961,00 |
6.519.805,00 |
3.859.805,00 |
2.697.253,00 |
1.231.357,00 |
|
|
3. Debt securities: 12430 |
0,00 |
0,00 |
0,00 |
0,00 |
0,00 |
|
|
4. Derivatives : 12440 |
0,00 |
0,00 |
0,00 |
0,00 |
0,00 |
|
|
5. Other financial assets : 12450 |
0,00 |
0,00 |
0,00 |
0,00 |
0,00 |
|
|
6. Other investments: 12460 |
0,00 |
0,00 |
0,00 |
0,00 |
0,00 |
|
|
V. Short-term financial investments : 12500 |
646.426,00 |
378.593,00 |
493.714,00 |
282.412,00 |
28.114,00 |
|
|
1. Equity instruments: 12510 |
0,00 |
0,00 |
0,00 |
0,00 |
0,00 |
|
|
2. Credits to businesses: 12520 |
0,00 |
0,00 |
0,00 |
0,00 |
27.981,00 |
|
|
3. Debt securities: 12530 |
0,00 |
0,00 |
0,00 |
0,00 |
0,00 |
|
|
4. Derivatives : 12540 |
198.248,00 |
0,00 |
0,00 |
0,00 |
0,00 |
|
|
5. Other financial assets : 12550 |
448.178,00 |
378.593,00 |
493.714,00 |
282.412,00 |
133,00 |
|
|
6. Other investments: 12560 |
0,00 |
0,00 |
0,00 |
0,00 |
0,00 |
|
|
VI. Short-term accruals: 12600 |
247.302,00 |
176.141,00 |
83.069,00 |
97.525,00 |
0,00 |
|
|
VII. Cash and other equivalent liquid assets : 12700 |
9.477.852,00 |
441.277,00 |
917.578,00 |
1.174.766,00 |
156.342,00 |
|
|
1. Treasury: 12710 |
9.477.852,00 |
441.277,00 |
917.578,00 |
1.174.766,00 |
156.342,00 |
|
|
2. Other equivalent liquid assets:
12720 |
0,00 |
0,00 |
0,00 |
0,00 |
0,00 |
|
|
TOTAL
ASSETS (A + B) : 10000 |
91.347.887,00 |
79.175.611,00 |
72.677.620,00 |
73.040.930,00 |
72.944.363,00 |
|
|
|
ORIGINAL |
ORIGINAL |
ORIGINAL |
ORIGINAL |
ORIGINAL |
|
|
Liabilities
and Net Worth |
2016 |
2015 |
2014 |
2013 |
2012 |
|
|
A)
NET WORTH: 20000 |
20.768.447,00 |
35.139.490,00 |
35.537.770,00 |
32.220.618,00 |
29.890.723,00 |
|
|
A-1) Shareholders' equity: 21000 |
20.768.447,00 |
35.139.490,00 |
35.537.770,00 |
32.220.618,00 |
29.890.723,00 |
|
|
I. Capital: 21100 |
845.727,00 |
845.727,00 |
845.727,00 |
845.727,00 |
845.727,00 |
|
|
1. Registered capital : 21110 |
845.727,00 |
845.727,00 |
845.727,00 |
845.727,00 |
845.727,00 |
|
|
2. (Uncalled capital): 21120 |
0,00 |
0,00 |
0,00 |
0,00 |
0,00 |
|
|
II. Share premium: 21200 |
23.735.713,00 |
23.735.713,00 |
23.735.713,00 |
23.735.713,00 |
23.735.713,00 |
|
|
III. Reserves: 21300 |
12.258.050,00 |
12.656.330,00 |
7.039.178,00 |
4.617.285,00 |
3.423.501,00 |
|
|
1. Legal and statutory: 21310 |
169.146,00 |
169.146,00 |
169.146,00 |
169.146,00 |
169.146,00 |
|
|
2. Other reserves: 21320 |
11.430.901,00 |
11.829.181,00 |
6.212.029,00 |
3.790.136,00 |
3.254.355,00 |
|
|
3. Revaluation reserves: 21330 |
658.003,00 |
658.003,00 |
658.003,00 |
658.003,00 |
0,00 |
|
|
2. Capitalisation Reserves: 21350 |
0,00 |
0,00 |
0,00 |
0,00 |
0,00 |
|
|
IV. (Common stock equity): 21400 |
-18.200.000,00 |
-1.700.000,00 |
-1.700.000,00 |
-900.000,00 |
-900.000,00 |
|
|
V. Results from previous periods: 21500 |
0,00 |
0,00 |
0,00 |
0,00 |
0,00 |
|
|
1. Brought forward: 21510 |
0,00 |
0,00 |
0,00 |
0,00 |
0,00 |
|
|
2. (Negative results from previous
periods): 21520 |
0,00 |
0,00 |
0,00 |
0,00 |
0,00 |
|
|
VI. Other shareholders' contributions: 21600 |
0,00 |
0,00 |
0,00 |
0,00 |
0,00 |
|
|
VII. Result of the period: 21700 |
2.128.957,00 |
-398.280,00 |
5.867.152,00 |
3.921.893,00 |
3.035.782,00 |
|
|
VIII. (Interim dividend): 21800 |
0,00 |
0,00 |
-250.000,00 |
0,00 |
-250.000,00 |
|
|
IX. Other net worth instruments: 21900 |
0,00 |
0,00 |
0,00 |
0,00 |
0,00 |
|
|
A-2) Adjustments due to changes in value: 22000 |
0,00 |
0,00 |
0,00 |
0,00 |
0,00 |
|
|
I. Financial assets held for sale: 22100 |
0,00 |
0,00 |
0,00 |
0,00 |
0,00 |
|
|
II. Hedge operations: 22200 |
0,00 |
0,00 |
0,00 |
0,00 |
0,00 |
|
|
III. Linked non-current assets and liabilities held for sale :
22300 |
0,00 |
0,00 |
0,00 |
0,00 |
0,00 |
|
|
IV. Exchange rate difference: 22400 |
0,00 |
0,00 |
0,00 |
0,00 |
0,00 |
|
|
V. Other: 22500 |
0,00 |
0,00 |
0,00 |
0,00 |
0,00 |
|
|
A-3) Received subsidies, donations and legacies: 23000 |
0,00 |
0,00 |
0,00 |
0,00 |
0,00 |
|
|
B)
NON-CURRENT LIABILITIES: 31000 |
44.652.584,00 |
18.277.621,00 |
16.748.558,00 |
13.753.081,00 |
12.935.278,00 |
|
|
I. Long-term provisions: 31100 |
1.469.885,00 |
1.194.468,00 |
1.093.375,00 |
1.100.897,00 |
0,00 |
|
|
1. Long-term employee benefits liability:
31110 |
0,00 |
0,00 |
0,00 |
0,00 |
0,00 |
|
|
2. Environmental actions: 31120 |
0,00 |
0,00 |
0,00 |
0,00 |
0,00 |
|
|
3. Restructuring provisions: 31130 |
0,00 |
0,00 |
0,00 |
0,00 |
0,00 |
|
|
4. Other provisions: 31140 |
1.469.885,00 |
0,00 |
1.093.375,00 |
1.100.897,00 |
0,00 |
|
|
II Long-term creditors: 31200 |
43.182.699,00 |
17.083.153,00 |
15.655.183,00 |
12.652.184,00 |
12.935.278,00 |
|
|
1. Liabilities and other securities:
31210 |
0,00 |
0,00 |
0,00 |
0,00 |
0,00 |
|
|
2. Amounts owed to credit institutions:
31220 |
42.560.789,00 |
17.083.153,00 |
15.655.183,00 |
12.608.211,00 |
12.891.305,00 |
|
|
3. Creditors from financial leasing:
31230 |
0,00 |
0,00 |
0,00 |
0,00 |
0,00 |
|
|
4. Derivatives : 31240 |
183.792,00 |
0,00 |
0,00 |
0,00 |
0,00 |
|
|
5. Other financial liabilities :
31250 |
438.118,00 |
0,00 |
0,00 |
43.973,00 |
43.973,00 |
|
|
III. Long-term debts with Group companies and associates:
31300 |
0,00 |
0,00 |
0,00 |
0,00 |
0,00 |
|
|
IV. Liabilities for deferred tax: 31400 |
0,00 |
0,00 |
0,00 |
0,00 |
0,00 |
|
|
V. Long-term accruals: 31500 |
0,00 |
0,00 |
0,00 |
0,00 |
0,00 |
|
|
VI. Non-current trade creditors : 31600 |
0,00 |
0,00 |
0,00 |
0,00 |
0,00 |
|
|
VII. Special long-term debts : 31700 |
0,00 |
0,00 |
0,00 |
0,00 |
0,00 |
|
|
C)
CURRENT LIABILITIES : 32000 |
25.926.856,00 |
25.758.500,00 |
20.391.292,00 |
27.067.231,00 |
30.118.362,00 |
|
|
I. Liabilities linked to non-current assets held for sale:
32100 |
0,00 |
0,00 |
0,00 |
0,00 |
0,00 |
|
|
II. Short-term provisions: 32200 |
104.329,00 |
91.545,00 |
246.219,00 |
75.933,00 |
888.472,00 |
|
|
1. Provisions from greenhouse gas emission
allowance: 32210 |
0,00 |
0,00 |
0,00 |
0,00 |
0,00 |
|
|
2. Other provisions: 32220 |
104.329,00 |
0,00 |
246.219,00 |
75.933,00 |
0,00 |
|
|
III. Short-term creditors : 32300 |
10.069.910,00 |
13.357.169,00 |
9.150.898,00 |
14.310.625,00 |
19.602.597,00 |
|
|
1. Liabilities and other securities:
32310 |
0,00 |
0,00 |
0,00 |
0,00 |
0,00 |
|
|
2. Amounts owed to credit institutions:
32320 |
3.409.435,00 |
13.340.928,00 |
9.134.657,00 |
14.310.625,00 |
19.592.038,00 |
|
|
3. Creditors from financial leasing:
32330 |
0,00 |
0,00 |
0,00 |
0,00 |
0,00 |
|
|
4. Derivatives : 32340 |
0,00 |
0,00 |
0,00 |
0,00 |
0,00 |
|
|
5. Other financial liabilities :
32350 |
6.660.475,00 |
16.241,00 |
16.241,00 |
0,00 |
10.559,00 |
|
|
IV. Short-term debts with Group companies and associates:
32400 |
0,00 |
0,00 |
0,00 |
0,00 |
0,00 |
|
|
V. Trade creditors and other accounts payable: 32500 |
15.696.385,00 |
12.255.915,00 |
10.962.997,00 |
12.663.073,00 |
9.392.730,00 |
|
|
1. Suppliers: 32510 |
8.361.356,00 |
5.954.941,00 |
5.148.347,00 |
6.193.048,00 |
3.614.531,00 |
|
|
a) Long-term debts :
32511 |
0,00 |
0,00 |
0,00 |
0,00 |
0,00 |
|
|
b) Short-term debts :
32512 |
8.361.356,00 |
0,00 |
5.148.347,00 |
6.193.048,00 |
3.614.531,00 |
|
|
2. Suppliers, Group companies and
associates: 32520 |
804.267,00 |
984.736,00 |
736.026,00 |
675.859,00 |
1.540.720,00 |
|
|
3. Other creditors: 32530 |
3.403.263,00 |
3.109.858,00 |
2.896.185,00 |
2.636.111,00 |
2.266.387,00 |
|
|
4. Personnel (remuneration due):
32540 |
1.574.241,00 |
1.389.664,00 |
1.346.254,00 |
2.281.528,00 |
1.466.297,00 |
|
|
5. Liabilities for current tax:
32550 |
590.814,00 |
0,00 |
0,00 |
0,00 |
0,00 |
|
|
6. Other accounts payable to Public
Administrations.: 32560 |
962.444,00 |
816.716,00 |
836.185,00 |
876.527,00 |
504.795,00 |
|
|
7. Advances from clients: 32570 |
0,00 |
0,00 |
0,00 |
0,00 |
0,00 |
|
|
VI. Short-term accruals: 32600 |
56.232,00 |
53.871,00 |
31.178,00 |
17.600,00 |
234.563,00 |
|
|
VII. Special short-term debts : 32700 |
0,00 |
0,00 |
0,00 |
0,00 |
0,00 |
|
|
TOTAL
NET WORTH AND LIABILITIES (A + B + C) : 30000 |
91.347.887,00 |
79.175.611,00 |
72.677.620,00 |
73.040.930,00 |
72.944.363,00 |
|
|
|
ORIGINAL |
ORIGINAL |
ORIGINAL |
ORIGINAL |
ORIGINAL |
|
|
Profit
and Loss |
2016 |
2015 |
2014 |
2013 |
2012 |
|
|
1.
Net turnover: 40100 |
79.523.427,00 |
75.417.191,00 |
77.384.079,00 |
77.990.857,00 |
75.539.057,00 |
|
|
a) Sales: 40110 |
79.145.052,00 |
74.998.789,00 |
77.124.985,00 |
77.691.894,00 |
75.322.357,00 |
|
|
b) Rendering of services: 40120 |
378.375,00 |
418.402,00 |
259.094,00 |
298.963,00 |
216.700,00 |
|
|
c) Income of financial nature of holding companies: 40130 |
0,00 |
0,00 |
0,00 |
0,00 |
0,00 |
|
|
2.
Changes in stocks of finished goods and work in progress: 40200 |
247.134,00 |
-1.622.932,00 |
554.129,00 |
-1.164.706,00 |
-1.261.813,00 |
|
|
3.
Works carried out by the company for its assets: 40300 |
126.127,00 |
50.659,00 |
55.741,00 |
27.959,00 |
66.536,00 |
|
|
4.
Supplies : 40400 |
-48.003.679,00 |
-45.495.540,00 |
-47.642.902,00 |
-46.794.572,00 |
-45.434.712,00 |
|
|
a) Stock consumption: 40410 |
-18.650.867,00 |
-19.166.772,00 |
-18.430.416,00 |
-16.425.764,00 |
-12.664.858,00 |
|
|
b) Consumption of raw materials and miscellaneous consumable
ones: 40420 |
-24.229.148,00 |
-21.611.418,00 |
-24.225.627,00 |
-26.602.181,00 |
-28.713.563,00 |
|
|
c) Works carried out by other companies: 40430 |
-5.123.664,00 |
-4.599.824,00 |
-4.814.060,00 |
-4.154.634,00 |
-3.985.833,00 |
|
|
d) Impairment of stock, primary material and other supplies:
40440 |
0,00 |
-117.526,00 |
-172.799,00 |
388.007,00 |
-70.458,00 |
|
|
5.
Other operating income: 40500 |
4.541.485,00 |
3.611.492,00 |
3.217.498,00 |
2.490.383,00 |
1.829.073,00 |
|
|
a) Auxiliary income and other from current management:
40510 |
4.541.485,00 |
3.583.329,00 |
3.181.044,00 |
2.468.741,00 |
1.664.995,00 |
|
|
b) Operation subsidies included in the Period's
result: 40520 |
0,00 |
28.163,00 |
36.454,00 |
21.642,00 |
164.078,00 |
|
|
6.
Personnel costs: 40600 |
-12.769.006,00 |
-12.747.201,00 |
-11.852.959,00 |
-13.805.175,00 |
-14.623.822,00 |
|
|
a) Wages, salaries et al.: 40610 |
-9.996.750,00 |
-10.012.988,00 |
-9.396.273,00 |
-11.141.529,00 |
-11.634.155,00 |
|
|
b) Social security costs: 40620 |
-2.772.256,00 |
-2.734.213,00 |
-2.566.536,00 |
-2.663.646,00 |
-2.989.667,00 |
|
|
c) Provisions : 40630 |
0,00 |
0,00 |
109.850,00 |
0,00 |
0,00 |
|
|
7.
Other operating costs: 40700 |
-16.749.671,00 |
-16.731.011,00 |
-15.285.527,00 |
-15.519.385,00 |
-15.694.947,00 |
|
|
a) External services: 40710 |
-16.078.042,00 |
-16.197.090,00 |
-14.926.253,00 |
-14.800.668,00 |
-15.151.380,00 |
|
|
b) Taxes: 40720 |
-218.164,00 |
-213.536,00 |
-106.589,00 |
-224.600,00 |
-183.087,00 |
|
|
c) Losses, impairments and variation in provisions from trade
operations : 40730 |
-453.465,00 |
-320.385,00 |
-252.685,00 |
-392.918,00 |
-360.480,00 |
|
|
d) Other current management expenditure : 40740 |
0,00 |
0,00 |
0,00 |
-101.199,00 |
0,00 |
|
|
e) Expenses due to greenhouse gas emissions: 40750 |
0,00 |
0,00 |
0,00 |
0,00 |
0,00 |
|
|
8.
Amortisation of fixed assets: 40800 |
-2.528.836,00 |
-2.318.929,00 |
-2.005.402,00 |
-2.389.754,00 |
-1.968.273,00 |
|
|
9.
Allocation of subsidies of non-financial fixed assets and other: 40900 |
0,00 |
0,00 |
0,00 |
0,00 |
0,00 |
|
|
10.
Excess provisions : 41000 |
0,00 |
0,00 |
0,00 |
88.991,00 |
12.758,00 |
|
|
11.
Impairment and result of transfers of fixed assets: 41100 |
-1.222,00 |
209.502,00 |
4.448,00 |
121.113,00 |
-18.384,00 |
|
|
a) Impairment and losses : 41110 |
0,00 |
0,00 |
0,00 |
0,00 |
0,00 |
|
|
b) Results for transfers and other : 41120 |
-1.222,00 |
209.502,00 |
4.448,00 |
121.113,00 |
-18.384,00 |
|
|
c) Impairment and profit due to disposals of assets of holding
companies: 41130 |
0,00 |
0,00 |
0,00 |
0,00 |
0,00 |
|
|
12.
Negative difference in combined businesses: 41200 |
0,00 |
0,00 |
0,00 |
0,00 |
0,00 |
|
|
13.
Other results : 41300 |
19.830,00 |
19.326,00 |
98.247,00 |
5.562,00 |
0,00 |
|
|
A.1)
OPERATING INCOME (1 + 2 + 3 + 4 + 5 + 6 + 7 + 8 + 9 + 10 + 11 + 12 + 13) :
49100 |
4.405.589,00 |
392.557,00 |
4.527.352,00 |
1.051.273,00 |
-1.554.527,00 |
|
|
14.
Financial income : 41400 |
351.345,00 |
213.910,00 |
4.188.622,00 |
4.632.636,00 |
3.169.536,00 |
|
|
a) Of shares in equity instruments : 41410 |
0,00 |
0,00 |
4.000.000,00 |
4.500.000,00 |
3.108.850,00 |
|
|
a 1) In Group companies and associates:
41411 |
0,00 |
0,00 |
4.000.000,00 |
4.500.000,00 |
3.108.850,00 |
|
|
a 2) In third parties: 41412 |
0,00 |
0,00 |
0,00 |
0,00 |
0,00 |
|
|
b) From negotiable securities and other financial instruments :
41420 |
351.345,00 |
213.910,00 |
188.622,00 |
132.636,00 |
60.686,00 |
|
|
b 1) From Group companies and associates :
41421 |
350.992,00 |
213.802,00 |
188.438,00 |
131.311,00 |
60.686,00 |
|
|
b 2) From third parties : 41422 |
353,00 |
108,00 |
184,00 |
1.325,00 |
0,00 |
|
|
c) Allocation of financial subsidies, donations and legacies :
41430 |
0,00 |
0,00 |
0,00 |
0,00 |
0,00 |
|
|
15.
Financial expenditure: 41500 |
-1.180.899,00 |
-753.217,00 |
-1.040.907,00 |
-957.922,00 |
-951.037,00 |
|
|
a) Amounts owed to Group companies and associates : 41510 |
0,00 |
0,00 |
0,00 |
0,00 |
0,00 |
|
|
b) For debts with third parties : 41520 |
-1.180.899,00 |
-753.217,00 |
-1.040.907,00 |
-957.922,00 |
-951.037,00 |
|
|
c) Stock renewal : 41530 |
0,00 |
0,00 |
0,00 |
0,00 |
0,00 |
|
|
16.
Changes in fair value of financial instruments : 41600 |
14.456,00 |
0,00 |
0,00 |
0,00 |
0,00 |
|
|
a) Trading book and other : 41610 |
0,00 |
0,00 |
0,00 |
0,00 |
0,00 |
|
|
b) Allocation of financial assets held for sale to the result
for the period: 41620 |
14.456,00 |
0,00 |
0,00 |
0,00 |
0,00 |
|
|
17.
Exchange rate differences : 41700 |
333.386,00 |
-101.861,00 |
141.398,00 |
-32.143,00 |
-46.064,00 |
|
|
18.
Impairment and result for transfers of financial instruments: 41800 |
-542.457,00 |
-540.000,00 |
-1.124.431,00 |
-1.050.174,00 |
1.761.349,00 |
|
|
a) Impairment and losses : 41810 |
-542.457,00 |
-540.000,00 |
-1.062.366,00 |
-1.050.174,00 |
311.348,00 |
|
|
b) Results for transfers and other : 41820 |
0,00 |
0,00 |
-62.065,00 |
0,00 |
1.450.001,00 |
|
|
19.
Other financial income and expenditure: 42100 |
0,00 |
0,00 |
0,00 |
0,00 |
0,00 |
|
|
a) Incorporation of financial expenditure to assets:
42110 |
0,00 |
0,00 |
0,00 |
0,00 |
0,00 |
|
|
b) Financial income from arrangement with creditors:
42120 |
0,00 |
0,00 |
0,00 |
0,00 |
0,00 |
|
|
c) Other income and expenditure: 42130 |
0,00 |
0,00 |
0,00 |
0,00 |
0,00 |
|
|
A.2)
FINANCIAL REVENUE (14+15+16+17+18+19) : 49200 |
-1.024.169,00 |
-1.181.168,00 |
2.164.682,00 |
2.592.397,00 |
3.933.784,00 |
|
|
A.3)
NET RESULT BEFORE TAXES (A.1+A.2) : 49300 |
3.381.420,00 |
-788.611,00 |
6.692.034,00 |
3.643.670,00 |
2.379.257,00 |
|
|
20.
Income taxes: 41900 |
-1.252.463,00 |
390.331,00 |
-824.882,00 |
278.223,00 |
656.525,00 |
|
|
A.4)
PROFIT AFTER TAXES (A.3+20) : 49400 |
2.128.957,00 |
-398.280,00 |
5.867.152,00 |
3.921.893,00 |
3.035.782,00 |
|
|
21.
Result of the year coming from interrupted operations : 42000 |
0,00 |
0,00 |
0,00 |
0,00 |
0,00 |
|
|
A.5)
RESULT OF THE PERIOD (A.4+21) : 49500 |
2.128.957,00 |
-398.280,00 |
5.867.152,00 |
3.921.893,00 |
3.035.782,00 |
|
>
Normal Balance Sheet under the rules of the 1990 General Accounting Plan
(repealed since 1st January of 2008)
Information corresponding to the
fiscal year 2016 2015 2014 2013 2012 has been
compiled based on the equivalence criteria stipulated in Act JUS/206/2009.
Where the provisions of the Act did not establish relevant equivalence criteria.
To view details on the methodology
2016 2015 2014 2013 2012 is taken from information
submitted to the TRADE REGISTER.
|
|
EQUIVALENCIA |
EQUIVALENCIA |
EQUIVALENCIA |
EQUIVALENCIA |
EQUIVALENCIA |
|
|
ASSETS |
2016 |
2015 |
2014 |
2013 |
2012 |
|
|
A)
SHAREHOLDERS (PARTNERS) BY UNCALLED SUSCRIBED CAPITAL: |
0,00 |
0,00 |
0,00 |
0,00 |
0,00 |
|
|
B)
FIXED ASSETS: |
55.930.438,00 |
34.902.473,00 |
33.462.404,00 |
32.930.568,00 |
33.305.892,00 |
|
|
I. Formation expenses: |
0,00 |
0,00 |
0,00 |
0,00 |
0,00 |
|
|
II. Intangible fixed assets: |
5.174.632,00 |
5.416.250,00 |
5.553.303,00 |
4.619.134,00 |
4.898.177,00 |
|
|
1. Research and development costs: |
0,00 |
0,00 |
0,00 |
0,00 |
0,00 |
|
|
2. Concessions, patents, licences,
trademarks et al.: |
2.341.605,00 |
2.486.883,00 |
2.632.160,00 |
2.565.475,00 |
2.700.500,00 |
|
|
3. Goodwill: |
0,00 |
0,00 |
0,00 |
0,00 |
0,00 |
|
|
4. Key money paid for premises: |
0,00 |
0,00 |
0,00 |
0,00 |
0,00 |
|
|
5. Software: |
1.978.164,00 |
2.156.852,00 |
1.625.753,00 |
1.796.175,00 |
2.158.154,00 |
|
|
6. Assets under capital leases: |
0,00 |
0,00 |
0,00 |
0,00 |
0,00 |
|
|
7. Payments on account: |
854.863,00 |
772.515,00 |
1.295.390,00 |
257.484,00 |
39.523,00 |
|
|
8. Provisions: |
0,00 |
0,00 |
0,00 |
0,00 |
0,00 |
|
|
9. Accumulated depreciation: |
0,00 |
0,00 |
0,00 |
0,00 |
0,00 |
|
|
III. Tangible fixed assets: |
9.830.917,00 |
8.917.257,00 |
7.456.096,00 |
7.569.288,00 |
8.268.588,00 |
|
|
1. Land and construction: |
2.061.330,00 |
2.143.941,00 |
2.226.553,00 |
2.309.164,00 |
1.995.867,00 |
|
|
2. Technical installations and machinery:
|
6.493.471,00 |
4.178.956,00 |
4.501.746,00 |
4.632.424,00 |
5.087.034,00 |
|
|
3. Other installations, tools and
furniture: |
259.719,00 |
167.146,00 |
180.056,00 |
185.283,00 |
203.466,00 |
|
|
4. Payments on account and tangible fixed
assets under construction: |
776.691,00 |
2.272.949,00 |
381.560,00 |
271.412,00 |
794.434,00 |
|
|
5. Other tangible assets: |
239.705,00 |
154.265,00 |
166.181,00 |
171.005,00 |
187.787,00 |
|
|
6. Provisions: |
0,00 |
0,00 |
0,00 |
0,00 |
0,00 |
|
|
7. Accumulated depreciation: |
0,00 |
0,00 |
0,00 |
0,00 |
0,00 |
|
|
IV. Financial investments: |
22.724.889,00 |
18.868.966,00 |
18.753.005,00 |
19.842.146,00 |
19.239.127,00 |
|
|
1. Equity investments in group companies:
|
17.977.446,00 |
16.957.027,00 |
17.016.156,00 |
18.023.017,00 |
16.311.016,00 |
|
|
2. Receivables from group companies:
|
4.440.669,00 |
1.622.669,00 |
1.547.669,00 |
1.547.669,00 |
2.652.297,00 |
|
|
3. Equity investment in associated
companies: |
54.045,00 |
50.978,00 |
51.155,00 |
54.182,00 |
49.036,00 |
|
|
4. Credits to associated companies: |
0,00 |
0,00 |
0,00 |
0,00 |
0,00 |
|
|
5. Long-term securities portfolio: |
361,00 |
361,00 |
361,00 |
361,00 |
361,00 |
|
|
6. Other receivables: |
0,00 |
0,00 |
0,00 |
0,00 |
0,00 |
|
|
7. Long term guarantees and deposits:
|
252.368,00 |
237.931,00 |
137.664,00 |
216.917,00 |
226.417,00 |
|
|
8. Provisions: |
0,00 |
0,00 |
0,00 |
0,00 |
0,00 |
|
|
9. Long-term receivables from public
bodies: |
0,00 |
0,00 |
0,00 |
0,00 |
0,00 |
|
|
V. Own shares: |
18.200.000,00 |
1.700.000,00 |
1.700.000,00 |
900.000,00 |
900.000,00 |
|
|
VI. Long-term trade receivables: |
0,00 |
0,00 |
0,00 |
0,00 |
0,00 |
|
|
C)
Deferred expenses: |
0,00 |
0,00 |
0,00 |
0,00 |
0,00 |
|
|
D)
CURRENT ASSETS: |
53.419.201,00 |
45.973.138,00 |
40.915.216,00 |
41.010.362,00 |
40.538.471,00 |
|
|
I. Called-up share capital (not paid): |
0,00 |
0,00 |
0,00 |
0,00 |
0,00 |
|
|
II. Stocks: |
14.999.352,00 |
14.631.832,00 |
14.671.824,00 |
13.702.724,00 |
16.013.742,00 |
|
|
1. Goods for resale: |
7.948.228,00 |
7.622.826,00 |
6.273.700,00 |
6.269.928,00 |
6.783.783,00 |
|
|
2. Raw materials and other consumables:
|
3.243.997,00 |
3.463.002,00 |
3.227.707,00 |
2.638.983,00 |
3.823.780,00 |
|
|
3. Goods in process and semifinished ones:
|
582.028,00 |
413.379,00 |
805.053,00 |
793.731,00 |
0,00 |
|
|
4. Finished products: |
3.206.542,00 |
3.128.057,00 |
4.359.315,00 |
3.989.307,00 |
5.388.111,00 |
|
|
5. Byproducts, scrap and recovered
materials: |
0,00 |
0,00 |
0,00 |
0,00 |
0,00 |
|
|
6. Payments on account: |
18.557,00 |
4.568,00 |
6.049,00 |
10.775,00 |
18.068,00 |
|
|
7. Provisions: |
0,00 |
0,00 |
0,00 |
0,00 |
0,00 |
|
|
III. Debtors: |
19.169.556,00 |
23.825.490,00 |
20.889.226,00 |
23.055.682,00 |
23.108.916,00 |
|
|
1. Trade debtors / accounts receivable:
|
12.135.867,00 |
16.011.458,00 |
14.135.657,00 |
16.395.822,00 |
17.138.173,00 |
|
|
2. Accounts receivable, Group companies:
|
3.508.511,00 |
3.275.736,00 |
3.167.675,00 |
2.738.202,00 |
2.310.130,00 |
|
|
3. Accounts receivable, associated
companies: |
0,00 |
0,00 |
0,00 |
0,00 |
0,00 |
|
|
4. Other debtors: |
0,00 |
0,00 |
0,00 |
0,00 |
0,00 |
|
|
5. Staff: |
2.971,00 |
16.990,00 |
51.376,00 |
123.469,00 |
200.495,00 |
|
|
6. Public bodies: |
3.522.207,00 |
4.521.306,00 |
3.534.518,00 |
3.798.189,00 |
3.460.118,00 |
|
|
7. Provisions: |
0,00 |
0,00 |
0,00 |
0,00 |
0,00 |
|
|
IV. Short-term investments: |
9.525.139,00 |
6.898.398,00 |
4.353.519,00 |
2.979.665,00 |
1.259.471,00 |
|
|
1. Equity investments in group companies:
|
0,00 |
0,00 |
0,00 |
0,00 |
0,00 |
|
|
2. Receivables from group companies:
|
9.076.961,00 |
6.519.805,00 |
3.859.805,00 |
2.697.253,00 |
1.231.357,00 |
|
|
3. Equity investment in associated
companies: |
0,00 |
0,00 |
0,00 |
0,00 |
0,00 |
|
|
4. Credits to associated companies: |
0,00 |
0,00 |
0,00 |
0,00 |
0,00 |
|
|
5. Short term securities portfolio: |
0,00 |
0,00 |
0,00 |
0,00 |
0,00 |
|
|
6. Other receivables: |
0,00 |
0,00 |
0,00 |
0,00 |
27.981,00 |
|
|
7. Shor term guarantees and deposits:
|
448.178,00 |
378.593,00 |
493.714,00 |
282.412,00 |
133,00 |
|
|
8. Provisions: |
0,00 |
0,00 |
0,00 |
0,00 |
0,00 |
|
|
V. Short-term treasury shares: |
0,00 |
0,00 |
0,00 |
0,00 |
0,00 |
|
|
VI. Cash at bank and in hand: |
9.477.852,00 |
441.277,00 |
917.578,00 |
1.174.766,00 |
156.342,00 |
|
|
VII. Prepayments and accrued income: |
247.302,00 |
176.141,00 |
83.069,00 |
97.525,00 |
0,00 |
|
|
GENERAL
TOTAL (A + B + C + D): |
109.349.639,00 |
80.875.611,00 |
74.377.620,00 |
73.940.930,00 |
73.844.363,00 |
|
MERCANTILE REGISTRY.
|
|
EQUIVALENCIA |
EQUIVALENCIA |
EQUIVALENCIA |
EQUIVALENCIA |
EQUIVALENCIA |
|
|
LIABILITIES |
2016 |
2015 |
2014 |
2013 |
2012 |
|
|
A)
EQUITY: |
38.295.988,00 |
36.181.487,00 |
36.579.767,00 |
32.462.615,00 |
30.790.723,00 |
|
|
I. Subscribed capital: |
845.727,00 |
845.727,00 |
845.727,00 |
845.727,00 |
845.727,00 |
|
|
II. Share premium: |
23.735.713,00 |
23.735.713,00 |
23.735.713,00 |
23.735.713,00 |
23.735.713,00 |
|
|
III. Revaluation reserves: |
0,00 |
0,00 |
0,00 |
0,00 |
0,00 |
|
|
IV. Reserves: |
11.585.591,00 |
11.998.327,00 |
6.381.175,00 |
3.959.282,00 |
3.423.501,00 |
|
|
1. Legal reserve: |
169.146,00 |
169.146,00 |
169.146,00 |
169.146,00 |
169.146,00 |
|
|
2. Reserves for own shares: |
0,00 |
0,00 |
0,00 |
0,00 |
0,00 |
|
|
3. Reserves for shares of the controlling
company: |
0,00 |
0,00 |
0,00 |
0,00 |
0,00 |
|
|
4. Statutory reserves: |
0,00 |
0,00 |
0,00 |
0,00 |
0,00 |
|
|
5. Miscellaneous reserves: |
11.416.445,00 |
11.829.181,00 |
6.212.029,00 |
3.790.136,00 |
3.254.355,00 |
|
|
6. Differences due to capital adjustment
to euros: |
0,00 |
0,00 |
0,00 |
0,00 |
0,00 |
|
|
V. Profit or loss brought forward: |
0,00 |
0,00 |
0,00 |
0,00 |
0,00 |
|
|
1. Retained earnings: |
0,00 |
0,00 |
0,00 |
0,00 |
0,00 |
|
|
2. Prior year losses: |
0,00 |
0,00 |
0,00 |
0,00 |
0,00 |
|
|
3. Partners' contributions so as
to compensate losses: |
0,00 |
0,00 |
0,00 |
0,00 |
0,00 |
|
|
VI. Profit or loss for the financial year: |
2.128.957,00 |
-398.280,00 |
5.867.152,00 |
3.921.893,00 |
3.035.782,00 |
|
|
VII. Interim dividend paid: |
0,00 |
0,00 |
-250.000,00 |
0,00 |
-250.000,00 |
|
|
VIII. Own shares for capital reduction: |
0,00 |
0,00 |
0,00 |
0,00 |
0,00 |
|
|
B)
Deferred income: |
0,00 |
0,00 |
0,00 |
0,00 |
0,00 |
|
|
1. Capital grants: |
0,00 |
0,00 |
0,00 |
0,00 |
0,00 |
|
|
2. Unrealised exchange gains: |
0,00 |
0,00 |
0,00 |
0,00 |
0,00 |
|
|
3. Other deferred income: |
0,00 |
0,00 |
0,00 |
0,00 |
0,00 |
|
|
4. Public revenues to distribute in
several financial years: |
0,00 |
0,00 |
0,00 |
0,00 |
0,00 |
|
|
C)
PROVISIONS FOR LIABILITIES AND CHARGES: |
1.469.885,00 |
1.194.468,00 |
1.093.375,00 |
1.100.897,00 |
0,00 |
|
|
1. Provisions for pension fund and other
similar obligations: |
0,00 |
0,00 |
0,00 |
0,00 |
0,00 |
|
|
2. Provisions for taxes: |
0,00 |
0,00 |
0,00 |
0,00 |
0,00 |
|
|
3. Other provisions: |
1.469.885,00 |
1.194.468,00 |
1.093.375,00 |
1.100.897,00 |
0,00 |
|
|
4. Reversion fund: |
0,00 |
0,00 |
0,00 |
0,00 |
0,00 |
|
|
D)
LONG TERM LIABILITIES: |
42.998.907,00 |
17.083.153,00 |
15.655.183,00 |
12.652.184,00 |
12.935.278,00 |
|
|
I. Issued debentures and other marketable securities: |
0,00 |
0,00 |
0,00 |
0,00 |
0,00 |
|
|
1. Non-convertible debentures: |
0,00 |
0,00 |
0,00 |
0,00 |
0,00 |
|
|
2. Convertible debentures: |
0,00 |
0,00 |
0,00 |
0,00 |
0,00 |
|
|
3. Other debt securities: |
0,00 |
0,00 |
0,00 |
0,00 |
0,00 |
|
|
II. Amounts owed to credit institutions: |
42.560.789,00 |
17.083.153,00 |
15.655.183,00 |
12.608.211,00 |
12.891.305,00 |
|
|
1. Loans and other liabilities: |
42.560.789,00 |
17.083.153,00 |
15.655.183,00 |
12.608.211,00 |
12.891.305,00 |
|
|
2. Long-term liabilities from capital
leases: |
0,00 |
0,00 |
0,00 |
0,00 |
0,00 |
|
|
III. Debts with companies of the group and affiliated ones:
|
0,00 |
0,00 |
0,00 |
0,00 |
0,00 |
|
|
1. Amounts owed to group companies: |
0,00 |
0,00 |
0,00 |
0,00 |
0,00 |
|
|
2. Amounts owed to associated companies:
|
0,00 |
0,00 |
0,00 |
0,00 |
0,00 |
|
|
IV. Other creditors: |
438.118,00 |
0,00 |
0,00 |
43.973,00 |
43.973,00 |
|
|
1. Long-term bills of exchange payable:
|
0,00 |
0,00 |
0,00 |
0,00 |
0,00 |
|
|
2. Other creditors: |
438.118,00 |
0,00 |
0,00 |
0,00 |
0,00 |
|
|
3. Long term guarantees and deposits
received: |
0,00 |
0,00 |
0,00 |
43.973,00 |
43.973,00 |
|
|
4. Long term payables to public bodies:
|
0,00 |
0,00 |
0,00 |
0,00 |
0,00 |
|
|
V. Unpaid portion of equity investment: |
0,00 |
0,00 |
0,00 |
0,00 |
0,00 |
|
|
1. Group companies: |
0,00 |
0,00 |
0,00 |
0,00 |
0,00 |
|
|
2. Associated companies: |
0,00 |
0,00 |
0,00 |
0,00 |
0,00 |
|
|
3. Third parties: |
0,00 |
0,00 |
0,00 |
0,00 |
0,00 |
|
|
VI. Long term trade creditors: |
0,00 |
0,00 |
0,00 |
0,00 |
0,00 |
|
|
E)
SHORT TERM CREDITORS: |
25.822.527,00 |
25.666.955,00 |
20.145.073,00 |
26.991.298,00 |
29.229.890,00 |
|
|
I. Issued debentures and other marketable securities: |
0,00 |
0,00 |
0,00 |
0,00 |
0,00 |
|
|
1. Non-convertible debentures: |
0,00 |
0,00 |
0,00 |
0,00 |
0,00 |
|
|
2. Convertible debentures: |
0,00 |
0,00 |
0,00 |
0,00 |
0,00 |
|
|
3. Other debt securities: |
0,00 |
0,00 |
0,00 |
0,00 |
0,00 |
|
|
4. Accrued interest on debentures and
other debt securities: |
0,00 |
0,00 |
0,00 |
0,00 |
0,00 |
|
|
II. Amounts owed to credit institutions: |
3.409.435,00 |
13.340.928,00 |
9.134.657,00 |
14.310.625,00 |
19.592.038,00 |
|
|
1. Loans and other liabilities: |
3.409.435,00 |
13.340.928,00 |
9.134.657,00 |
14.310.625,00 |
19.592.038,00 |
|
|
2. Accrued interest on liabilities with
credit institutions: |
0,00 |
0,00 |
0,00 |
0,00 |
0,00 |
|
|
3. Short-term liabilities from capital
leases: |
0,00 |
0,00 |
0,00 |
0,00 |
0,00 |
|
|
III. Short-term amounts owed to group and associated companies:
|
804.267,00 |
984.736,00 |
736.026,00 |
675.859,00 |
1.540.720,00 |
|
|
1. Amounts owed to group companies: |
804.267,00 |
984.736,00 |
736.026,00 |
675.859,00 |
1.540.720,00 |
|
|
2. Amounts owed to associated companies:
|
0,00 |
0,00 |
0,00 |
0,00 |
0,00 |
|
|
IV. Trade creditors: |
11.764.619,00 |
9.064.799,00 |
8.044.532,00 |
8.829.159,00 |
5.880.918,00 |
|
|
1. Advanced payments from customers:
|
0,00 |
0,00 |
0,00 |
0,00 |
0,00 |
|
|
2. Amounts owed for purchases of goods or
services: |
11.764.619,00 |
9.064.799,00 |
8.044.532,00 |
8.829.159,00 |
5.880.918,00 |
|
|
3. Debts represented by notes payable:
|
0,00 |
0,00 |
0,00 |
0,00 |
0,00 |
|
|
V. Other creditors: |
9.787.974,00 |
2.222.621,00 |
2.198.680,00 |
3.158.055,00 |
1.981.651,00 |
|
|
1. Public bodies: |
1.553.258,00 |
816.716,00 |
836.185,00 |
876.527,00 |
504.795,00 |
|
|
2. Bills of exchange payable: |
0,00 |
0,00 |
0,00 |
0,00 |
0,00 |
|
|
3. Miscellaneous debts: |
6.660.475,00 |
16.241,00 |
16.241,00 |
0,00 |
10.559,00 |
|
|
4. Wages and salaries payable: |
1.574.241,00 |
1.389.664,00 |
1.346.254,00 |
2.281.528,00 |
1.466.297,00 |
|
|
5. Guarantees and deposits received at
short term: |
0,00 |
0,00 |
0,00 |
0,00 |
0,00 |
|
|
VI. Provisions: |
0,00 |
0,00 |
0,00 |
0,00 |
0,00 |
|
|
VII. Prepayments and accrued income: |
56.232,00 |
53.871,00 |
31.178,00 |
17.600,00 |
234.563,00 |
|
|
F)
SHORT-TERM PROVISIONS FOR LIABILITIES AND CHARGES: |
104.329,00 |
91.545,00 |
246.219,00 |
75.933,00 |
888.472,00 |
|
|
GENERAL
TOTAL (A + B + C + D + E + F): |
108.691.636,00 |
80.217.608,00 |
73.719.617,00 |
73.282.927,00 |
73.844.363,00 |
|
MERCANTILE REGISTRY.
|
|
EQUIVALENCIA |
EQUIVALENCIA |
EQUIVALENCIA |
EQUIVALENCIA |
EQUIVALENCIA |
|
|
DEBIT |
2016 |
2015 |
2014 |
2013 |
2012 |
|
|
A)
CHARGES (A.1 to A.15): |
83.028.233,00 |
79.920.360,00 |
79.777.010,00 |
81.435.608,00 |
79.031.179,00 |
|
|
A.1. Stock reduction of both manufactured
goods and the ones in process: |
0,00 |
1.622.932,00 |
0,00 |
1.164.706,00 |
1.261.813,00 |
|
|
A.2. Supplies: |
48.003.679,00 |
45.378.014,00 |
47.470.103,00 |
47.182.579,00 |
45.364.254,00 |
|
|
a) Stock consumption:
|
18.650.867,00 |
19.166.772,00 |
18.430.416,00 |
16.425.764,00 |
12.664.858,00 |
|
|
b) Consumption of raw
materials and miscellaneous consumable ones: |
24.229.148,00 |
21.611.418,00 |
24.225.627,00 |
26.602.181,00 |
28.713.563,00 |
|
|
c) Miscellaneous
external expenditure: |
5.123.664,00 |
4.599.824,00 |
4.814.060,00 |
4.154.634,00 |
3.985.833,00 |
|
|
A.3. Staff costs: |
12.769.006,00 |
12.747.201,00 |
11.852.959,00 |
13.805.175,00 |
14.623.822,00 |
|
|
a) Wages, salaries et
al.: |
9.996.750,00 |
10.012.988,00 |
9.286.423,00 |
11.141.529,00 |
11.634.155,00 |
|
|
b) Social security
costs: |
2.772.256,00 |
2.734.213,00 |
2.566.536,00 |
2.663.646,00 |
2.989.667,00 |
|
|
A.4. Depreciation expense: |
2.528.836,00 |
2.318.929,00 |
2.005.402,00 |
2.389.754,00 |
1.968.273,00 |
|
|
A.5. Variation of trade provisions and
losses of unrecovered receivables: |
453.465,00 |
437.911,00 |
425.484,00 |
4.911,00 |
430.938,00 |
|
|
a) Stock provision
variation: |
0,00 |
117.526,00 |
172.799,00 |
-388.007,00 |
70.458,00 |
|
|
b) Variation in
provision and bad debt losses: |
453.465,00 |
320.385,00 |
252.685,00 |
392.918,00 |
360.480,00 |
|
|
c) Variation of other
trade provisions: |
0,00 |
0,00 |
0,00 |
0,00 |
0,00 |
|
|
A.6. Other operating charges: |
16.296.206,00 |
16.410.626,00 |
15.032.842,00 |
15.126.467,00 |
15.334.467,00 |
|
|
a) External services:
|
16.078.042,00 |
16.197.090,00 |
14.926.253,00 |
14.800.668,00 |
15.151.380,00 |
|
|
b) Taxes: |
218.164,00 |
213.536,00 |
106.589,00 |
224.600,00 |
183.087,00 |
|
|
c) Other operating
expenses: |
0,00 |
0,00 |
0,00 |
101.199,00 |
0,00 |
|
|
d) Allocation to
revision fund: |
0,00 |
0,00 |
0,00 |
0,00 |
0,00 |
|
|
A.I. OPERATING BENEFITS
(B.1+B.2+B.3+B.4-A.1-A.2-A.3-A.4-A.5-A.6): |
4.386.981,00 |
163.729,00 |
4.424.657,00 |
924.598,00 |
0,00 |
|
|
A.7. Financial and similar charges: |
1.340.895,00 |
912.489,00 |
1.372.555,00 |
1.224.411,00 |
872.030,00 |
|
|
a) Due to liabilities
with companies of the group: |
0,00 |
0,00 |
0,00 |
0,00 |
0,00 |
|
|
b) Due to liabilities
with associated companies: |
0,00 |
0,00 |
0,00 |
0,00 |
0,00 |
|
|
c) Due to other
debts.: |
1.180.899,00 |
753.217,00 |
1.040.907,00 |
957.922,00 |
951.037,00 |
|
|
d) Losses from
financial investments: |
159.996,00 |
159.272,00 |
331.648,00 |
266.489,00 |
-79.007,00 |
|
|
A.8. Changes in financial investment
provisions: |
0,00 |
0,00 |
0,00 |
0,00 |
0,00 |
|
|
A.9. Exchange losses: |
0,00 |
101.861,00 |
0,00 |
32.143,00 |
46.064,00 |
|
|
A.II. NET FINANCIAL INCOME (B.5+B.6+B.7+B.8-A.7-A.8-A.9):
|
0,00 |
0,00 |
2.957.465,00 |
3.376.082,00 |
3.701.443,00 |
|
|
A.III. PROFIT FROM ORDINARY ACTIVITIES (A.I+A.II-B.I-B.II):
|
3.745.273,00 |
0,00 |
7.382.122,00 |
4.300.680,00 |
2.165.300,00 |
|
|
A.10. Changes in provisions for
intangible, tangible and securities portfolio: |
382.461,00 |
380.728,00 |
792.783,00 |
783.685,00 |
-232.341,00 |
|
|
A.11. Losses from tangible and intangible fixed
assets and securities portfolio: |
1.222,00 |
0,00 |
0,00 |
0,00 |
18.384,00 |
|
|
A.12. Losses from transactions with own
shares and debentures: |
0,00 |
0,00 |
0,00 |
0,00 |
0,00 |
|
|
A.13. Extraordinary expenses: |
0,00 |
0,00 |
0,00 |
0,00 |
0,00 |
|
|
A.14. Expenses and losses of former
financial years: |
0,00 |
0,00 |
0,00 |
0,00 |
0,00 |
|
|
A.IV. EXTRAORDINARY PROFIT (B.9+B.10+B.11+B.12+B.13-A.10-A.11-A.12-A.13-A.14):
|
0,00 |
0,00 |
0,00 |
0,00 |
213.957,00 |
|
|
A.V. PROFIT BEFORE TAXES (A.III+A.IV-B.III-B.IV): |
3.381.420,00 |
0,00 |
6.692.034,00 |
3.643.670,00 |
2.379.257,00 |
|
|
A.15. Corporation tax: |
1.252.463,00 |
-390.331,00 |
824.882,00 |
-278.223,00 |
-656.525,00 |
|
|
A.16. Miscellaneous taxes: |
0,00 |
0,00 |
0,00 |
0,00 |
0,00 |
|
|
A.VI. FINANCIAL YEAR RESULTS (PROFIT) (A.V-A.15-A.16): |
2.128.957,00 |
0,00 |
5.867.152,00 |
3.921.893,00 |
3.035.782,00 |
|
MERCANTILE REGISTRY.
|
|
EQUIVALENCIA |
EQUIVALENCIA |
EQUIVALENCIA |
EQUIVALENCIA |
EQUIVALENCIA |
|
|
CREDIT |
2016 |
2015 |
2014 |
2013 |
2012 |
|
|
B)
INCOME ( B.1 to B.13): |
85.157.190,00 |
79.522.080,00 |
85.644.162,00 |
85.357.501,00 |
82.066.961,00 |
|
|
B.1. Net total sales: |
79.523.427,00 |
75.417.191,00 |
77.384.079,00 |
77.990.857,00 |
75.539.057,00 |
|
|
a) Sales: |
80.908.064,00 |
76.669.440,00 |
78.842.998,00 |
79.422.536,00 |
77.000.216,00 |
|
|
b) Rendering of
services: |
378.375,00 |
418.402,00 |
259.094,00 |
298.963,00 |
216.700,00 |
|
|
Returns and Rappel on
sales: |
-1.763.012,00 |
-1.670.651,00 |
-1.718.013,00 |
-1.730.642,00 |
-1.677.859,00 |
|
|
B.2. Stock increase of manufactured goods
and products in process: |
247.134,00 |
0,00 |
554.129,00 |
0,00 |
0,00 |
|
|
B.3. Works performed by the company for
fixed assets: |
126.127,00 |
50.659,00 |
55.741,00 |
27.959,00 |
66.536,00 |
|
|
B.4. Miscellaneous operating income:
|
4.541.485,00 |
3.611.492,00 |
3.217.498,00 |
2.579.374,00 |
1.841.831,00 |
|
|
a) Auxiliary income
and other from current management: |
4.541.485,00 |
3.583.329,00 |
3.181.044,00 |
2.468.741,00 |
1.664.995,00 |
|
|
b) Grants: |
0,00 |
28.163,00 |
36.454,00 |
21.642,00 |
164.078,00 |
|
|
c) Liabilities and
charges provisions surplus: |
0,00 |
0,00 |
0,00 |
88.991,00 |
12.758,00 |
|
|
B.I. PÉRDIDAS DE EXPLOTACIÓN
(A.1+A.2+A.3+A.4+A.5-A.6-B.1-B.2-B.3-B.4): |
0,00 |
0,00 |
0,00 |
0,00 |
1.536.143,00 |
|
|
B.5. Income from equity investment: |
0,00 |
0,00 |
4.000.000,00 |
4.500.000,00 |
3.108.850,00 |
|
|
a) In companies of
the group: |
0,00 |
0,00 |
4.000.000,00 |
4.500.000,00 |
3.108.850,00 |
|
|
b) In associated
companies: |
0,00 |
0,00 |
0,00 |
0,00 |
0,00 |
|
|
c) Third parties:
|
0,00 |
0,00 |
0,00 |
0,00 |
0,00 |
|
|
B.6. Income from other marketable
securities and long-term receivables: |
0,00 |
0,00 |
0,00 |
0,00 |
0,00 |
|
|
a) From companies of
the group: |
0,00 |
0,00 |
0,00 |
0,00 |
0,00 |
|
|
b) From associated
companies: |
0,00 |
0,00 |
0,00 |
0,00 |
0,00 |
|
|
c) From companies out
of the group: |
0,00 |
0,00 |
0,00 |
0,00 |
0,00 |
|
|
B.7. Miscellaneous interests or similar
income: |
365.801,00 |
213.910,00 |
188.622,00 |
132.636,00 |
1.510.687,00 |
|
|
a) From companies of
the group: |
350.992,00 |
213.802,00 |
188.438,00 |
131.311,00 |
60.686,00 |
|
|
b) From associated
companies: |
0,00 |
0,00 |
0,00 |
0,00 |
0,00 |
|
|
c) Miscellaneous
interests: |
353,00 |
108,00 |
184,00 |
1.325,00 |
0,00 |
|
|
d) Profit on
financial investment: |
14.456,00 |
0,00 |
0,00 |
0,00 |
1.450.001,00 |
|
|
B.8. Exchange positive differences: |
333.386,00 |
0,00 |
141.398,00 |
0,00 |
0,00 |
|
|
B.II. NEGATIVE FINANCIAL RESULTS (A.7+A.8+A.9-B.5-B.6-B.7-B.8):
|
641.708,00 |
800.440,00 |
0,00 |
0,00 |
0,00 |
|
|
B.III. LOSSES ON ORDINARY ACTIVITIES ( B.I + B.II - A.I - A.II
): |
0,00 |
636.711,00 |
0,00 |
0,00 |
0,00 |
|
|
B.9.Profit on disposal of both tangible
and intangible fixed assets and securities portfolio: |
0,00 |
209.502,00 |
4.448,00 |
121.113,00 |
0,00 |
|
|
B.10. Profit on transactions with own
shares and debentures: |
0,00 |
0,00 |
0,00 |
0,00 |
0,00 |
|
|
B.11. Capital grants transferred to profit
and loss: |
0,00 |
0,00 |
0,00 |
0,00 |
0,00 |
|
|
B.12. Extraordinary income: |
19.830,00 |
19.326,00 |
98.247,00 |
5.562,00 |
0,00 |
|
|
B.13. Income and profit of former
financial years: |
0,00 |
0,00 |
0,00 |
0,00 |
0,00 |
|
|
B.IV. NEGATIVE EXTRAORDINARY RESULTS
(A.10+A.11+A.12+A.13+A.14-B.9-B.10-B.11-B.12-B.13): |
363.853,00 |
151.900,00 |
690.088,00 |
657.010,00 |
0,00 |
|
|
B.V. LOSSES BEFORE TAXES (B.III+B.IV-A.III-A.IV): |
0,00 |
788.611,00 |
0,00 |
0,00 |
0,00 |
|
|
B.VI. RESULT OF THE PERIOD (LOSSES) (B.V+A.15+A.16): |
0,00 |
398.280,00 |
0,00 |
0,00 |
0,00 |
|
MERCANTILE REGISTRY.
|
CASHFLOW
STATEMENT
|
|
|
|
|
Model: Normal
>
Source of information: Data contained in this section is taken from the
information declared in the Annual Accounts submitted to the Trade Register.
|
Net
Rights Granted |
2016 |
2015 |
2014 |
2013 |
2012 |
|
|
1.
Fiscal year result before taxes.: 61100 |
3.381.420,00 |
-788.611,00 |
6.692.034,00 |
3.643.670,00 |
2.379.257,00 |
|
|
2.
Results adjustments.: 61200 |
4.020.478,00 |
3.496.456,00 |
-145.471,00 |
-514.461,00 |
245.160,00 |
|
|
a) Fixed Assets Amortization (+).: 61201 |
2.528.836,00 |
2.318.929,00 |
2.005.402,00 |
2.389.754,00 |
1.968.273,00 |
|
|
b) Obsolescence Allowances (+/-). : 61202 |
713.250,00 |
909.292,00 |
1.089.774,00 |
1.045.263,00 |
70.458,00 |
|
|
c) Variation in Provision (+/-). : 61203 |
288.201,00 |
-163.431,00 |
52.914,00 |
-121.508,00 |
360.480,00 |
|
|
e) Results on disposal of fixed assets (+/-). : 61205 |
1.222,00 |
-209.502,00 |
-4.448,00 |
-121.113,00 |
18.384,00 |
|
|
f) Results on disposal of financial instruments (+/-).:
61206 |
7.257,00 |
0,00 |
0,00 |
0,00 |
0,00 |
|
|
g) Financial income (-).: 61207 |
-351.345,00 |
-213.910,00 |
-4.188.622,00 |
-4.632.636,00 |
-3.169.536,00 |
|
|
h) Financial Expenses (+). : 61208 |
1.180.899,00 |
753.217,00 |
1.040.907,00 |
957.922,00 |
951.037,00 |
|
|
i) Exchange differences (+/-). : 61209 |
-333.386,00 |
101.861,00 |
-141.398,00 |
-32.143,00 |
46.064,00 |
|
|
j) Reasonable Value Variation in Financial Instruments (+/-).:
61210 |
-14.456,00 |
0,00 |
0,00 |
0,00 |
0,00 |
|
|
3.
Changes in current capital equity.: 61300 |
6.035.485,00 |
-1.570.215,00 |
-266.302,00 |
5.919.284,00 |
-1.428.538,00 |
|
|
a) Stock (+/-).: 61301 |
-367.520,00 |
-110.008,00 |
-796.301,00 |
1.923.011,00 |
-853.634,00 |
|
|
d) Debtors and other accounts receivable (+/-). : 61302 |
3.288.763,00 |
-2.690.735,00 |
1.589.748,00 |
887.674,00 |
-1.686.271,00 |
|
|
c) Other current assets (+/-). : 61303 |
-71.161,00 |
-93.072,00 |
14.456,00 |
-314.488,00 |
178.126,00 |
|
|
d) Creditors and other accounts payable (+/-). : 61304 |
3.183.042,00 |
1.300.907,00 |
-1.087.783,00 |
3.423.087,00 |
759.607,00 |
|
|
e) Other current liabilities (+/-).: 61305 |
2.361,00 |
22.693,00 |
13.578,00 |
0,00 |
173.634,00 |
|
|
4.
Cash Flows from Other Operating Activities: 61400 |
140.450,00 |
-613.797,00 |
2.285.811,00 |
3.354.857,00 |
2.129.056,00 |
|
|
a) Interest payments (-). : 61401 |
-738.369,00 |
-753.217,00 |
-1.040.907,00 |
-957.922,00 |
-951.037,00 |
|
|
b) Dividend payment collection (+). : 61402 |
0,00 |
0,00 |
4.000.000,00 |
4.500.000,00 |
3.108.850,00 |
|
|
c) Interest collection (+). : 61403 |
351.345,00 |
213.910,00 |
188.622,00 |
131.311,00 |
60.686,00 |
|
|
d) Income tax payment collection (payments) (+/-).: 61404 |
527.474,00 |
-74.490,00 |
-861.904,00 |
-318.532,00 |
-89.443,00 |
|
|
5.
Cash Flows from Operating Activities (1 + 2 + 3 + 4) : 61500 |
13.577.833,00 |
523.833,00 |
8.566.072,00 |
12.403.350,00 |
3.324.935,00 |
|
|
6.
Payments for investment (-).: 62100 |
-9.856.011,00 |
-7.378.682,00 |
-4.500.907,00 |
-6.130.586,00 |
-5.599.497,00 |
|
|
a) Companies of the group and affiliates. : 62101 |
-6.356.944,00 |
-3.215.694,00 |
-1.300.000,00 |
-4.254.708,00 |
-752.357,00 |
|
|
b) Intangible fixed assets. : 62102 |
-844.007,00 |
-762.566,00 |
-1.568.815,00 |
-936.556,00 |
-3.014.159,00 |
|
|
c) Fixed assets. : 62103 |
-2.360.773,00 |
-3.039.773,00 |
-1.420.790,00 |
-685.024,00 |
-1.805.925,00 |
|
|
e) Other financial assets. : 62105 |
-294.287,00 |
-360.649,00 |
-211.302,00 |
-254.298,00 |
-27.056,00 |
|
|
7.
Divestment payment collection (+). : 62200 |
211.140,00 |
744.307,00 |
384.375,00 |
2.569.401,00 |
1.196.000,00 |
|
|
a) Companies of the group and affiliates. : 62201 |
0,00 |
0,00 |
137.448,00 |
1.535.985,00 |
1.085.241,00 |
|
|
b) Intangible fixed assets. : 62202 |
0,00 |
154.576,00 |
161.973,00 |
834.140,00 |
0,00 |
|
|
c) Fixed assets. : 62203 |
2.680,00 |
214.228,00 |
5.701,00 |
189.776,00 |
0,00 |
|
|
e) Other financial assets. : 62205 |
208.460,00 |
375.503,00 |
79.253,00 |
9.500,00 |
110.759,00 |
|
|
8.
Cash Flow from Investing Activities (6+7) less Amortization: 62300 |
-9.644.871,00 |
-6.634.375,00 |
-4.116.532,00 |
-3.561.185,00 |
-4.403.497,00 |
|
|
9.
Payment collection and payments for equity instruments. : 63100 |
-10.000.000,00 |
0,00 |
-800.000,00 |
0,00 |
0,00 |
|
|
c) Acquisition of own equity instruments (-). : 63103 |
-10.000.000,00 |
0,00 |
-800.000,00 |
0,00 |
0,00 |
|
|
10.
Payment collection and payments for financial liabilities instruments.:
63200 |
15.103.613,00 |
5.634.241,00 |
-2.156.728,00 |
-5.573.741,00 |
3.940.319,00 |
|
|
a) Issuance : 63201 |
54.137.356,00 |
13.124.000,00 |
16.000.000,00 |
-5.573.741,00 |
12.112.375,00 |
|
|
2. Debts incurred with credit institutions (+). : 63203 |
54.137.356,00 |
13.124.000,00 |
16.000.000,00 |
-5.573.741,00 |
12.112.375,00 |
|
|
b) Repayment and amortization of : 63207 |
-39.033.743,00 |
-7.489.759,00 |
-18.156.728,00 |
0,00 |
-8.172.056,00 |
|
|
2. Debts incurred with credit institutions (-).: 63209 |
-39.033.743,00 |
-7.489.759,00 |
-18.128.996,00 |
0,00 |
-8.172.056,00 |
|
|
5. Other debts (-). : 63212 |
0,00 |
0,00 |
-27.732,00 |
0,00 |
0,00 |
|
|
11.
Payments from dividends and remunerations from other assets instruments. :
63300 |
0,00 |
0,00 |
-1.750.000,00 |
-2.250.000,00 |
-2.750.000,00 |
|
|
a) Dividends (-).: 63301 |
0,00 |
0,00 |
-1.750.000,00 |
-2.250.000,00 |
-2.500.000,00 |
|
|
b) Remuneration from other assets instruments (-).: 63302 |
0,00 |
0,00 |
0,00 |
0,00 |
-250.000,00 |
|
|
12.
Cash Flows from Financing Activities (9+10+11): 63400 |
5.103.613,00 |
5.634.241,00 |
-4.706.728,00 |
-7.823.741,00 |
1.190.319,00 |
|
|
D)
EFFECT OF EXCHANGE RATE CHANGES: 64000 |
0,00 |
0,00 |
0,00 |
0,00 |
0,00 |
|
|
E)
NET INCREASE/DECREASE OF CASH OR EQUIVALENT ASSETS (+/-5+/-8+/12+/-D) :
65000 |
9.036.575,00 |
-476.301,00 |
-257.188,00 |
1.018.424,00 |
111.757,00 |
|
|
Cash or equivalent assets as of beginning of the fiscal year.:
65100 |
441.277,00 |
917.578,00 |
1.174.766,00 |
156.342,00 |
44.585,00 |
|
|
Cash or equivalent assets as of end of the fiscal year.:
65200 |
9.477.852,00 |
441.277,00 |
917.578,00 |
1.174.766,00 |
156.342,00 |
|
|
FINANCIAL
DIAGNOSIS
|
>
Economic-Financial Comparative Analysis
Data used in the following ratios and indicators is taken from the
Annual Accounts submitted by the company to the TRADE REGISTER.
>
Comparison within the Sector
|
Cash
Flow |
2016 |
2015 |
Variación 2016 - 2015 |
|
|||
|
|
Empresa |
Sector |
Empresa |
Sector |
Empresa |
Sector |
|
|
Cash
Flow over Sales: |
0,11 % |
0,01 % |
-0,01 % |
0,06 % |
1.899,15 % |
-83,25 % |
|
|
Net
Financial Debt: |
6,24 |
2,32 |
11,93 |
2,88 |
-47,73 |
-19,67 |
|
|
Cash
Flow Yield: |
0,10 % |
0,01 % |
-0,01 % |
0,03 % |
1.744,37 % |
-82,98 % |
|
|
EBITDA
over Sales: |
8,70 % |
11,91 % |
3,29 % |
10,42 % |
164,18 % |
14,32 % |
|
|
Profitability |
2016 |
2015 |
Variación 2016 - 2015 |
|
|||
|
|
Empresa |
Sector |
Empresa |
Sector |
Empresa |
Sector |
|
|
Operating
economic profitability: |
7,45 % |
8,37 % |
0,70 % |
6,97 % |
965,52 % |
20,20 % |
|
|
Total
economic profitability: |
4,99 % |
4,69 % |
-0,04 % |
3,19 % |
11.272,50 % |
46,77 % |
|
|
Financial
profitability: |
10,25 % |
6,73 % |
-1,13 % |
4,14 % |
1.004,42 % |
62,51 % |
|
|
Margin:
|
5,21 % |
7,39 % |
0,47 % |
6,33 % |
1.003,73 % |
16,79 % |
|
|
Mark-up:
|
3,99 % |
6,56 % |
-1,02 % |
3,77 % |
490,81 % |
74,14 % |
|
|
Solvency |
2016 |
2015 |
Variación 2016 - 2015 |
|
|||
|
|
Empresa |
Sector |
Empresa |
Sector |
Empresa |
Sector |
|
|
Liquidity:
|
0,37 |
0,16 |
0,02 |
0,14 |
2.034,93 |
16,25 |
|
|
Acid
Test: |
1,43 |
0,90 |
1,13 |
0,86 |
25,88 |
4,25 |
|
|
Working
Capital / Investment: |
0,29 |
0,03 |
0,23 |
0,03 |
24,99 |
11,82 |
|
|
Solvency:
|
2,08 |
1,21 |
1,79 |
1,18 |
15,93 |
2,35 |
|
|
Indebtedness |
2016 |
2015 |
Variación 2016 - 2015 |
|
|||
|
|
Empresa |
Sector |
Empresa |
Sector |
Empresa |
Sector |
|
|
Indebtedness
level: |
3,10 |
1,25 |
1,18 |
1,32 |
163,73 |
-4,82 |
|
|
Borrowing
Composition: |
1,67 |
1,05 |
0,67 |
1,03 |
151,26 |
2,51 |
|
|
Repayment
Ability: |
9,98 |
9,34 |
17,22 |
11,10 |
-42,05 |
-15,80 |
|
|
Warranty:
|
1,32 |
1,81 |
1,85 |
1,77 |
-28,52 |
2,24 |
|
|
Generated
resources / Total creditors: |
0,08 |
0,09 |
0,06 |
0,08 |
24,96 |
13,78 |
|
|
Efficiency |
2016 |
2015 |
Variación 2016 - 2015 |
|
|||
|
|
Empresa |
Sector |
Empresa |
Sector |
Empresa |
Sector |
|
|
Productivity:
|
1,54 |
1,90 |
1,19 |
1,80 |
29,03 |
6,08 |
|
|
Turnover
of Collection Rights : |
4,77 |
5,10 |
3,63 |
5,22 |
31,24 |
-2,41 |
|
|
Turnover
of Payment Entitlements: |
4,14 |
3,55 |
4,94 |
3,68 |
-16,25 |
-3,58 |
|
|
Stock
rotation: |
5,32 |
8,09 |
5,39 |
7,73 |
-1,35 |
4,69 |
|
|
Assets
turnover: |
1,43 |
1,13 |
1,48 |
1,10 |
-3,46 |
2,92 |
|
|
Borrowing
Cost: |
1,71 |
2,36 |
1,76 |
2,45 |
-2,87 |
-3,70 |
|
>
Trend of indicators under the General Accounting Plan of 2007 (2016, 2015,
2014, 2013, 2012)
|
Cash
Flow |
2016 |
2015 |
2014 |
2013 |
2012 |
|
|
Cash
Flow over Sales: |
0,11 % |
-0,01 % |
0,00 % |
0,01 % |
0,00 % |
|
|
Net
Financial Debt: |
6,24 |
11,93 |
3,64 |
7,91 |
77,15 |
|
|
Cash
Flow Yield: |
0,10 % |
-0,01 % |
0,00 % |
0,01 % |
0,00 % |
|
|
EBITDA
over Sales: |
8,70 % |
3,29 % |
8,31 % |
4,14 % |
0,56 % |
|
|
Profitability |
2016 |
2015 |
2014 |
2013 |
2012 |
|
|
Operating
economic profitability: |
7,45 % |
0,70 % |
8,93 % |
2,08 % |
-2,96 % |
|
|
Total
economic profitability: |
4,99 % |
-0,04 % |
10,64 % |
6,30 % |
4,57 % |
|
|
Financial
profitability: |
10,25 % |
-1,13 % |
16,51 % |
12,17 % |
10,16 % |
|
|
Margin:
|
5,21 % |
0,47 % |
5,49 % |
1,30 % |
-2,01 % |
|
|
Mark-up:
|
3,99 % |
-1,02 % |
8,18 % |
4,52 % |
3,07 % |
|
|
Solvency |
2016 |
2015 |
2014 |
2013 |
2012 |
|
|
Liquidity:
|
0,37 |
0,02 |
0,05 |
0,04 |
0,01 |
|
|
Acid
Test: |
1,43 |
1,13 |
1,21 |
0,93 |
0,78 |
|
|
Working
Capital / Investment: |
0,29 |
0,23 |
0,26 |
0,16 |
0,12 |
|
|
Solvency:
|
2,08 |
1,79 |
2,03 |
1,52 |
1,39 |
|
|
Indebtedness |
2016 |
2015 |
2014 |
2013 |
2012 |
|
|
Indebtedness
level: |
3,10 |
1,18 |
0,98 |
1,19 |
1,41 |
|
|
Borrowing
Composition: |
1,67 |
0,67 |
0,78 |
0,47 |
0,44 |
|
|
Repayment
Ability: |
9,98 |
17,22 |
5,57 |
12,29 |
100,54 |
|
|
Warranty:
|
1,32 |
1,85 |
2,03 |
1,84 |
1,73 |
|
|
Generated
resources / Total creditors: |
0,08 |
0,06 |
0,26 |
0,18 |
0,08 |
|
|
Efficiency |
2016 |
2015 |
2014 |
2013 |
2012 |
|
|
Productivity:
|
1,54 |
1,19 |
1,54 |
1,23 |
1,03 |
|
|
Turnover
of Collection Rights : |
4,77 |
3,63 |
4,24 |
3,86 |
3,63 |
|
|
Turnover
of Payment Entitlements: |
4,14 |
4,94 |
5,79 |
4,83 |
6,37 |
|
|
Stock
rotation: |
5,32 |
5,39 |
5,20 |
5,81 |
4,93 |
|
|
Assets
turnover: |
1,43 |
1,48 |
1,63 |
1,60 |
1,48 |
|
|
Borrowing
Cost: |
1,71 |
1,76 |
2,91 |
2,42 |
2,26 |
|
COMPARATIVE
SECTORIAL BALANCE
|
Sector-based Comparison under the rules
of the New General Accounting Plan.
|
Net
Rights Granted |
Variación - |
|
|
|
Empresa |
Sector |
|
Net
Rights Granted |
Variación - |
|
|
|
Empresa |
Sector |
|
Net
Rights Granted |
Variación - |
|
|
|
Empresa |
Sector |
|
News
|
|
Alimarket |
02/05/2017 |
|
Cambios
en el accionariado de Intermas Nets |
|
|
Companies
related |
|
|
AURICA XXI SOCIEDAD DE CAPITAL RIESGO SA |
|
|
|
|
|
Public
Tenders and Works Won
|
No Public Tenders assigned to the name
of the company.
|
Research
Summary
|
|
The company was incorporated in 1996, which currently has a
shareholder equity that amounts to Euro 845,727 It is engaged in the
manufacture of plastic products. |
|
Answer
to additional question
|
|
It is engaged in the manufacture of tubular nets for the fruit and
vegetable sector, square nets and bi-oriented nets, for different sectors,
industrial gardening, in general, agriculture and others. It is also engaged
in the marketing of other meshes in natural products, for home. The subject
exports to Europe, North and South America and Africa. It is also engaged in
the domestic market. |
|
Sources
|
|
Registry of Commerce's Official Gazette. Own and external data bases
Company References |
FOREIGN EXCHANGE RATES
|
Currency |
Unit
|
Indian Rupees |
|
US Dollar |
1 |
INR 68.20 |
|
|
1 |
INR 89.58 |
|
Euro |
1 |
INR 78.79 |
|
Euro |
1 |
INR 78.81 |
Note :
Above are approximate rates obtained from sources believed to be correct
INFORMATION DETAILS
|
Analysis Done by
: |
VAR |
|
|
|
|
Report Prepared
by : |
SYL |
RATING EXPLANATIONS
|
Credit Rating |
Explanation |
Rating Comments |
|
A++ |
Minimum Risk |
Business dealings permissible with minimum
risk of default |
|
A+ |
Low Risk |
Business dealings permissible with low
risk of default |
|
A |
Acceptable Risk |
Business dealings permissible with
moderate risk of default |
|
B |
Medium Risk |
Business dealings permissible on a regular
monitoring basis |
|
C |
Medium High Risk |
Business dealings permissible preferably
on secured basis |
|
D |
High Risk |
Business dealing not recommended or on
secured terms only |
|
NB |
New Business |
No recommendation can be done due to
business in infancy stage |
|
NT |
No Trace |
No recommendation can be done as the
business is not traceable |
NB is stated where there is insufficient information to facilitate rating. However, it is not to be considered as unfavourable.
This score serves as a reference to assess
SC’s credit risk and to set the amount of credit to be extended. It is
calculated from a composite of weighted scores obtained from each of the major
sections of this report. The assessed factors are as follows:
·
Financial
condition covering various ratios
·
Company
background and operations size
·
Promoters
/ Management background
·
Payment
record
·
Litigation
against the subject
·
Industry
scenario / competitor analysis
·
Supplier
/ Customer / Banker review (wherever available)
This report is issued at
your request without any risk and responsibility on the part of MIRA INFORM
PRIVATE LIMITED (MIPL) or its officials.