|
|
|


MIRA INFORM REPORT
|
Report No. : |
516342 |
|
Report Date : |
26.06.2018 |
IDENTIFICATION DETAILS
|
Name : |
KLJ RESOURCES LIMITED |
|
|
|
|
Formerly Known
As : |
JAINSONS RESOURCES LIMITED |
|
|
|
|
Registered
Office : |
“Shanti Niketan Building”, Site No. 22, Ground Floor, 8, Camac Street,
Kolkata-700017, West Bengal |
|
Tel. No.: |
91-33-22823851 |
|
|
|
|
Country : |
India |
|
|
|
|
Financials (as
on) : |
31.03.2017 |
|
|
|
|
Date of
Incorporation : |
11.11.1986 |
|
|
|
|
CIN No.: [Company Identification
No.] |
L67120WB1986PLC041487 |
|
|
|
|
Capital
Investment / Paid-up Capital : |
INR 71.600 Million |
|
|
|
|
PAN No.: [Permanent Account No.] |
AABCK1181C |
|
|
|
|
GSTN : [Goods & Service Tax
Registration No.] |
Not Divulged |
|
|
|
|
Legal Form : |
The Company’s Shares are Listed on the Kolkata Stock Exchange but not
Traded Regularly. |
|
|
|
|
Line of Business
: |
Manufacturer of Chemicals and Chemical Products [Registered Activity] |
|
|
|
|
No. of Employees
: |
109 [Approximately] |
RATING & COMMENTS
(Mira Inform has adopted New Rating mechanism w.e.f. 23rd
January 2017)
|
MIRA’s Rating : |
A+ |
|
Credit Rating |
Explanation |
Rating Comments |
|
A+ |
Low Risk |
Business dealings permissible with low
risk of default |
|
Maximum Credit Limit : |
USD 8215000 |
|
|
|
|
Status : |
Good |
|
|
|
|
Payment Behaviour : |
Regular |
|
|
|
|
Litigation : |
Clear |
|
|
|
|
Comments : |
Subject was incorporated in the year 1986. The company is a
manufacturer of plasticizers and polymer compounds. As per the unaudited quarterly results of December 2017, the company
has achieved revenue of INR 3295.234 million along with average net profit
margin. For the financial records of 2017, the company has reported a decline
in its revenue as compared to the previous year but has managed to maintain
net profit of 2.68%. The overall financial position of the company seems to be sound marked
by healthy net worth base along with negligible debt balance sheet profile
and comfortable liquidity parameter. Business is active. Payment seems to be regular. In view of aforesaid, the company can be considered for business
dealings at usual trade terms and condition. NOTE: The company is
listed on Calcutta stock exchange. However, share price of the company is not
available. |
NOTES :
Any query related to this report can be made
on e-mail : infodept@mirainform.com
while quoting report number, name and date.
ECGC Country Risk Classification List
|
Country Name |
Previous Rating (31.12.2017) |
Current Rating (01.04.2018) |
|
India |
A1 |
A1 |
|
Risk Category |
ECGC
Classification |
|
Insignificant |
A1 |
|
Low Risk |
A2 |
|
Moderately Low Risk |
B1 |
|
Moderate Risk |
B2 |
|
Moderately High Risk |
C1 |
|
High Risk |
C2 |
|
Very High Risk |
D |
EXTERNAL AGENCY RATING
|
Rating Agency Name |
CRISIL |
|
Rating |
Long term rating = A+ |
|
Rating Explanation |
Adequate degree of safety and low credit risk |
|
Date |
26.04.2018 |
|
Rating Agency Name |
CRISIL |
|
Rating |
Short term rating = A1+ |
|
Rating Explanation |
Very strong degree of safety and carry lowest credit risk |
|
Date |
26.04.2018 |
RBI DEFAULTERS’ LIST STATUS
Subject’s name is not enlisted as a defaulter
in the publicly available RBI Defaulters’ list.
EPF (Employee Provident Fund) DEFAULTERS’ LIST STATUS
Subject’s name is not enlisted as a defaulter
in the publicly available EPF (Employee Provident Fund) Defaulters’ list as of
31-03-2018.
BIFR (Board for Industrial & Financial Reconstruction) LISTING
STATUS
Subject’s name is not listed as a Sick Unit in
the publicly available BIFR (Board for Industrial & Financial
Reconstruction) list as of 26.06.2018.
IBBI (Insolvency and Bankruptcy Board of India) LISTING STATUS
Subject’s name is not listed in the publicly
available IBBI (Insolvency and Bankruptcy Board of India) list as of report
date.
INFORMATION DECLINED BY
|
Name : |
Mr. Varun Kumar |
|
Designation : |
Accounts Department |
|
Contact No.: |
91-11-25459706 |
|
Date : |
23.06.2018 |
MANAGEMENT NON-COOPERATIVE [TEL. NO.: 91-33-22823851]
LOCATIONS
|
Registered Office : |
“Shanti Niketan Building”, Site No. 22, Ground Floor, 8, Camac Street,
Kolkata-700017, West Bengal, India |
|
Tel. No.: |
91-33-22823851 |
|
Fax No.: |
91-33-22823851 |
|
E-Mail : |
|
|
Website : |
|
|
|
|
|
Head Office : |
KLJ House, 63, Rama Marg, Najafgarh Road, New Delhi – 110 015, India |
|
Tel. No.: |
91-11-25459706 / 07 / 08 / 41427427-29 |
|
Fax No.: |
91-11-25459709/ 25436264 |
|
|
|
|
KLJ Complex, 70/B -39, Shivaji Marg, New Delhi – 110015, India |
|
|
|
|
|
Branch Offices : |
Located at: ·
Hubtown Solaris, 403/404 4th Floor, N.S. Phadke
Marg, Near East West Flyover,Andheri (East), Mumbai – 400069, Maharashtra,
India Tel. No.: 91-22-61830000-100 Fax No.: 9191-22-26244009 Email: mumbai@kljindia.com ·
Shanti Niketan Building, Suite No-22, Ground
Floor, Tel. No.: 91-33-22823251 Fax No.: 9191-33-22823851 ·
Silvassa Plast, No.11, 2nd Floor, Rosy Towers,
Nungabakkam Main Road, Nungabakkam, Chennai – 600039, Tamilnadu. India Tel. No.: 91-44-32000814-15 Fax No.: 91-44-45008589 |
DIRECTORS
AS ON: 31.03.2017
|
Name : |
Mr. Hemant Jain |
||||||||||||||||||||||||||||||||||||||||
|
Designation : |
Managing director |
||||||||||||||||||||||||||||||||||||||||
|
Address : |
6-B/9,N.E.A, Old Rajinder Nagar, New Delhi - 110060, India |
||||||||||||||||||||||||||||||||||||||||
|
Date of Birth/Age : |
18.08.1971 |
||||||||||||||||||||||||||||||||||||||||
|
Date of Appointment : |
01.04.2009 |
||||||||||||||||||||||||||||||||||||||||
|
PAN No.: |
AALPJ1370K |
||||||||||||||||||||||||||||||||||||||||
|
DIN No.: |
00506995 |
||||||||||||||||||||||||||||||||||||||||
|
Other
Directorship :
|
|||||||||||||||||||||||||||||||||||||||||
|
|
|
||||||||||||||||||||||||||||||||||||||||
|
Name : |
Mr. Dilip Kumar Karan |
||||||||||||||||||||||||||||||||||||||||
|
Designation : |
Director |
||||||||||||||||||||||||||||||||||||||||
|
Address : |
63, Rama Marg, New Delhi - 110015, India |
||||||||||||||||||||||||||||||||||||||||
|
Date of Birth/Age : |
06.02.1953 |
||||||||||||||||||||||||||||||||||||||||
|
Qualification : |
B.A |
||||||||||||||||||||||||||||||||||||||||
|
Date of Appointment : |
10.10.1997 |
||||||||||||||||||||||||||||||||||||||||
|
PAN No.: |
AALPK4457C |
||||||||||||||||||||||||||||||||||||||||
|
DIN No.: |
00061804 |
||||||||||||||||||||||||||||||||||||||||
|
Other Directorship:
|
|||||||||||||||||||||||||||||||||||||||||
|
|
|
||||||||||||||||||||||||||||||||||||||||
|
Name : |
Mr. Sudeep Mehta |
||||||||||||||||||||||||||||||||||||||||
|
Designation : |
Director |
||||||||||||||||||||||||||||||||||||||||
|
Address : |
Plot No.45, Shanti Niketan Colony, Mahendra Hills, East Marredpally,
Secunderabad, Hyderabad - 500026, Telangana, India |
||||||||||||||||||||||||||||||||||||||||
|
Date of Birth/Age : |
21.02.1970 |
||||||||||||||||||||||||||||||||||||||||
|
Qualification : |
M.B.A |
||||||||||||||||||||||||||||||||||||||||
|
Date of Appointment : |
29.09.2012 |
||||||||||||||||||||||||||||||||||||||||
|
PAN No.: |
AGBPM5143R |
||||||||||||||||||||||||||||||||||||||||
|
DIN No.: |
00483072 |
||||||||||||||||||||||||||||||||||||||||
|
Other Directorship:
|
|||||||||||||||||||||||||||||||||||||||||
|
|
|
||||||||||||||||||||||||||||||||||||||||
|
Name : |
Mr. Sukh Raj Sethia |
||||||||||||||||||||||||||||||||||||||||
|
Designation : |
Director |
||||||||||||||||||||||||||||||||||||||||
|
Address : |
M-1/A-1 Lajpat Nagar-2, New Delhi-110024, India |
||||||||||||||||||||||||||||||||||||||||
|
Date of Birth/Age : |
05.05.1956 |
||||||||||||||||||||||||||||||||||||||||
|
Qualification : |
M.B.A |
||||||||||||||||||||||||||||||||||||||||
|
Date of Appointment : |
31.03.2015 |
||||||||||||||||||||||||||||||||||||||||
|
PAN No.: |
AABPS2638H |
||||||||||||||||||||||||||||||||||||||||
|
DIN No.: |
01517777 |
||||||||||||||||||||||||||||||||||||||||
|
Other Directorship:
|
|||||||||||||||||||||||||||||||||||||||||
|
|
|||||||||||||||||||||||||||||||||||||||||
|
Name : |
Mrs. Kalpana Seth |
||||||||||||||||||||||||||||||||||||||||
|
Designation : |
Director |
||||||||||||||||||||||||||||||||||||||||
|
Address : |
C-37 B, Block-C, Rama Park, New Delhi - 110059, India |
||||||||||||||||||||||||||||||||||||||||
|
Date of Birth/Age : |
21.09.1962 |
||||||||||||||||||||||||||||||||||||||||
|
Qualification : |
H.Sc |
||||||||||||||||||||||||||||||||||||||||
|
Date of Appointment : |
29.09.2014 |
||||||||||||||||||||||||||||||||||||||||
|
PAN No.: |
BJVPS2326C |
||||||||||||||||||||||||||||||||||||||||
|
DIN No.: |
06949098 |
||||||||||||||||||||||||||||||||||||||||
|
Other Directorship:
|
|||||||||||||||||||||||||||||||||||||||||
|
|
|
||||||||||||||||||||||||||||||||||||||||
|
Name : |
Mr. Gulshan Rai Kanwal |
||||||||||||||||||||||||||||||||||||||||
|
Designation : |
Director |
||||||||||||||||||||||||||||||||||||||||
|
Address : |
House No-4, Road No-4, Punjabi Bagh, Extension S.O. (West),
Delhi-110026, India |
||||||||||||||||||||||||||||||||||||||||
|
Date of Birth/Age : |
16.11.1935 |
||||||||||||||||||||||||||||||||||||||||
|
Date of Appointment : |
31.03.2015 |
||||||||||||||||||||||||||||||||||||||||
|
PAN No.: |
ALBPK4491P |
||||||||||||||||||||||||||||||||||||||||
|
DIN No.: |
07145698 |
||||||||||||||||||||||||||||||||||||||||
KEY EXECUTIVES
|
Name : |
Mr. Praveen Sharma |
|
Designation : |
Company Secretary |
|
Address : |
K-117, Kirti Nagar, New Delhi - 110015, India |
|
Date of Birth/Age : |
13.09.1965 |
|
Date of Appointment : |
01.04.2009 |
|
PAN No.: |
ALQPS6513F |
|
|
|
|
Name : |
Mr. Suresh Chand Jalther |
|
Designation : |
CFO(KMP) |
|
Address : |
Gh-4/205, Meeera Apartment, Paschim Vihar West, Delhi – 110063, India |
|
Date of Appointment : |
16.01.2018 |
|
PAN No.: |
AAUPJ2690R |
|
|
|
|
Name : |
Mr. Varun Kumar |
|
Designation : |
Accounts Department |
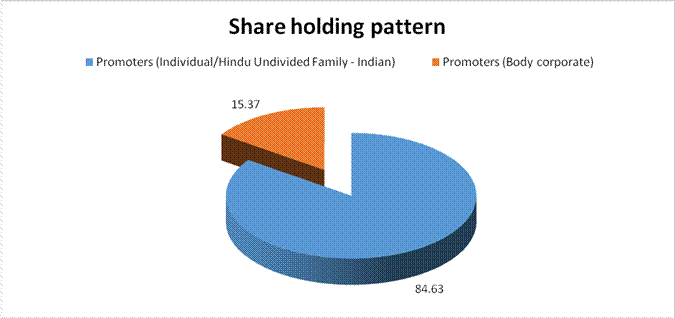
MAJOR SHAREHOLDERS / SHAREHOLDING PATTERN
AS ON: 31.03.2017
NOTE: SHAREHOLDING AND ALLOTTEES DETAILS FILE ATTACHED
AS ON: 29.09.2017
|
Equity Share Breakup |
Percentage of Holding |
|
Category |
|
|
Promoters (Individual/Hindu Undivided Family - Indian) |
52.09 |
|
Promoters (Body corporate) |
9.46 |
|
|
|
|
Total |
100.00 |
BUSINESS DETAILS
|
Line of Business : |
Manufacturer of Chemicals & Chemical Products [Registered Activity] |
||||||||||||||||||||||||||||||
|
|
|
||||||||||||||||||||||||||||||
|
Products : |
|
||||||||||||||||||||||||||||||
|
|
|
||||||||||||||||||||||||||||||
|
Brand Names : |
Not Available |
||||||||||||||||||||||||||||||
|
|
|
||||||||||||||||||||||||||||||
|
Agencies Held : |
Not Available |
||||||||||||||||||||||||||||||
|
|
|
||||||||||||||||||||||||||||||
|
Exports : |
Not Divulged |
||||||||||||||||||||||||||||||
|
|
|
||||||||||||||||||||||||||||||
|
Imports : |
Not Divulged |
||||||||||||||||||||||||||||||
|
|
|
||||||||||||||||||||||||||||||
|
Terms : |
|
||||||||||||||||||||||||||||||
|
Selling : |
Not Divulged |
||||||||||||||||||||||||||||||
|
|
|
||||||||||||||||||||||||||||||
|
Purchasing : |
Not Divulged |
PRODUCTION STATUS: NOT AVAILABLE
GENERAL INFORMATION
|
Suppliers : |
|
||||||||||||||||||||||||
|
|
|
||||||||||||||||||||||||
|
Customers : |
|
||||||||||||||||||||||||
|
|
|
||||||||||||||||||||||||
|
No. of Employees : |
109 [Approximately] |
||||||||||||||||||||||||
|
|
|
||||||||||||||||||||||||
|
Bankers : |
· State Bank of India(Lead Bank) Commercial Branch, N-3, South Extension Part-I, New Delhi - 110049, Delhi, India · HDFC Bank Limited HDFC Bank Housesenapati Bapat Marg, Lower Parel West, Mumbai - 400013, Maharashtra, India |
||||||||||||||||||||||||
|
|
|
||||||||||||||||||||||||
|
Facilities : |
|
|
|
|
|
Auditors : |
|
|
Name : |
R. Pugalia and Company Chartered Accountants |
|
Address : |
20 E, Lake Road, Kolkata – 700029, West Bengal, India |
|
Income-tax
PAN of auditor or auditor's firm : |
AFUPP1211P |
|
|
|
|
Memberships : |
Not Available |
|
|
|
|
Collaborators : |
Not Available |
|
|
|
|
Associate |
Priyatam Traders Private Limited [U51495DL1998PTC092469] |
|
|
|
|
Subsidiary
Company: |
KLJ Resources DMCC |
|
|
|
|
Other Related
Parties : |
· KLJ Polymers and Chemicals Limited [U24119DL1989PLC036883] · KLJ Plasticizers Limited [U25200DL2008PLC181088] · KLJ Organic Limited [U74899DL1995PLC068170] · Prithvi Sound Products Company Private Limited [U74899DL1953PTC002338] · HH Buildtech Private Limited [U45200DL2008PTC173709] · Hamlog Traders Private Limited [U51909DL1997PTC091106] · KLJ Developers Private Limited [U45201DL2006PTC145296] · DM Realty Developers Private Limited [U70200DL2008PTC173571] · Kinetic Impex Limited [L51909WB1985PLC039455] |
CAPITAL STRUCTURE
AFTER 29.09.2017
Authorised Capital :
|
No. of Shares |
Type |
Value |
Amount |
|
|
|
|
|
|
25000000 |
Equity Shares |
INR 10/- each |
INR 250.000 Million |
|
|
|
|
|
Issued, Subscribed & Paid-up Capital :
|
No. of Shares |
Type |
Value |
Amount |
|
|
|
|
|
|
10740000 |
Equity Shares |
INR 10/- each |
INR 107.400 Million |
|
|
|
|
|
Authorised Capital :
|
No. of Shares |
Type |
Value |
Amount |
|
|
|
|
|
|
25000000 |
Equity Shares |
INR 10/- each |
INR 250.000 Million |
|
|
|
|
|
Issued, Subscribed & Paid-up Capital :
|
No. of Shares |
Type |
Value |
Amount |
|
|
|
|
|
|
7160000 |
Equity Shares |
INR 10/- each |
INR 71.600 Million |
|
|
|
|
|
FINANCIAL DATA
[all figures are
in INR Million]
ABRIDGED
BALANCE SHEET
|
SOURCES OF FUNDS |
31.03.2017 |
31.03.2016 |
31.03.2015 |
|
I.
EQUITY AND LIABILITIES |
|
|
|
|
(1)Shareholders' Funds |
|
|
|
|
(a) Share Capital |
71.600 |
71.600 |
71.600 |
|
(b) Reserves & Surplus |
2803.650 |
2365.661 |
1966.781 |
|
(c) Money received against share warrants |
0.000 |
0.000 |
0.000 |
|
|
|
|
|
|
(2) Share Application
money pending allotment |
0.000 |
0.000 |
0.000 |
|
Total
Shareholders’ Funds (1) + (2) |
2875.250 |
2437.261 |
2038.381 |
|
|
|
|
|
|
(3)
Non-Current Liabilities |
|
|
|
|
(a) Long-term borrowings |
1.946 |
3.700 |
5.284 |
|
(b) Deferred tax liabilities (Net) |
0.000 |
0.000 |
0.000 |
|
(c)
Other long term liabilities |
91.990 |
90.298 |
91.068 |
|
(d)
long-term provisions |
8.530 |
8.686 |
6.459 |
|
Total
Non-current Liabilities (3) |
102.466 |
102.684 |
102.811 |
|
|
|
|
|
|
(4) Current Liabilities |
|
|
|
|
(a)
Short term borrowings |
245.269 |
535.193 |
425.456 |
|
(b)
Trade payables |
3212.547 |
2930.744 |
2638.435 |
|
(c)
Other current liabilities |
313.797 |
174.209 |
102.781 |
|
(d)
Short-term provisions |
241.000 |
212.000 |
11.111 |
|
Total
Current Liabilities (4) |
4012.613 |
3852.146 |
3177.783 |
|
|
|
|
|
|
TOTAL |
6990.329 |
6392.091 |
5318.975 |
|
|
|
|
|
|
II.
ASSETS |
|
|
|
|
(1) Non-current assets |
|
|
|
|
(a)
Fixed Assets |
|
|
|
|
(i)
Tangible assets |
91.926 |
99.934 |
98.569 |
|
(ii)
Intangible Assets |
0.273 |
0.446 |
0.731 |
|
(iii)
Capital work-in-progress |
0.000 |
0.000 |
0.000 |
|
(iv) Intangible assets under development |
0.000 |
0.000 |
0.000 |
|
(b) Non-current
Investments |
235.857 |
136.257 |
77.095 |
|
(c) Deferred tax assets
(net) |
11.270 |
10.321 |
7.914 |
|
(d) Long-term Loan
and Advances |
18.344 |
18.905 |
18.451 |
|
(e)
Other Non-current assets |
81.487 |
81.487 |
81.487 |
|
Total
Non-Current Assets |
439.157 |
347.350 |
284.247 |
|
|
|
|
|
|
(2) Current assets |
|
|
|
|
(a)
Current investments |
0.000 |
0.000 |
0.000 |
|
(b)
Inventories |
3346.156 |
1797.082 |
1886.754 |
|
(c)
Trade receivables |
1896.739 |
2953.000 |
1882.669 |
|
(d)
Cash and cash equivalents |
301.130 |
269.813 |
357.077 |
|
(e)
Short-term loans and advances |
993.776 |
1006.798 |
899.644 |
|
(f)
Other current assets |
13.371 |
18.048 |
8.584 |
|
Total
Current Assets |
6551.172 |
6044.741 |
5034.728 |
|
|
|
|
|
|
TOTAL |
6990.329 |
6392.091 |
5318.975 |
PROFIT
& LOSS ACCOUNT
|
|
PARTICULARS |
31.03.2017 |
31.03.2016 |
31.03.2015 |
|
|
|
SALES |
|
|
|
|
|
|
|
Revenue from Operations |
16315.030 |
16681.691 |
16085.530 |
|
|
|
Other Income |
189.086 |
181.299 |
182.789 |
|
|
|
TOTAL |
16504.116 |
16862.990 |
16268.319 |
|
|
|
|
|
|
|
|
Less |
EXPENSES |
|
|
|
|
|
|
|
Cost of Materials Consumed |
535.042 |
588.915 |
943.088 |
|
|
|
Purchases of Stock-in-Trade |
15958.450 |
14968.885 |
14534.443 |
|
|
|
Changes in inventories of finished goods, work-in-progress
and Stock-in-Trade |
(1476.594) |
144.391 |
(217.824) |
|
|
|
Employees benefits expense |
134.897 |
101.810 |
81.960 |
|
|
|
CSR expenditure |
19.500 |
0.000 |
0.000 |
|
|
|
Other expenses |
537.834 |
354.722 |
389.103 |
|
|
|
TOTAL |
15709.129 |
16158.723 |
15730.770 |
|
|
|
|
|
|
|
|
|
PROFIT
BEFORE INTEREST, TAX, DEPRECIATION AND AMORTISATION |
794.987 |
704.267 |
537.549 |
|
|
|
|
|
|
|
|
|
Less |
FINANCIAL
EXPENSES |
107.853 |
84.917 |
83.461 |
|
|
|
|
|
|
|
|
|
|
PROFIT
BEFORE TAX, DEPRECIATION AND AMORTISATION |
687.134 |
619.350 |
454.088 |
|
|
|
|
|
|
|
|
|
Less/ Add |
DEPRECIATION/
AMORTISATION |
10.055 |
11.776 |
15.512 |
|
|
|
|
|
|
|
|
|
|
PROFIT BEFORE
TAX |
677.079 |
607.574 |
438.576 |
|
|
|
|
|
|
|
|
|
Less |
TAX |
239.090 |
208.694 |
146.319 |
|
|
|
|
|
|
|
|
|
|
PROFIT AFTER TAX
|
437.989 |
398.880 |
292.257 |
|
|
|
|
|
|
|
|
|
|
EARNINGS IN
FOREIGN CURRENCY |
|
|
|
|
|
|
|
Export of Goods calculated on F.O.B. basis |
12.269 |
20.359 |
34.944 |
|
|
|
Interest |
0.000 |
1.349 |
0.382 |
|
|
TOTAL EARNINGS |
12.269 |
21.708 |
35.326 |
|
|
|
|
|
|
|
|
|
|
IMPORTS |
|
|
|
|
|
|
|
Materials (Chemicals) |
15052.483 |
13979.717 |
13871.929 |
|
|
|
|
|
|
|
|
|
Earnings Per
Share (INR) |
61.17 |
55.71 |
40.82 |
|
CURRENT MATURITIES OF LONG TERM DEBT DETAILS
|
PARTICULARS |
31.03.2017 |
31.03.2016 |
31.03.2015 |
|
Current Maturities of Long term debt |
1.755 |
1.583 |
1.428 |
|
|
|
|
|
|
Net cash flows from (used in) operations |
776.180 |
280.869 |
657.899 |
|
|
|
|
|
|
Net cash flows from (used in) operating activities |
514.879 |
46.692 |
476.351 |
KEY
RATIOS
EFFICIENCY RATIOS
|
PARTICULARS |
31.03.2017 |
31.03.2016 |
31.03.2015 |
|
Average Collection Days (Sundry
Debtors / Income * 365 Days) |
42.43 |
64.61 |
42.72 |
|
|
|
|
|
|
Account Receivables Turnover (Income / Sundry Debtors) |
8.60 |
5.65 |
8.54 |
|
|
|
|
|
|
Average Payment Days (Sundry Creditors / Purchases * 365 Days) |
71.09 |
68.76 |
62.22 |
|
|
|
|
|
|
Inventory Turnover (Operating Income / Inventories) |
0.24 |
0.39 |
0.28 |
|
|
|
|
|
|
Asset Turnover (Operating Income / Net Fixed Assets) |
8.62 |
7.02 |
5.41 |
LEVERAGE RATIOS
|
PARTICULARS |
31.03.2017 |
31.03.2016 |
31.03.2015 |
|
Debt Ratio ((Borrowing
+ Current Liabilities) / Total Assets) |
0.57 |
0.60 |
0.60 |
|
|
|
|
|
|
Debt Equity Ratio (Total Liability / Networth) |
0.09 |
0.22 |
0.21 |
|
|
|
|
|
|
Current Liabilities to Networth (Current Liabilities / Net Worth) |
1.40 |
1.58 |
1.56 |
|
|
|
|
|
|
Fixed Assets to Networth (Net Fixed Assets / Networth) |
0.03 |
0.04 |
0.05 |
|
|
|
|
|
|
Interest Coverage Ratio (PBIT / Financial Charges) |
7.37 |
8.29 |
6.44 |
PROFITABILITY RATIOS
|
PARTICULARS |
|
31.03.2017 |
31.03.2016 |
31.03.2015 |
|
Net Profit Margin ((PAT / Sales) * 100) |
% |
2.68 |
2.39 |
1.82 |
|
|
|
|
|
|
|
Return on Total Assets ((PAT / Total Assets) * 100) |
% |
6.27 |
6.24 |
5.49 |
|
|
|
|
|
|
|
Return on Investment (ROI) ((PAT / Networth) * 100) |
% |
15.23 |
16.37 |
14.34 |
SOLVENCY RATIOS
|
PARTICULARS |
31.03.2017 |
31.03.2016 |
31.03.2015 |
|
Current Ratio (Current
Assets / Current Liabilities) |
1.63 |
1.57 |
1.58 |
|
|
|
|
|
|
Quick Ratio ((Current Assets – Inventories) / Current
Liabilities) |
0.80 |
1.10 |
0.99 |
|
|
|
|
|
|
G-Score Ratio Financial (Networth / Total Assets) |
0.41 |
0.38 |
0.38 |
|
|
|
|
|
|
G-Score Ratio Debt (Debts / Equity Capital) |
3.48 |
7.55 |
6.04 |
|
|
|
|
|
|
G-Score Ratio Liquidity (Total Current Assets / Total Current Liabilities) |
1.63 |
1.57 |
1.58 |
Total
Liability = Short-term Debt + Long-term Debt + Current Maturities of Long-term
debts
FINANCIAL ANALYSIS
[all figures are
in INR Million]
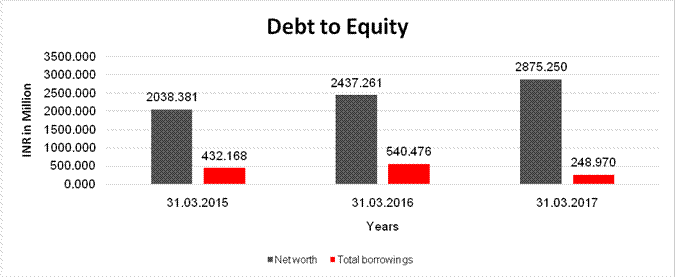
DEBT EQUITY RATIO
|
Particular |
31.03.2015 |
31.03.2016 |
31.03.2017 |
|
|
INR
In Million |
INR
In Million |
INR
In Million |
|
Share Capital |
71.600 |
71.600 |
71.600 |
|
Reserves & Surplus |
1966.781 |
2365.661 |
2803.650 |
|
Money received against share
warrants |
0.000 |
0.000 |
0.000 |
|
Share Application money
pending allotment |
0.000 |
0.000 |
0.000 |
|
Net worth |
2038.381 |
2437.261 |
2875.250 |
|
|
|
|
|
|
long-term borrowings |
5.284 |
3.700 |
1.946 |
|
Short term borrowings |
425.456 |
535.193 |
245.269 |
|
Current Maturities of Long
term debt |
1.428 |
1.583 |
1.755 |
|
Total
borrowings |
432.168 |
540.476 |
248.970 |
|
Debt/Equity
ratio |
0.212 |
0.222 |
0.087 |
YEAR-ON-YEAR GROWTH
|
Year
on Year Growth |
31.03.2015 |
31.03.2016 |
31.03.2017 |
|
|
INR
In Million |
INR
In Million |
INR
In Million |
|
Sales |
16085.530 |
16681.691 |
16315.030 |
|
|
|
3.706 |
(2.198) |
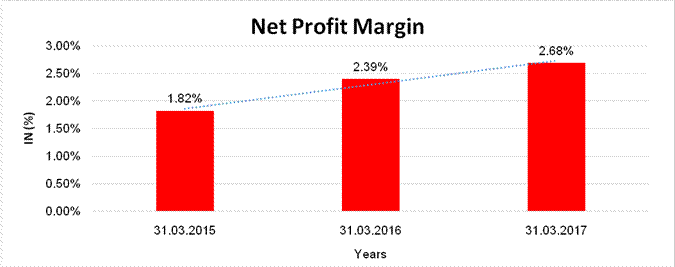
NET PROFIT MARGIN
|
Net
Profit Margin |
31.03.2015 |
31.03.2016 |
31.03.2017 |
|
|
INR
In Million |
INR
In Million |
INR
In Million |
|
Sales |
16085.530 |
16681.691 |
16315.030 |
|
Profit |
292.257 |
398.880 |
437.989 |
|
|
1.82% |
2.39% |
2.68% |
LOCAL AGENCY FURTHER INFORMATION
|
Sr. No. |
Check list by
info agents |
Available in
Report (Yes/No) |
|
1 |
Year of establishment |
Yes |
|
2 |
Constitution of the entity -Incorporation
details |
Yes |
|
3 |
Locality of the entity |
Yes |
|
4 |
Premises details |
No |
|
5 |
Buyer visit details |
-- |
|
6 |
Contact numbers |
Yes |
|
7 |
Name of the person contacted |
Yes |
|
8 |
Designation of contact person |
Yes |
|
9 |
Promoter’s background |
Yes |
|
10 |
Date of Birth of Proprietor / Partners /
Directors |
Yes |
|
11 |
Pan Card No. of Proprietor / Partners |
Yes |
|
12 |
Voter Id Card No. of Proprietor / Partners |
No |
|
13 |
Type of business |
Yes |
|
14 |
Line of Business |
Yes |
|
15 |
Export/import details (if applicable) |
No |
|
16 |
No. of employees |
No |
|
17 |
Details of sister concerns |
Yes |
|
18 |
Major suppliers |
No |
|
19 |
Major customers |
No |
|
20 |
Banking Details |
Yes |
|
21 |
Banking facility details |
Yes |
|
22 |
Conduct of the banking account |
-- |
|
23 |
Financials, if provided |
Yes |
|
24 |
Capital in the business |
Yes |
|
25 |
Last accounts filed at ROC, if applicable |
Yes |
|
26 |
Turnover of firm for last three years |
Yes |
|
27 |
Reasons for variation <> 20% |
-- |
|
28 |
Estimation for coming financial year |
No |
|
29 |
Profitability for last three years |
Yes |
|
30 |
Major shareholders, if available |
Yes |
|
31 |
External Agency Rating, if available |
Yes |
|
32 |
Litigations that the firm/promoter
involved in |
-- |
|
33 |
Market information |
-- |
|
34 |
Payments terms |
No |
|
35 |
Negative Reporting by Auditors in the
Annual Report |
No |
INDEX OF CHARGES
|
SNO |
SRN |
CHARGE ID |
CHARGE HOLDER NAME |
DATE OF CREATION |
DATE OF MODIFICATION |
DATE OF SATISFACTION |
AMOUNT |
ADDRESS |
|
1 |
B64749492 |
10391785 |
STATE BANK OF
INDIA(LEAD BANK) |
22/10/2012 |
02/11/2012 |
- |
6200000000.0 |
COMMERCIAL BRANCHN-3,
SOUTH EXTENSION PART-INEW DELHIDL110049IN |
|
2 |
B72094717 |
10233955 |
HDFC BANK LIMITED |
28/07/2010 |
04/05/2012 |
25/03/2013 |
350000000.0 |
HDFC BANK
HOUSESENAPATI BAPAT MARGLOWER PAREL WMUMBAIMH400013IN |
|
3 |
B71410773 |
80031331 |
PUNJAB NATIONAL
BANK |
26/06/2006 |
01/01/2011 |
21/03/2013 |
1310000000.0 |
BO : LARGE
CORPORATE BRANCHTOLSTOY HOUSE, TOLSTOY MARGNEW DELHIDL110001IN |
|
4 |
B64062128 |
10176414 |
STATE BANK OF INDIA |
13/08/2009 |
15/02/2012 |
05/12/2012 |
3650000000.0 |
COMMERCIAL
BRANCHA-5 SOUTH EXTENSION PART-INEW DELHIDL110048IN |
UNSECURED LOANS
|
PARTICULARS |
31.03.2017 (INR
In Million) |
31.03.2016 (INR
In Million) |
|
SHORT TERM BORROWINGS |
|
|
|
Loans and advances from related parties |
0.763 |
11.298 |
|
|
|
|
|
Total |
0.763 |
11.298 |
PERFORMANCE AND STATE OF COMPANY’S AFFAIRS
During the year, the Company has earned a total revenue of INR 16504.100 million as compared to INR 16863.000 million in the corresponding previous year. Profit after Tax (PAT) stood at Rs.438.000 million as against INR 398.900 million in the previous year, thereby registering a growth of 9.8% on year on year basis.
PERFORMANCE AND STATE OF
COMPANY’S AFFAIRS
During the year, the Company has earneda total revenue of INR16504.100 million as compared to INR 16863.000 million in the corresponding previous year. Profit after Tax (PAT) stood at INR 438.000 million as against INR 398.900 million in the previous year, thereby registering a growth of 9.8% on year on year basis.
The state of affairs of the Company is presented as part of the
Management Discussion and
Analysis Report forming part of the Annual Report
MANAGEMENT
DISCUSSION AND ANALYSIS REPORT FOR THE YEAR 2016 -2017
INDIAN ECONOMY
The Economic Survey 2016-17, was tabled in the Parliament on January 31, 2017. The Survey forecasts a growth rate of 6.75 to 7.5 per cent for Financial Year 2017-18, as compared to the expected growth rate of 6.5 per cent in Financial Year 2016-17. Over the medium run, the implementation of the Goods and Services Tax (GST), follow-up to demonetization and enacting other structural reforms should take the economy towards its potential real GDP growth of 8 per cent to 10 per cent.
Latest round of FICCI’s Economic Outlook Survey puts across a median GDP growth forecast of 7.4% for the current fiscal year, with a minimum and a maximum range of 7.0% and 7.6% respectively. The survey was conducted during March/April 2017 amongst economists belonging to the industry, banking and financial services sector.
Exports have been rising for seven consecutive months ending March 2017. Exports grew by 27.5% in March 2017 vis-à-vis (-) 4.7% growth reported in the corresponding month previous year. Based on the responses of the
participating economists, the median growth forecast for exports has been put at 5.9% for fiscal year 2017- 18 and for imports at 7.1%.
INDUSTRY OVERVIEW
The chemical industry is a knowledge intensive as well as capital intensive industry. It is an integral constituent of the growing Indian Industry. It includes basic chemicals and its products, petrochemicals, fertilizers, pesticides, paints, varnishes, gases, soaps, perfumes and toiletry and pharmaceuticals. It is one of the most diversified of all industrial sectors covering thousands of commercial products. This Industry occupies a pivotal position in meeting basic needs and improving quality of life. The industry is the main stay of industrial and agricultural development of the country and provides building blocks for several downstream industries, such as textiles, papers, paints, varnishes, soaps, detergents, pharmaceuticals, etc.
Petrochemicals, which comprise of plastic and host of other chemicals are downstream hydrocarbons derived from crude oil and natural gas. The value additions in the petrochemicals chain offer immense possibilities and cater to the need of agriculture, packaging, infrastructure, healthcare, furniture, automobiles, information technology, power, electronics and telecommunication, irrigation, drinking water, construction and a host of other articles of daily and specialized usage amidst other emerging areas.
The Chemical Industry is a highly human resource intensive industry employing a large number of people. Globally, nearly 20 million people are employed in this industry. The diversification within the chemical industry is large and covers more than 80,000 commercial products with myriad applications that one needs to only look around oneself to gauge how deeply connected one is to the world of chemicals.
The production of major chemicals and petrochemicals in 2016-17 (up to November 2016) was 17,162 thousand MT, compared to 16,255 thousand MT in 2015-16 (up to November 2015) implying growth of 5.6%.
The production of polymers account for around 59% of the total production of basic major petrochemicals. The production of basic major petrochemicals in 2016-17 (up to November 2016) was 10,423 thousand MT, compared to 9,725 thousand MT in 2015-16 (up to November 2015) implying a growth of 7.2%.
Government recognizes Chemical industry as a key growth element of Indian economy. In Chemical Sector, 100% FDI is permissible. Manufacture of most of chemical products is delicenced.
BUSINESS OVERVIEW
The Company is primarily engaged in the business of trading of petrochemical products. Over a period of time the
Company has become one of the leading importer of petrochemical products in India. Due to increasing demand of finished products in India as well as in overseas market, the Company has also entered into manufacturing of wide range of speciality chemicals and de-aromatised solvents including blending of base oils to take lead in the market.
Product range of the Company covers a range of paraffins, alcohols, aromatics, ketones, monomers, acetates and amines to name a few. The Company has strong tie-ups with leading global players which ensure cost effective and uninterrupted supply to its customers. With pan India presence of marketing network, storage tanks with sales of over 280,000 mt/per year, drumming and distribution facilities, the Company leverages on its modern lab testing facilities to provide comprehensive and complete solutions, ensuring satisfaction across the value chain.
During the year, on standalone basis the Company achieved total revenue of Rs.1631.5 million from operations as compared to INR 166.800 million in the corresponding previous year. EBIDTA for the year was INR 814.400 million as compared to INR 704.200 million for the previous year registering a growth of 15.65%. Profit after Tax (PAT) stood at INR 437.900 million as against INR 398.800 million in the previous year, thereby registering a growth of 9.8% on an year on year basis.
During the year, on consolidated basis the Company achieved total revenue of INR1730.93 million from operations as compared to INR 17082.200 million in the corresponding previous year. EBIDTA for the year was INR 902.500 million as compared to INR 767.900 million for the previous year registering a growth of 17.53%. Profit after Tax (PAT) stood at INR 51.76 million as against INR 456.900 million in the previous year, thereby registering a growth of 13.28% on an year on year basis.
FUTURE OUTLOOK
The chemical industry which had long been out of favor is finally getting its groove back. Despite a spate of headwinds, the highly cyclical industry put up a decent performance in 2016, helped by continued strength across
automotive and construction markets, two major end-use markets for chemicals.
Chemical companies continue to shift their focus on attractive, growth markets in an effort to cut their exposure on
other businesses that are grappling with weak demand. The industry is also seeing a pick-up in consolidation activities as chemical makers are increasingly looking for cost synergy opportunities and enhanced operational scale in a stilldifficult global economic environment.
|
Particulars |
Quarter Ended |
Nine Months Ended |
|
|
|
31.12.2017 [Unaudited] |
30.09.2017 [Unaudited] |
31.12.2017 [Unaudited] |
|
Revenue from operations |
3295.234 |
2787.230 |
9438071 |
|
Other income |
37.937 |
34.224 |
109.754 |
|
Total income |
3333.171 |
2821.454 |
9547.825 |
|
|
|
|
|
|
Expenses |
|
|
|
|
a) Cost of materials consumed |
148.281 |
160.736 |
457.267 |
|
b) Purchase of stock-in trade |
3094.339 |
2783.960 |
7593.810 |
|
c) Change in inventories of finished goods stock in trade and work in progress |
(329.034) |
(380.877) |
529.507 |
|
d) employee benefit expenses |
40.241 |
41.983 |
107.650 |
|
e) Finance costs |
12.904 |
19.738 |
49.928 |
|
f) Depreciation and amortization expenses |
3.500 |
1.814 |
7.950 |
|
g) Other expenses |
35.192 |
17.435 |
82.618 |
|
Total Expenses |
3005.423 |
2644.790 |
8828.729 |
|
|
|
|
|
|
Profit/(Loss) before exceptional items and tax |
327.748 |
176.664 |
719.096 |
|
|
|
|
|
|
Exceptional items |
-- |
-- |
-- |
|
|
|
|
|
|
Profit/(Loss)
before tax |
327.748 |
176.664 |
719.096 |
|
|
|
|
|
|
Tax expenses |
|
|
|
|
a) Current tax |
112.257 |
59.482 |
244.822 |
|
|
|
|
|
|
b) Deferred tax |
-- |
-- |
-- |
|
|
|
|
|
|
Profit/(Loss) for
the period |
215.490 |
117.182 |
474.274 |
|
|
|
|
|
|
Other comprehensive
income |
|
|
|
|
A. i) Items that will not be reclassified to profit or loss |
-- |
9.051 |
9.051 |
|
ii) Income tax relating to items that will not be reclassified to profit or loss |
-- |
2.088 |
2.088 |
|
|
|
|
|
|
B. i) Items that will be reclassified to profit or loss |
1.600 |
3.200 |
4.800 |
|
ii) Income tax relating to items that will be reclassified to profit or loss |
0.554 |
1.107 |
1.661 |
|
Total comprehensive income for the period and other comprehensive income for the period |
214.444 |
122.053 |
478.098 |
|
|
|
|
|
|
Earning per share
of face value of INR 10/- each |
|
|
|
|
Basic and Diluted |
29.95 |
17.05 |
66.77 |
CONTINGENT
LIABILITIES:
|
Particulars |
31.03.2017 (INR
In Million) |
31.03.2016 (INR
In Million) |
|
Net Outstanding LC’s with Bank |
138.406 |
944.401 |
|
Bank Guarantees |
3.632 |
0.175 |
|
Corporate Guarantee issued to Bank |
648.386 |
663.329 |
|
Company filed suits for recovery of arrears of rent & maintenance, possession of leased premises and damages against one tenant, before the Delhi High Court. While the Hon’ble Court has decreed the suits for arrears of rent and maintenance, and has allowed possessions to the company, the claim in respect of damages is pending. |
||
FIXED ASSETS:
- Land
- Buildings
- Plant and Equipment
- Furniture and Fixtures
- Vehicles
- Computer Equipment
CMT REPORT (Corruption, Money Laundering & Terrorism]
The Public Notice information has been collected from various sources including
but not limited to: The Courts, India Prisons Service, Interpol, etc.
1] INFORMATION ON
DESIGNATED PARTY
No records exist designating subject or any of its beneficial owners,
controlling shareholders or senior officers as terrorist or terrorist organization
or whom notice had been received that all financial transactions involving
their assets have been blocked or convicted, found guilty or against whom a
judgement or order had been entered in a proceedings for violating
money-laundering, anti-corruption or bribery or international economic or
anti-terrorism sanction laws or whose assets were seized, blocked, frozen or
ordered forfeited for violation of money laundering or international
anti-terrorism laws.
2] Court Declaration :
No records exist to suggest that subject is
or was the subject of any formal or informal allegations, prosecutions or other
official proceeding for making any prohibited payments or other improper
payments to government officials for engaging in prohibited transactions or
with designated parties.
3] Asset Declaration :
No records exist to suggest that the property or assets of the subject
are derived from criminal conduct or a prohibited transaction.
4] Record on Financial
Crime :
Charges or conviction
registered against subject: None
5] Records on Violation of
Anti-Corruption Laws :
Charges or
investigation registered against subject: None
6] Records on Int’l
Anti-Money Laundering Laws/Standards :
Charges or
investigation registered against subject: None
7] Criminal Records
No
available information exist that suggest that subject or any of its principals
have been formally charged or convicted by a competent governmental authority
for any financial crime or under any formal investigation by a competent government
authority for any violation of anti-corruption laws or international anti-money
laundering laws or standard.
8] Affiliation with
Government :
No record
exists to suggest that any director or indirect owners, controlling
shareholders, director, officer or employee of the company is a government
official or a family member or close business associate of a Government
official.
9] Compensation Package :
Our market
survey revealed that the amount of compensation sought by the subject is fair
and reasonable and comparable to compensation paid to others for similar
services.
10] Press Report :
No press reports / filings exists on
the subject.
CORPORATE GOVERNANCE
MIRA INFORM as part of its Due Diligence do provide comments on
Corporate Governance to identify management and governance. These factors often
have been predictive and in some cases have created vulnerabilities to credit
deterioration.
Our Governance Assessment focuses principally on the interactions
between a company’s management, its Board of Directors, Shareholders and other
financial stakeholders.
CONTRAVENTION
Subject is not known to have contravened any existing local laws,
regulations or policies that prohibit, restrict or otherwise affect the terms and
conditions that could be included in the agreement with the subject.
FOREIGN EXCHANGE RATES
|
Currency |
Unit
|
INR |
|
US Dollar |
1 |
INR 68.15 |
|
UK Pound |
1 |
INR 90.27 |
|
Euro |
1 |
INR 79.35 |
INFORMATION DETAILS
|
Information Gathered
by : |
SWT |
|
|
|
|
Analysis Done by
: |
NYT |
|
|
|
|
Report Prepared
by : |
ARC |
SCORE FACTORS
|
DEMERIT POINTS |
|
|
|
--BANK CHARGES |
YES/NO |
YES |
|
--LITIGATION |
YES/NO |
NO |
|
--OTHER ADVERSE INFORMATION |
YES/NO |
NO |
|
MERIT POINTS |
|
|
|
--SOLE DISTRIBUTORSHIP |
YES/NO |
NO |
|
--EXPORT ACTIVITIES |
YES/NO |
NO |
|
--AFFILIATION |
YES/NO |
YES |
|
--LISTED |
YES/NO |
NO |
|
--OTHER MERIT FACTORS |
YES/NO |
YES |
RATING EXPLANATIONS
|
Credit Rating |
Explanation |
Rating Comments |
|
A++ |
Minimum Risk |
Business dealings permissible with minimum
risk of default |
|
A+ |
Low Risk |
Business dealings permissible with low
risk of default |
|
A |
Acceptable Risk |
Business dealings permissible with moderate
risk of default |
|
B |
Medium Risk |
Business dealings permissible on a regular
monitoring basis |
|
C |
Medium High Risk |
Business dealings permissible preferably
on secured basis |
|
D |
High Risk |
Business dealing not recommended or on secured
terms only |
|
NB |
New Business |
No recommendation can be done due to
business in infancy stage |
|
NT |
No Trace |
No recommendation can be done as the
business is not traceable |
NB is stated where there is insufficient information to facilitate rating. However, it is not to be considered as unfavourable.
This score serves as a reference to assess
SC’s credit risk and to set the amount of credit to be extended. It is
calculated from a composite of weighted scores obtained from each of the major
sections of this report. The assessed factors are as follows:
·
Financial
condition covering various ratios
·
Company
background and operations size
·
Promoters
/ Management background
·
Payment
record
·
Litigation
against the subject
·
Industry
scenario / competitor analysis
·
Supplier
/ Customer / Banker review (wherever available)
This report is issued at
your request without any risk and responsibility on the part of MIRA INFORM
PRIVATE LIMITED (MIPL) or its officials.