|
|
|


MIRA
INFORM REPORT
|
Report No. : |
498341 |
|
Report Date : |
15.03.2018 |
IDENTIFICATION DETAILS
|
Name : |
JINDAL STAINLESS LIMITED (w.e.f. 07.12.2011) |
|
|
|
|
Formerly Known
As : |
JSL STAINLESS LIMITED (w.e.f. 2010) JSL LIMITED (w.e.f. 2008) JINDAL STAINLESS LIMITED |
|
|
|
|
Registered
Office : |
O. P. Jindal
Marg, Hisar – 125005, Haryana |
|
Tel. No.: |
91-1662-222471- 83 |
|
|
|
|
Country : |
India |
|
|
|
|
Financials (as
on) : |
31.03.2017 |
|
|
|
|
Date of
Incorporation : |
29.09.1980 |
|
|
|
|
Com. Reg. No.: |
05-010901 |
|
|
|
|
Capital Investment
/ Paid-up Capital : |
INR 798.900 Million |
|
|
|
|
CIN No.: [Company Identification
No.] |
L26922HR1980PLC010901 |
|
|
|
|
IEC No.: [Import-Export Code No.] |
0588085146 |
|
|
|
|
TAN No.: [Tax Deduction &
Collection Account No.] |
RTKJ01408B |
|
|
|
|
GSTN : [Goods & Service Tax
Registration No.] |
Not Divulged |
|
|
|
|
PAN No.: [Permanent Account No.] |
AABCJ1969M |
|
|
|
|
Legal Form : |
A Public Limited Liability Company. The Company’s Shares are Listed on
the Stock Exchanges. |
|
|
|
|
Line of Business
: |
The Subject is a leading manufacturer/producer of
Stainless steel flat products in Austenitic, Ferritic, Martensitic and Duplex
grades. The product range includes Ferro Alloys, Stainless Steel Slabs, Hot
Rolled Coils, Plates and Sheets, and Cold Rolled Coils and Sheets. (Registered Activity) |
|
|
|
|
No. of Employees
: |
1720 (Approximately) |
RATING & COMMENTS
(Mira Inform has adopted New Rating mechanism w.e.f. 23rd
January 2017)
|
MIRA’s Rating : |
C |
|
Credit Rating |
Explanation |
Rating Comments |
|
C |
Medium High Risk |
Business dealings permissible preferably
on secured basis |
|
Status : |
Poor |
|
|
|
|
Payment Behaviour : |
Slow and Delayed |
|
|
|
|
Litigation : |
Exist |
|
|
|
|
Comments : |
Subject was incorporated in the year 1980. It is a manufacturer of
stainless steel. For the financial year ended 2017, the revenue of the company has
increased by 36.28% along with low profit margin of 0.65%. Rating is constrained on account of delays of debt obligations by the
company along with leveraged capital structure, stretched liquidity
conditions. Rating also gets constrained on account of unfavourable gap between
trade payables and trade receivables. Payment seems to be slow and delayed. In view of aforesaid, the company can be considered for business
dealings on safe and secured trade terms and conditions. |
NOTES :
Any query related to this report can be made
on e-mail : infodept@mirainform.com
while quoting report number, name and date.
ECGC Country Risk Classification List
|
Country Name |
Previous Rating (30.09.2017) |
Current Rating (31.12.2017) |
|
India |
A1 |
A1 |
|
Risk Category |
ECGC Classification |
|
Insignificant |
A1 |
|
Low Risk |
A2 |
|
Moderately Low
Risk |
B1 |
|
Moderate Risk |
B2 |
|
Moderately High
Risk |
C1 |
|
High Risk |
C2 |
|
Very High Risk |
D |
EXTERNAL AGENCY RATING
|
Rating Agency Name |
CARE |
|
Rating |
Long Term Bank Facilities = D |
|
Rating Explanation |
Lowest-credit-quality and very low prospects of recovery. |
|
Date |
11.05.2017 |
RBI DEFAULTERS’ LIST STATUS
Subject’s name is not enlisted as a defaulter
in the publicly available RBI Defaulters’ list.
EPF (Employee Provident Fund) DEFAULTERS’ LIST STATUS
Subject’s name is not enlisted as a defaulter
in the publicly available EPF (Employee Provident Fund) Defaulters’ list as of
31-03-2016.
BIFR (Board for Industrial & Financial Reconstruction)
LISTING STATUS
Subject’s name is
not listed as a Sick Unit in the publicly available BIFR (Board for Industrial
& Financial Reconstruction) list as of 15.03.2018
IBBI (Insolvency and Bankruptcy Board of India) LISTING STATUS
Subject’s name is not listed in the publicly
available IBBI (Insolvency and Bankruptcy Board of India) list as of report
date.
INFORMATION DENIED
MANAGEMENT NON-COOPERATIVE: Tel. No.:
91-662-222471 / 83
LOCATIONS
|
Registered Office/ Factory 1 : |
O. P. Jindal
Marg, Hisar – 125005, Haryana, India |
|
|
Tel. No.: |
91-1662-222471/72/73- 83 |
|
|
Fax No.: |
91-1662-220476/
220499 |
|
|
E-Mail : |
|
|
|
Website : |
|
|
|
|
|
|
|
Corporate
Office : |
Jindal Centre,
12, Bhikaji Cama Place, New Delhi – 110066, India |
|
|
Tel. No.: |
91-11-26188345-60/ 41462000/ 61462000 / 226188340 – 50 |
|
|
Fax No.: |
91-11-26161271 / 26170691 / 41659169/ 26101562 |
|
|
E-Mail : |
||
|
|
|
|
|
Factory 2 : |
Jindal Nagar,
Kothavalasa, District Vizianagaram- 535183, Andhra Pradesh, India |
|
|
Tel. No.: |
91-8966-273327/
273254/ 273335 |
|
|
Fax No.: |
91-8966-273326 |
|
|
E-Mail : |
||
|
|
|
|
|
Factory 3 : |
Kalinga Nagar
Industrial Complex, Danagadi, District Jajpur– 755026, Odisha, India |
|
|
Fax No.: |
91-6726-266006 |
|
|
E-Mail : |
||
|
|
|
|
|
Factory 4 : |
Kawasan Industry Maspion, Maspion Unit-V, Desa Sukomylyo-Manyar,
Gresik 61151, Jawa Timur-Indonesia |
|
|
Tel. No.: |
62-31-3959588/ 3959565 |
|
|
Fax No.: |
62-31-3959566 |
|
|
E-Mail : |
||
|
|
|
|
|
Factory 5 : |
Village Kaliapani and Forest Block Number 27, Sukinda Tehesil, Jajpur District, Odisha, India |
|
|
Tel. No.: |
91-11-26188345/60 |
|
|
Fax No.: |
91-11-26170691/ 26161271 |
|
|
E-Mail : |
||
|
|
|
|
|
Sales/ Representative Offices : |
Also Located At:
|
|
|
|
|
|
|
Service Center
Office : |
Located at:
|
|
|
|
|
|
|
Global Offices
: |
Located at:
|
|
|
|
|
|
|
Warehouses: |
|
|
DIRECTORS
As on 31.03.2017
|
Name : |
Mr. Ratan Jindal |
|
Designation : |
Managing Director |
|
Address : |
Jindal House, Model Town, Hisar – 125005, Haryana, India |
|
Date of Birth / Age
: |
31.07.1961 |
|
Date of Appointment : |
23.07.2003 |
|
DIN No.: |
00054026 |
|
|
|
|
Name : |
Ms. Subrata Bhattacharya |
|
Designation : |
Whole-time Director |
|
Address : |
1403, C-Block Park, View City-I, Sohna Road, Gurugram – 122001, Haryana, India |
|
Date of Appointment : |
06.11.2015 |
|
DIN No.: |
03050155 |
|
|
|
|
Name : |
Ms. Suman Jyoti Khaitan |
|
Designation : |
Director |
|
Address : |
W-13, Greater Kailash, Part-II, New Delhi – 110048, India |
|
Date of Appointment : |
01.08.2003 |
|
DIN No.: |
00023370 |
|
|
|
|
Name : |
Mr. Tara Sankar Sudhir Bhattacharya |
|
Designation : |
Director |
|
Address : |
8E, 8th Floor, Harbour Heights, Building No-B-I, Nasawant Marg, Colaba, Mumbai – 400005, Maharashtra, India |
|
Date of Appointment : |
13.01.2009 |
|
DIN No.: |
00157305 |
|
|
|
|
Name : |
Mr. Gautam Kanjilal |
|
Designation : |
Director |
|
Address : |
I - 1698, Chittaranjan Park, New Delhi – 110019, India |
|
Date of Appointment : |
29.04.2010 |
|
DIN No.: |
03034033 |
|
|
|
|
Name : |
Ms. Bhaswati Mukherjee |
|
Designation : |
Director |
|
Address : |
C-135, Sarvodaya Enclave, New Delhi - 110017, India |
|
Date of Birth / Age
: |
14.06.1953 |
|
Date of Appointment : |
15.07.2017 |
|
DIN No.: |
07173244 |
|
|
|
|
Name : |
Mr. Abhyuday Jindal |
|
Designation : |
Director |
|
Address : |
House No.6, Prithvi Raj Road, Delhi – 110001, India |
|
Date of Birth / Age
: |
04.04.1989 |
|
Date of Appointment : |
09.08.2017 |
|
DIN No.: |
07290474 |
KEY EXECUTIVES
|
Name : |
Anurag Mantri |
|
Designation : |
Chief Finance Officer |
|
Address : |
E - 163, Raheja Atlantis, Sector-31, Gurugram - 122001, Haryana, India |
|
Date of Appointment : |
07.02.2017 |
|
PAN No.: |
ABMPM4745K |
|
|
|
|
Name : |
Mr. Sunil Yadav |
|
Designation : |
Company Secretary |
|
Address : |
341, Yadav Tyre Works, Auto Market, Hisar – 125001, Haryana, India |
|
Date of Appointment : |
28.09.2017 |
|
PAN No.: |
ABMPY7533P |
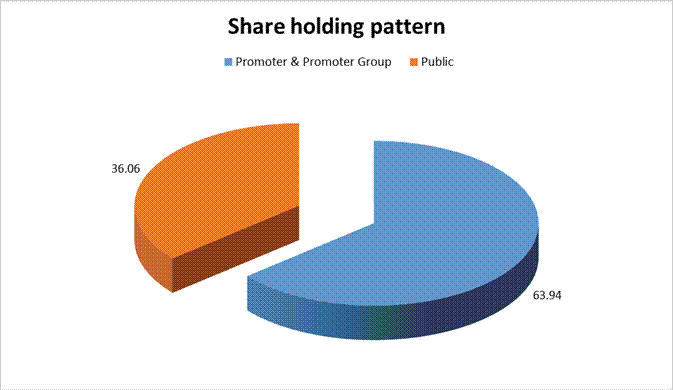
MAJOR SHAREHOLDERS / SHAREHOLDING PATTERN
As on December 2017
|
Category of
shareholder |
Total nos. shares held |
Shareholding as a % of total no. of shares |
|
|
(A) Promoter & Promoter Group |
282871739 |
65.13 |
|
|
(B) Public |
159564001 |
34.87 |
|
|
Grand Total |
442435740 |
100.00 |
Statement showing shareholding pattern of the Promoter
and Promoter Group
|
Category of
shareholder |
No.
of fully paid up equity shares held |
Shareholding
as a % of total no. of shares |
|
|
A1) Indian |
0.00 |
|
|
|
Individuals/Hindu
undivided Family |
670267 |
0.15 |
|
|
SAROJ BHARTIA |
40 |
0.00 |
|
|
SEEMA JAJODIA |
900 |
0.00 |
|
|
KAMAL KISHORE BHARTIA |
3550 |
0.00 |
|
|
URVI JINDAL |
11605 |
0.00 |
|
|
TANVI SHETE |
11995 |
0.00 |
|
|
TARINI JINDAL |
12000 |
0.00 |
|
|
TRIPTI JINDAL |
12175 |
0.00 |
|
|
NAVEEN JINDAL |
12768 |
0.00 |
|
|
R K JINDAL & SONS HUF . |
13940 |
0.00 |
|
|
ARTI JINDAL |
14390 |
0.00 |
|
|
DEEPIKA JINDAL |
69265 |
0.02 |
|
|
PARTH JINDAL |
27575 |
0.01 |
|
|
PRITHVI RAJ JINDAL |
31298 |
0.01 |
|
|
S K JINDAL AND SONS HUF . |
33330 |
0.01 |
|
|
SMINU JINDAL |
43875 |
0.01 |
|
|
SANGITA JINDAL |
94658 |
0.02 |
|
|
P R JINDAL HUF . |
58290 |
0.01 |
|
|
SAVITRI DEVI JINDAL |
88573 |
0.02 |
|
|
NAVEEN JINDAL HUF |
107860 |
0.02 |
|
|
ABHYUDAY JINDAL |
22180 |
0.00 |
|
|
Any Other
(specify) |
220440159 |
47.92 |
|
|
ROHIT TOWER BUILDING LTD |
31200 |
0.01 |
|
|
NALWA SONS INVESTMENTS LIMITED |
347945 |
0.08 |
|
|
MEREDITH TRADERS PRIVATE LIMITED |
422210 |
0.09 |
|
|
JSW HOLDINGS LIMITED |
460720 |
0.10 |
|
|
NALWA ENGINEERING CO LTD |
747290 |
0.16 |
|
|
ABHINANDAN INVESTMENTS LIMITED |
811350 |
0.18 |
|
|
GOSWAMIS CREDITS & INVESTMENTS LTD |
877795 |
0.19 |
|
|
RENUKA FINANCIAL SERVICES LTD |
886620 |
0.19 |
|
|
JINDAL REX EXPLORATION PRIVATE LIMITED |
929730 |
0.20 |
|
|
MANJULA FINANCES LTD |
1012080 |
0.22 |
|
|
EVER PLUS SECURITIES AND FINANCE LIMITED |
1157835 |
0.25 |
|
|
STAINLESS INVESTMENTS LIMITED |
1442895 |
0.31 |
|
|
NALWA INVESTMENTS LIMITED |
1707110 |
0.37 |
|
|
COLARADO TRADING CO LTD |
2074930 |
0.45 |
|
|
GAGAN TRADING COMPANY LIMITED |
2454295 |
0.53 |
|
|
SIDDESHWARI TRADEX PRIVATE LIMITED |
2755890 |
0.60 |
|
|
MANSAROVER INVESTMENTS LIMITED |
3797210 |
0.83 |
|
|
HEXA SECURITIES AND FINANCE CO LTD |
4931175 |
1.07 |
|
|
VRINDAVAN SERVICES PRIVATE LIMITED |
4946705 |
1.08 |
|
|
JINDAL STRIPS LIMITED |
5314090 |
1.16 |
|
|
JINDAL EQUIPMENT LEASING AND CONSULTANCY
SERVICES LTD |
5735555 |
1.25 |
|
|
SUN INVESTMENTS PVT LIMITED |
9296780 |
2.02 |
|
|
JINDAL STAINLESS HISAR LIMITED |
168284309 |
36.58 |
|
|
JINDAL COKE LIMITED |
6920 |
0.00 |
|
|
JINDAL UNITED STEEL LIMITED |
6920 |
0.00 |
|
|
VIRTUOUS TRADECORP PRIVATE LTD |
0.00 |
|
|
|
SAJJAN JINDAL AS A TRUSTEE FOR SAJJAN
JINDAL FAMILY TRUST |
100 |
0.00 |
|
|
SAJJAN JINDAL AS S TRUSTEE FOR SAJJAN
JINDAL LINEAGE TRUST |
100 |
0.00 |
|
|
SAJJAN JINDAL AS A TRUSTEE FOR SANGITA
JINDAL FAMILY TRUST |
100 |
0.00 |
|
|
SAJJAN JINDAL AS A TRUSTEE FOR TARINI
JINDAL FAMILY TRUST |
100 |
0.00 |
|
|
SAJJAN JINDAL AS A TRUSTEE FOR TANVI
JINDAL FAMILY TRUST |
100 |
0.00 |
|
|
SAJJAN JINDAL AS A TRUSTEE FOR PARTH
JINDAL FAMILY TRUST |
100 |
0.00 |
|
|
Sub Total A1 |
221110426 |
48.06 |
|
|
A2) Foreign |
0.00 |
|
|
|
Individuals
(NonResident Individuals/ Foreign Individuals) |
7500873 |
1.63 |
|
|
RATAN JINDAL |
7424148 |
1.61 |
|
|
SARIKA JHUNJHNUWALA |
76725 |
0.02 |
|
|
Any Other
(specify) |
54260440 |
15.43 |
|
|
JSL OVERSEAS HOLDING LTD |
54260440 |
15.43 |
|
|
Sub Total A2 |
61761313 |
17.06 |
|
|
A=A1+A2 |
282871739 |
65.13 |
|
Statement showing shareholding pattern of the Public
shareholder
|
Category &
Name of the Shareholders |
No.
of fully paid up equity shares held |
Shareholding
% calculated as per SCRR, 1957 As a % of (A+B+C2) |
|
|
B1) Institutions |
0 |
0.00 |
|
|
Mutual Funds/ |
2169872 |
0.47 |
|
|
Foreign
Portfolio Investors |
51939871 |
11.29 |
|
|
ELM PARK FUND LIMITED |
19726392 |
4.29 |
|
|
Hypnos Fund Limited |
19401711 |
4.22 |
|
|
Financial
Institutions/ Banks |
60753845 |
13.21 |
|
|
STATE BANK OF INDIA |
23811594 |
5.18 |
|
|
PUNJAB NATIONAL BANK |
8859335 |
1.93 |
|
|
Insurance
Companies |
1629843 |
0.35 |
|
|
Any Other
(specify) |
13520 |
0.00 |
|
|
Sub Total B1 |
116506951 |
25.33 |
|
|
B2) Central
Government/ State Government(s)/ President of India |
0 |
0.00 |
|
|
B3)
Non-Institutions |
0 |
0.00 |
|
|
Individual share
capital upto INR 0.200 Million |
22181810 |
4.82 |
|
|
Individual share
capital in excess of INR 0.200 Million |
1668678 |
0.36 |
|
|
Overseas
Depositories (holding DRs) (balancing figure) |
0 |
0.19 |
|
|
Any Other
(specify) |
19206562 |
4.17 |
|
|
Foreign Individuals or NRI |
1508745 |
0.33 |
|
|
Bodies Corporate |
16123941 |
3.50 |
|
|
Trusts |
36020 |
0.01 |
|
|
Foreign national |
4175 |
0.00 |
|
|
Overseas corporate bodies |
1690 |
0.00 |
|
|
Clearing Members |
267466 |
0.06 |
|
|
HUF |
1264525 |
0.27 |
|
|
Sub Total B3 |
43057050 |
9.55 |
|
|
B=B1+B2+B3 |
159564001 |
34.87 |
|
BUSINESS DETAILS
|
Line of Business : |
The Subject is a leading manufacturer/producer of
Stainless steel flat products in Austenitic, Ferritic, Martensitic and Duplex
grades. The product range includes Ferro Alloys, Stainless Steel Slabs, Hot
Rolled Coils, Plates and Sheets, and Cold Rolled Coils and Sheets. (Registered Activity) |
||||
|
|
|
||||
|
Products : |
|
||||
|
|
|
||||
|
Brand Names : |
Not Divulged |
||||
|
|
|
||||
|
Agencies Held : |
Not Divulged |
||||
|
|
|
||||
|
Exports : |
Not Divulged |
||||
|
|
|
||||
|
Imports : |
Not Divulged |
||||
|
|
|
||||
|
Terms : |
Not Divulged |
PRODUCTION STATUS NOT AVAILABLE
GENERAL INFORMATION
|
Suppliers : |
|
|||||||||||||||||||||||||||||||||||||||||||||||||||
|
|
|
|||||||||||||||||||||||||||||||||||||||||||||||||||
|
Customers : |
|
|||||||||||||||||||||||||||||||||||||||||||||||||||
|
|
|
|||||||||||||||||||||||||||||||||||||||||||||||||||
|
No. of Employees : |
1720 (Approximately) |
|||||||||||||||||||||||||||||||||||||||||||||||||||
|
|
|
|||||||||||||||||||||||||||||||||||||||||||||||||||
|
Bankers : |
|
|||||||||||||||||||||||||||||||||||||||||||||||||||
|
|
|
|||||||||||||||||||||||||||||||||||||||||||||||||||
|
Facilities : |
NOTE: Long-term Borrowings (a) *Redeemable Non-Convertible Debentures (*carrying floating rate of interest equivalent to SBI Base Rate plus spread of 425 bps) of INR 10,00,000 each, balance amounting to INR 2167.500 Million (INR 2267.500 Million) are redeemable in quarterly installments of INR 81.300 Crores each during 2017-18, INR 100.000 Million each during 2018-19 and thereafter ranging from INR 106.300 Million to INR 118.800 Million during 2019-20 to 2021-22. Debentures are secured by first pari-passu charge by way of mortgage of Company's immovable properties and hypothecation of movable fixed assets both present and future and second pari-passu charge by way of hypothecation and/or pledge of current assets namely finished good, raw materials, work-in-progress, consumable stores and spares, book debts and bills receivable. (b) (i) Rupee Term Loans from banks amounting to INR 866.800 Million (INR 13223.700 Million) are repayable in quarterly installments of INR 32.500 Million each during 2017-18, INR 40.000 Million each during 2018-19 and thereafter ranging from INR 42.500 Million to INR 47.500 Million during 2019-20 to 2021-22. The loans are secured by first pari-passu charge by way of mortgage of Company's immovable properties and hypothecation of moveable fixed assets both present and future and second pari-passu charge by way of hypothecation and/or pledge of current assets namely finished goods, raw materials, work-in-progress, consumable stores and spares, book debts and bills receivable. (ii) Rupee Term Loans from banks amounting to INR 2350.500 Million (INR 22056.000 Million) are repayable in quarterly installments of, INR 81.100 Million each during 2017-18, INR 101.300 Million each during 2018-19 and thereafter ranging from INR 113.500 Million to INR 148.600 Million during 2019-20 to 2021-22. The loans are secured by first pari-passu charge by way of mortgage of Company's immovable properties and hypothecation of moveable fixed assets both present and future and second pari-passu charge by way of hypothecation and/or pledge of current assets namely finished goods, raw materials, work-in-progress, consumable stores and spares, book debts and bills receivable. (iii) Rupee Term Loan from banks amounting to INR 218.200 Million (INR 3331.700 Million) is repayable on 31st March, 2022. The loan is secured by second pari-passu charge by way of mortgage of Company's immovable properties and hypothecation of moveable fixed assets both present and future and second pari-passu charge by way of hypothecation and/or pledge of current assets namely finished goods, raw materials, work-in-progress, consumable stores and spares, book debts and bills receivable. (iv) Rupee Term Loans from banks amounting to INR 290.700 Million (INR 5811.300 Million) are repayable in quarterly installments of, INR 10.900 Million each during 2017-18, INR 13.400 Million each during 2018-19 and thereafter ranging from INR 14.200 Million to INR 15.900 Million during 2019-20 to 2021-22. The loans are secured by second pari-passu charge by way of mortgage of Company's immovable properties and hypothecation of moveable fixed assets both present and future and second pari-passu charge by way of hypothecation and/or pledge of current assets namely finished goods, raw materials, work-in-progress, consumable stores and spares, book debts and bills receivable. (v) Rupee Term Loan from banks amounting to INR 9560.800 Million (INR 9571.800 Million) are repayable in quarterly installments of, INR 4.800 Million each during 2017-18, INR 71.900 Million each during 2018-19 and thereafter ranging from INR 95.800 Million to INR 469.400 Million during 2019-20 to 2026-27. The loans are secured by first pari-passu charge by way of mortgage of Company's immovable properties and hypothecation of moveable fixed assets both present and future and second pari-passu charge by way of hypothecation and/or pledge of current assets namely finished goods, raw materials, work-in-progress, consumable stores and spares, book debts and bills receivable. (vi) Foreign Currency Loans from banks amounting to INR 331.000 Million (INR 738.100 Million) are repayable in quarterly installments of INR 11.100 Million each during 2017-18, INR 14.300 Million each during 2018-19 and thereafter ranging from INR 16.200 Million to INR 20.900 Million during 2019-20 to 2021-22. The loans are secured by first pari-passu charge by way of mortgage of Company's immovable properties and hypothecation of moveable fixed assets both present and future and second pari-passu charge by way of hypothecation and/or pledge of current assets namely finished goods, raw materials, work-in-progress, consumable stores and spares, book debts and bills receivable. (vii) Foreign Currency Loans from banks amounting to INR 9545.800 Million (INR 13044.900 Million) are repayable in annual installments of INR 2432.100 Million in 2017-18 and INR 2371.300 Million each during 2018-19 to 2020-21. The loans are secured by first pari-passu charge by way of mortgage of Company's immovable properties and hypothecation of moveable fixed assets both present and future and second pari-passu charge by way of hypothecation and/or pledge of current assets namely finished goods, raw materials, work-in-progress, consumable stores and spares, book debts and bills receivable. (c) (i) Funded Interest Term Loans (I) from banks amounting to INR 3991.800 Million (INR 4186.800 Million) (including INR 336.200 Million (INR 351.100 Million) from Financial Institutions) are repayable in quarterly installments of INR 150.900 Million each during 2017-18, INR 185.800 Million each during 2018-19 and thereafter ranging from INR 197.400 Million to INR 220.600 Million during 2019-20 to 2021-22. The loans are secured by first pari-passu charge by way of mortgage of Company's immovable properties and hypothecation of moveable fixed assets both present and future and second pari-passu charge by way of hypothecation and/or pledge of current assets namely finished goods, raw materials, work-in-progress, consumable stores and spares, book debts and bills receivable. (ii) Funded Interest Term Loans (II) from banks amounting to INR 4726.700 Million (INR 5549.200 Million) (including INR 26.700 Million (INR 238.700 Million) from Financial Institutions) are repayable in 2 quarterly installments of INR 198.200 Million each from 30th April, 2017 till 31st July, 2017 and thereafter maximum quarterly installment of INR 380.800 Million each starting from 31st October, 2017 and ending on 31st July 2020. The loans are secured by first pari-passu charge by way of mortgage of Company's immovable properties and hypothecation of moveable fixed assets both present and future and second pari-passu charge by way of hypothecation and/or pledge of current assets namely finished goods, raw materials, work-in-progress, consumable stores and spares, book debts and bills receivable. (a,b,c) (i) Above Term Loans amounting to INR 24504.000 Million (including Funded Interest Term Loan INR 8718.500 Million, Debentures amounting to INR 2167.500 Million) are also secured by additional securities as mentioned in Note No. 32 (A) (iii). (ii) In accordance with the AMP proposal, as approved by CDR EG, during the year the Company has prepaid its long term domestic debt obligations amounting to INR 39885.800 Million (INR 11849.300 Million) to the lenders of JSL from the amounts received as consideration/long term refundable security deposit from Jindal Stainless (Hisar) Limited (JSHL), Jindal Coke Limited (JCL) and Jindal United Steel Limited (JUSL). (iii) Foreign Currency Loan of INR 9545.800 Million {refer (b) (vii) above} also secured by additional security as mentioned in Note no. 32(A) (iii) (c). (iv) (a) Outstanding Rupee term loan facilities (including Redeemable Non-Convertible Debentures and Funded Interest Term Loans) carries floating rate of interest linked with SBI Base Rate plus applicable spread ranging from 100 bps to 430 bps. The Lenders also have an option to link their effective rate of interest with their own bank's Base Rate and adjust the spread accordingly. (b) Outstanding Foreign currency loan facilities carries rate of interest, equivalent to applicable LIBOR plus applicable spread ranging from 380 bps to 490 bps. Short-term
borrowings a) Working Capital Facilities are secured by way of hypothecation and/or pledge of current assets namely finished goods, raw material, work in progress, consumable stores and spares, book debts, bill receivable and by way of second charge in respect of other moveable and immoveable properties of the Company. Working Capital Facility is repayable on demand. (b) Buyer Credit Facility are secured by way of hypothecation and/or pledge of current assets namely finished goods, raw material, work in progress, consumable stores and spares, book debts, bill receivable and by way of second charge in respect of other moveable and immoveable properties of the Company. (a,b) Working Capital Facility from bank amounting to INR 8873.200 Million (INR 10651.800 Million) and Working Capital Buyers Credit amounting to INR 7826.300 Million (9006.300 Million) are also secured by additional securities as mentioned in note no. 32 (A) (iii). *Further Working Capital Facilities continue to have security on the assets transferred to Jindal Stainless (Hisar) Limited , Jindal United Steel Limited and Jindal Coke Limited in pursuant to Composite Scheme of Arrangement (Read with note no 27). "*Net of the amount of INR NIL (INR 706.300 Million) of Working Capital Facilities and INR NIL (INR 2323.500 Million) of buyer credit has been allocated to Jindal Stainless (Hisar) Limited and INR 817.800 Million (INR 40.100 Million) of buyers credit has been allocated to JCL pursuant to Composit Scheme of Arrangement (read with note no. 27) pending confirmation from the respective banks. INR 817.800 Million (INR 40.100 Million) of buyers credit has been allocated to JCL pursuant to Composite Scheme of Arrangement (read with note no. 27) pending confirmation from the respective banks." (c) Subject to compliance of conditions stipulated in the agreement. |
|
Financial Institutions : |
|
|
|
|
|
Auditor : |
|
|
Name : |
Walker
Chandiok and Company LLP Chartered Accountants |
|
Address : |
L-41,
Connaught Circus, New Delhi – 110001, India |
|
Tel. No.: |
91-11-42787070 |
|
Fax No.: |
91-11-42787071
|
|
|
|
|
Statutory Auditors 1 : |
|
|
Name : |
Lodha
and Company Chartered Accountants |
|
|
|
|
Statutory Auditors 2 : |
|
|
Name : |
S.
S. Kothari Mehta and Company Chartered Accountants |
|
|
|
|
Cost Auditors : |
|
|
Name : |
Ramanath
Iyer and Company Cost Accountants |
|
|
|
|
Secretarial
Auditors |
|
|
Name : |
Vinod Kothari and Company Practicing Company Secretary |
|
|
|
|
|
|
|
Memberships : |
Not Available |
|
|
|
|
Collaborators : |
Not Available |
|
|
|
|
Direct Subsidiary: |
|
|
|
|
|
Indirect Subsidiary |
|
|
|
|
|
Joint Ventures and
Associates: |
|
|
|
|
|
Enterprises over
which the company hold more than 20% of Share : |
|
|
|
|
|
Enterprises
controlled by key management personnel & their Relatives : |
|
|
|
|
|
Others related
parties: |
|
|
|
|
|
Trust under common
control : |
|
CAPITAL STRUCTURE
After 26.09.2017
Authorised Capital : INR 1540.000
Million
Issued, Subscribed & Paid-up Capital : INR 1205.741 Million
As on 31.03.2017
Authorised Capital :
|
No. of Shares |
Type |
Value |
Amount |
|
|
|
|
|
|
600000000 |
Equity Shares |
INR 2/- each |
INR 1200.000
Million |
|
170000000 |
Preference Shares |
INR 2/- each |
INR 340.000
Million |
|
|
Total |
|
INR 1540.000
Million |
Issued, Subscribed & Paid-up Capital :
|
No. of Shares |
Type |
Value |
Amount |
|
|
|
|
|
|
399469754 |
Equity Shares |
INR 2/- each |
INR 798.900 Million |
|
|
|
|
|
RECONCILIATION OF THE NUMBER OF SHARES OUTSTANDING AT THE BEGINNING AND
AT THE END OF THE REPORTING YEAR
|
Particulars |
Equity Shares |
Preference Shares |
|
|
Number of Shares |
Number of Shares |
|
Shares outstanding at the beginning of the Year |
23118544 |
-- |
|
Shares issued during the Year |
|
|
|
On Conversion of Foreign Currency Convertible Bonds |
-- |
-- |
|
On Issue of Shares on Preferential basis to Jindal Stainless (Hisar) Limited |
168284309 |
-- |
|
Shares outstanding at the end of the Year |
399469754 |
-- |
3,759,213 (3,759,213) Equity shares of INR 2/- each fully paid up have been allotted to the holders of 2,060 (2,060) Foreign Currency Convertible Bonds of US $ 5000/- each at pre determined (as per scheme) conversion rate of INR 119.872 each during the last five years.
TERMS/RIGHTS ATTACHED
TO EQUITY SHARES
The company has only one class of equity shares having a face value of INR 2/- per share. Each shareholder is eligible for one vote per equity share held [other than the shares represented by Regulation S Global Depositary Shares (the “GDSs”) issued by the Company whose voting rights are subject to certain conditions and procedure as prescribed under the Regulation S Deposit Agreement]. The company declares and pays dividends in Indian rupees. The dividend proposed, if any, by the Board of Directors is subject to the approval of the shareholders in the ensuing Annual General Meeting and also has equal right in distribution of Profit/Surplus in proportions to the number of equity shares held by the shareholders.
As on 31st March, 2017, 8,802,167 GDSs (8,802,167 GDSs) with 17,604,334 underlying equity shares (17,604,334 equity shares) were outstanding. Each GDS represents 2 underlying equity shares of the Company.
(ii) CUMULATIVE
COMPULOSRY CONVERTIBLE PREFERENCE SHARES (CCCPS)
During 2015-16 48,10,440 0.10% Cumulative Compulsory Convertible Preference Shares of INR 2/- each have been converted into 48,10,440 fully paid up Equity Shares of INR 2/- Each.
(c) EQUITY SHARES IN
THE COMPANY HELD BY EACH SHAREHOLDER HOLDING MORE THAN 5% SHARES ARE AS UNDER
|
Name of
Shareholders |
Number
of Shares |
% holding |
|
JSL Overseas Holding Limited (Formerly Jindal Overseas Holdings
Limited) |
27700000 |
6.93% |
|
JSL
Overseas Limited |
26560440 |
6.65% |
|
Citigroup Global Markets Mauritius Private
Limited |
-- |
|
|
Jindal Stainless (Hisar) Limited |
168284309 |
42.13% |
|
Reliance Capital
Trustee Company Limited |
-- |
-- |
|
Account Reliance Diversified Power Sector Fund |
-- |
-- |
(d) EQUITY SHARES
RESERVED FOR ISSUE UNDER OPTIONS
For details of shares reserved for issue under the Employee Stock Option Scheme, 2010 of the company.
(e) No bonus, buy back in last five years except about Share Capital Suspense Account read with Note No. 27A.
FINANCIAL DATA
[all figures are
in INR Million]
ABRIDGED
BALANCE SHEET - STANDALONE
|
SOURCES
OF FUNDS |
31.03.2017 |
31.03.2016 |
31.03.2015 |
|
|
|
|
|
|
I.
EQUITY AND LIABILITIES |
|
|
|
|
(1)Shareholders' Funds |
|
|
|
|
(a) Share Capital |
798.900 |
462.400 |
462.371 |
|
(b) Reserves & Surplus |
16613.200 |
12241.700 |
(2182.134) |
|
(c) Money received against
share warrants |
0.000 |
0.000 |
0.000 |
|
|
|
|
|
|
(2) Share Capital Suspense
Account |
0.000 |
3661.900 |
3661.867 |
|
Total
Shareholders’ Funds (1) + (2) |
17412.100 |
16366.000 |
1942.104 |
|
|
|
|
|
|
(3) Non-Current Liabilities |
|
|
|
|
(a) long-term borrowings |
33819.900 |
73232.700 |
80702.339 |
|
(b) Deferred tax liabilities
(Net) |
0.000 |
0.000 |
0.000 |
|
(c) Other long term
liabilities |
1261.100 |
777.400 |
2090.717 |
|
(d) long-term provisions |
74.000 |
61.200 |
52.022 |
|
Total
Non-current Liabilities (3) |
35155.000 |
74071.300 |
82845.078 |
|
|
|
|
|
|
(4) Current Liabilities |
|
|
|
|
(a) Short term borrowings |
17381.300 |
20538.500 |
23331.411 |
|
(b) Trade payables |
16435.900 |
16589.900 |
13157.301 |
|
(c) Other current liabilities |
16318.900 |
15704.300 |
13997.686 |
|
(d) Short-term provisions |
5.500 |
5.200 |
23.029 |
|
Total
Current Liabilities (4) |
50141.600 |
52837.900 |
50509.427 |
|
|
|
|
|
|
TOTAL |
102708.700 |
143275.200 |
135296.609 |
|
|
|
|
|
|
II.
ASSETS |
|
|
|
|
(1) Non-current assets |
|
|
|
|
(a) Fixed Assets |
|
|
|
|
(i) Tangible assets |
63714.600 |
66150.500 |
73800.290 |
|
(ii) Intangible Assets |
201.000 |
295.600 |
141.654 |
|
(iii) Capital work-in-progress |
297.300 |
542.000 |
1373.247 |
|
(iv) Intangible assets under
development |
0.000 |
0.000 |
0.000 |
|
(b) Non-current Investments |
4801.900 |
4811.700 |
1031.270 |
|
(c) Deferred tax assets (net) |
1191.500 |
1496.600 |
0.000 |
|
(d) Long-term Loan and Advances |
229.000 |
311.800 |
1618.243 |
|
(e) Other Non-current assets |
288.100 |
304.000 |
1.978 |
|
Total
Non-Current Assets |
70723.400 |
73912.200 |
77966.682 |
|
|
|
|
|
|
(2) Current assets |
|
|
|
|
(a) Current investments |
9.700 |
4.000 |
3.065 |
|
(b) Inventories |
17546.800 |
16437.200 |
17205.651 |
|
(c) Trade receivables |
8050.100 |
9190.200 |
9567.931 |
|
(d) Cash and cash equivalents |
410.600 |
702.000 |
411.368 |
|
(e) Short-term loans and
advances |
238.600 |
142.200 |
30128.653 |
|
(f) Other current assets |
5729.500 |
42887.400 |
13.259 |
|
Total
Current Assets |
31985.300 |
69363.000 |
57329.927 |
|
|
|
|
|
|
TOTAL |
102708.700 |
143275.200 |
135296.609 |
PROFIT
& LOSS ACCOUNT - STANDALONE
|
|
PARTICULARS |
31.03.2017 |
31.03.2016 |
31.03.2015 |
|
|
SALES |
|
|
|
|
|
Income |
89574.000 |
70282.400 |
60109.402 |
|
|
Other Income |
255.500 |
258.900 |
527.917 |
|
|
TOTAL
|
89829.500 |
70541.300 |
60637.319 |
|
|
|
|
|
|
|
Less |
EXPENSES |
|
|
|
|
|
Cost of Materials Consumed |
49537.600 |
38884.300 |
39450.601 |
|
|
Purchases of Stock-in-Trade |
1467.200 |
3574.000 |
0.000 |
|
|
Changes in inventories of
finished goods, work-in-progress and Stock-in-Trade |
(1239.300) |
(1243.600) |
1899.056 |
|
|
Excise Duty on sales |
6461.200 |
5002.500 |
0.000 |
|
|
Employees benefits expense |
1024.600 |
910.200 |
1156.301 |
|
|
Other
expenses: |
|
|
|
|
|
Manufacturing expenses |
18085.600 |
15166.200 |
14563.384 |
|
|
Administrative expenses |
836.900 |
724.500 |
0.000 |
|
|
Selling expenses |
2333.200 |
2054.900 |
0.000 |
|
|
Exceptional items -
Gain/(Loss) |
(261.300) |
343.500 |
(11731.955) |
|
|
TOTAL |
78245.700 |
65416.500 |
45337.387 |
|
|
|
|
|
|
|
|
PROFIT/
(LOSS) BEFORE INTEREST, TAX,
DEPRECIATION AND AMORTISATION |
11583.800 |
5124.800 |
15299.932 |
|
|
|
|
|
|
|
Less |
FINANCIAL
EXPENSES |
7616.900 |
10062.300 |
9158.133 |
|
|
|
|
|
|
|
|
PROFIT
/ (LOSS) BEFORE TAX, DEPRECIATION AND AMORTISATION |
3966.900 |
(4937.500) |
6141.799 |
|
|
|
|
|
|
|
Less/
Add |
DEPRECIATION/
AMORTISATION |
3079.800 |
2984.600 |
3925.466 |
|
|
|
|
|
|
|
|
PROFIT/
(LOSS) BEFORE TAX |
887.100 |
(7922.100) |
2216.333 |
|
|
|
|
|
|
|
Less |
TAX |
303.700 |
(2330.900) |
(14.461) |
|
|
|
|
|
|
|
|
PROFIT/
(LOSS) AFTER TAX |
583.400 |
(5591.200) |
2230.794 |
|
|
|
|
|
|
|
|
EARNINGS
IN FOREIGN CURRENCY |
|
|
|
|
|
F.O.B. Value of Exports |
23040.700 |
10984.500 |
19115.953 |
|
|
Interest |
4.500 |
4.000 |
3.493 |
|
|
Sale of Property |
0.000 |
0.000 |
442.571 |
|
|
TOTAL
EARNINGS |
23045.200 |
10988.500 |
19562.017 |
|
|
|
|
|
|
|
|
IMPORTS |
|
|
|
|
|
Raw Materials |
27219.300 |
29082.700 |
28760.241 |
|
|
Components and Stores parts |
1847.400 |
1800.600 |
1379.590 |
|
|
Capital Goods |
9.900 |
278.200 |
0.000 |
|
|
TOTAL
IMPORTS |
29076.600 |
31161.500 |
30139.831 |
|
|
|
|
|
|
|
|
Earnings
/ (Loss) Per Share (INR) |
1.63 |
(24.43) |
10.21 |
CURRENT MATURITIES OF LONG TERM DEBT DETAILS
|
Particulars |
31.03.2017 |
31.03.2016 |
31.03.2015 |
|
Current Maturities of Long term debt |
5079.900 |
6597.500 |
4856.427 |
|
Cash generated from operations |
NA |
NA |
NA |
|
Net cash flow from operating activity |
13089.600 |
7655.000 |
4211.335 |
QUARTERLY RESULTS
|
Particulars |
30.06.2017 |
30.09.2017 |
31.12.2017 |
|
Audited / Unaudited |
Unaudited |
Unaudited |
Unaudited |
|
|
1ST Quarter |
2nd Quarter |
3RD Quarter |
|
Net Sales |
21943.100 |
26078.400 |
29888.600 |
|
Total Expenditure |
19437.900 |
23513.600 |
26033.400 |
|
PBIDT (Excl OI) |
2505.200 |
2564.800 |
3855.200 |
|
Other Income |
95.500 |
143.400 |
108.000 |
|
Operating Profit |
2600.700 |
2708.200 |
3963.200 |
|
Interest |
1019.000 |
1609.100 |
1535.500 |
|
Exceptional Items |
(188.100) |
145.100 |
383.900 |
|
PBDT |
1393.600 |
1244.200 |
2811.600 |
|
Depreciation |
758.900 |
759.400 |
769.100 |
|
Profit Before Tax |
634.700 |
484.800 |
2042.500 |
|
Tax |
219.700 |
211.800 |
695.200 |
|
Provisions and contingencies |
NA |
NA |
NA |
|
Profit After Tax |
415.000 |
273.000 |
1347.300 |
|
Extraordinary Items |
NA |
NA |
NA |
|
Prior Period Expenses |
NA |
NA |
NA |
|
Other Adjustments |
NA |
NA |
NA |
|
Net Profit |
415.000 |
273.000 |
1347.300 |
KEY
RATIOS
EFFICIENCY RATIOS
|
PARTICULARS |
31.03.2017 |
31.03.2016 |
31.03.2015 |
|
Average Collection Days (Sundry Debtors / Income * 365 Days) |
32.80 |
47.73 |
58.10 |
|
|
|
|
|
|
Account Receivables Turnover (Income / Sundry
Debtors) |
11.13 |
7.65 |
6.28 |
|
|
|
|
|
|
Average Payment Days (Sundry Creditors
/ Purchases * 365 Days) |
117.62 |
142.62 |
121.73 |
|
|
|
|
|
|
Inventory Turnover (Operating Income
/ Inventories) |
0.66 |
0.31 |
0.89 |
|
|
|
|
|
|
Asset Turnover (Operating Income
/ Net Fixed Assets) |
0.18 |
0.08 |
0.20 |
LEVERAGE RATIOS
|
PARTICULARS |
31.03.2017 |
31.03.2016 |
31.03.2015 |
|
Debt Ratio ((Borrowing + Current Liabilities) / Total
Assets) |
0.87 |
0.93 |
1.01 |
|
|
|
|
|
|
Debt Equity Ratio (Total Liability
/ Networth) |
3.23 |
6.13 |
56.07 |
|
|
|
|
|
|
Current Liabilities to Networth (Current
Liabilities / Net Worth) |
2.88 |
3.23 |
26.01 |
|
|
|
|
|
|
Fixed Assets to Networth (Net Fixed Assets
/ Networth) |
3.69 |
4.09 |
38.78 |
|
|
|
|
|
|
Interest Coverage Ratio (PBIT / Financial
Charges) |
1.52 |
0.51 |
1.67 |
PROFITABILITY RATIOS
|
PARTICULARS |
|
31.03.2017 |
31.03.2016 |
31.03.2015 |
|
Net Profit Margin ((PAT / Sales) *
100) |
% |
0.65 |
(7.96) |
3.71 |
|
|
|
|
|
|
|
Return on Total Assets ((PAT / Total
Assets) * 100) |
% |
0.57 |
(3.90) |
1.65 |
|
|
|
|
|
|
|
Return on Investment (ROI) ((PAT / Networth)
* 100) |
% |
3.35 |
(34.16) |
114.86 |
SOLVENCY RATIOS
|
PARTICULARS |
31.03.2017 |
31.03.2016 |
31.03.2015 |
|
Current Ratio (Current Assets / Current Liabilities) |
0.64 |
1.31 |
1.14 |
|
|
|
|
|
|
Quick Ratio ((Current Assets
– Inventories) / Current Liabilities) |
0.29 |
1.00 |
0.79 |
|
|
|
|
|
|
G-Score Ratio Financial (Networth / Total
Assets) |
0.17 |
0.11 |
0.01 |
|
|
|
|
|
|
G-Score Ratio Debt (Debts / Equity
Capital) |
70.45 |
217.06 |
235.50 |
|
|
|
|
|
|
G-Score Ratio Liquidity (Total Current
Assets / Total Current Liabilities) |
0.64 |
1.31 |
1.14 |
Total Liability = Short-term Debt + Long-term
Debt + Current Maturities of Long-term debts
STOCK PRICES
|
Face Value |
INR 2.00/- |
|
Market Value |
INR 104.60/- |
FINANCIAL ANALYSIS
[all figures are
INR Million]
DEBT EQUITY RATIO
|
Particular |
31.03.2015 |
31.03.2016 |
31.03.2017 |
|
|
INR
In Million |
INR
In Million |
INR
In Million |
|
Share Capital |
462.371 |
462.400 |
798.900 |
|
Reserves & Surplus |
(2182.134) |
12241.700 |
16613.200 |
|
Share Capital Suspense Account |
3661.867 |
3661.900 |
0.000 |
|
Net
worth |
1942.104 |
16366.000 |
17412.100 |
|
|
|
|
|
|
Long Term borrowings |
80702.339 |
73232.700 |
33819.900 |
|
Short Term borrowings |
23331.411 |
20538.500 |
17381.300 |
|
Current Maturities of Long term debt |
4856.427 |
6597.500 |
5079.900 |
|
Total
borrowings |
108890.177 |
100368.700 |
56281.100 |
|
Debt/Equity
ratio |
56.068 |
6.133 |
3.232 |

YEAR-ON-YEAR GROWTH
|
Year
on Year Growth |
31.03.2015 |
31.03.2016 |
31.03.2017 |
|
|
INR
In Million |
INR
In Million |
INR
In Million |
|
Sales
|
60109.402 |
70282.400 |
89574.000 |
|
|
|
16.924 |
27.449 |

NET PROFIT MARGIN
|
Net
Profit Margin |
31.03.2015 |
31.03.2016 |
31.03.2017 |
|
|
INR
In Million |
INR
In Million |
INR
In Million |
|
Sales
|
60109.402 |
70282.400 |
89574.000 |
|
Profit |
2230.794 |
(5591.200) |
583.400 |
|
|
3.71% |
(7.96%) |
0.65% |

ABRIDGED
BALANCE SHEET – (CONSOLIDATED)
|
SOURCES
OF FUNDS |
|
31.03.2017 |
31.03.2016 |
|
|
|
|
|
|
I.
EQUITY AND LIABILITIES |
|
|
|
|
(1)Shareholders' Funds |
|
|
|
|
(a) Share Capital |
|
798.900 |
462.400 |
|
(b) Reserves & Surplus |
|
17340.000 |
12996.900 |
|
(c) Share Capital Suspense
Account |
|
0.000 |
3661.900 |
|
|
|
|
|
|
(2) Equity Attributable to
Owners of the Company |
|
0.000 |
0.000 |
|
(3) Non-Controlling Interest |
|
60.700 |
48.200 |
|
Total
Shareholders’ Funds (1) + (2) |
|
18199.600 |
17169.400 |
|
|
|
|
|
|
(3) Non-Current Liabilities |
|
|
|
|
(a) long-term borrowings |
|
33819.900 |
73232.700 |
|
(b) Deferred tax liabilities
(Net) |
|
0.000 |
0.000 |
|
(c) Other long term
liabilities |
|
1261.100 |
777.400 |
|
(d) long-term provisions |
|
134.200 |
111.200 |
|
Total
Non-current Liabilities (3) |
|
35215.200 |
74121.300 |
|
|
|
|
|
|
(4) Current Liabilities |
|
|
|
|
(a) Short term borrowings |
|
19977.500 |
23643.700 |
|
(b) Trade payables |
|
18649.100 |
17775.000 |
|
(c) Other current liabilities |
|
17050.800 |
15860.600 |
|
(d) Short-term provisions |
|
5.500 |
5.200 |
|
Total
Current Liabilities (4) |
|
55682.900 |
57284.500 |
|
|
|
|
|
|
TOTAL |
|
109097.700 |
148575.200 |
|
|
|
|
|
|
II.
ASSETS |
|
|
|
|
(1) Non-current assets |
|
|
|
|
(a) Fixed Assets |
|
|
|
|
(i) Tangible assets |
|
65873.300 |
68333.200 |
|
(ii) Intangible Assets |
|
211.600 |
296.900 |
|
(iii) Capital work-in-progress |
|
297.300 |
699.900 |
|
(iv) Intangible assets under
development |
|
0.000 |
0.000 |
|
(b) Non-current Investments |
|
4027.100 |
3922.400 |
|
(c) Deferred tax assets (net) |
|
1122.800 |
1593.900 |
|
(d) Long-term Loan and Advances |
|
705.400 |
722.100 |
|
(e) Other Non-current assets |
|
288.100 |
304.000 |
|
Total
Non-Current Assets |
|
72525.600 |
75872.400 |
|
|
|
|
|
|
(2) Current assets |
|
|
|
|
(a) Current investments |
|
9.700 |
4.000 |
|
(b) Inventories |
|
20965.400 |
19127.300 |
|
(c) Trade receivables |
|
8895.200 |
9355.100 |
|
(d) Cash and cash equivalents |
|
514.100 |
799.800 |
|
(e) Short-term loans and
advances |
|
238.800 |
142.200 |
|
(f) Other current assets |
|
5948.900 |
43274.400 |
|
Total
Current Assets |
|
36572.100 |
72702.800 |
|
|
|
|
|
|
TOTAL |
|
109097.700 |
148575.200 |
PROFIT
& LOSS ACCOUNT– (CONSOLIDATED)
|
|
PARTICULARS |
|
31.03.2017 |
31.03.2016 |
|
|
SALES |
|
|
|
|
|
Income |
|
99247.800 |
76438.600 |
|
|
Other Income |
|
256.900 |
261.500 |
|
|
TOTAL
|
|
99504.700 |
76700.100 |
|
|
|
|
|
|
|
Less |
EXPENSES |
|
|
|
|
|
Cost of Materials Consumed |
|
57926.200 |
43241.000 |
|
|
Purchases of Stock-in-Trade |
|
1467.200 |
3574.000 |
|
|
Changes in inventories of
finished goods, work-in-progress and Stock-in-Trade |
|
(2055.000) |
(1539.200) |
|
|
Excise Duty on sales |
|
6461.200 |
5002.500 |
|
|
Employees benefits expense |
|
1540.500 |
1343.400 |
|
|
Other
expenses : |
|
|
|
|
|
Manufacturing Expenses |
|
18784.900 |
15956.000 |
|
|
Administrative Expense |
|
975.600 |
886.500 |
|
|
Selling expenses |
|
2491.300 |
2247.100 |
|
|
Exceptional items -
Gain/(Loss) |
|
(258.400) |
403.700 |
|
|
TOTAL |
|
87333.500 |
71115.000 |
|
|
|
|
|
|
|
|
PROFIT/
(LOSS) BEFORE INTEREST, TAX,
DEPRECIATION AND AMORTISATION |
|
12171.200 |
5585.100 |
|
|
|
|
|
|
|
Less |
FINANCIAL
EXPENSES |
|
7878.800 |
10299.700 |
|
|
|
|
|
|
|
|
PROFIT
/ (LOSS) BEFORE TAX, DEPRECIATION AND AMORTISATION |
|
4292.400 |
(4714.600) |
|
|
|
|
|
|
|
Less/
Add |
DEPRECIATION/
AMORTISATION |
|
3252.100 |
3161.600 |
|
|
|
|
|
|
|
|
PROFIT/
(LOSS) BEFORE TAX |
|
1040.300 |
(7876.200) |
|
|
|
|
|
|
|
Less |
TAX |
|
324.700 |
(2315.100) |
|
|
|
|
|
|
|
|
PROFIT/
(LOSS) AFTER TAX |
|
715.600 |
(5561.100) |
|
|
|
|
|
|
|
|
Share
of Profit/(Loss) from Associate |
|
114.800 |
0.300 |
|
|
|
|
|
|
|
|
Share of Profit/(Loss) of Minority |
|
14.700 |
7.100 |
|
|
|
|
|
|
|
|
PROFIT
/ (LOSS) FOR THE YEAR |
|
815.700 |
(5567.900) |
|
|
|
|
|
|
|
|
Earnings
/ (Loss) Per Share (INR) |
|
2.29 |
(24.33) |
LEGAL
CASES
|
IN THE HIGH COURT OF DELHI AT NEW DELHI + ITA 69/2018
& CM No. 2641/2018 PRINCIPAL
COMMISSIONER OF INCOME TAX, DELHI-5 ….Appellant
Through: Proxy counsel
for Mr. Rahul Kaushik, Sr. Standing
Counsel for Revenue. Versus JINDAL STANLESS LIMITED ….Respondent
Through: Mrs. Kavita
Jha with Me. Vaibhav Kulkarni and Ms.
Devika Jain, Advs. CORAM: HON’BLE MR. JUSTICE S. RAVINDRA BHAT HON’BLE MR. JUSTICE A.K. CHAWLA O
R D E R % 22.01.2018 A REQUEST FOR ADJUSTMENT IS MADE ON BEHALF OF THE Revenue List on
04.04.2018. S.
RAVINDRA BHAT, J A.K.
CHAWLA, J JANUARY 22, 2018 KKS |
LOCAL AGENCY FURTHER INFORMATION
|
Sr. No. |
Check list by
info agents |
Available in
Report (Yes/No) |
|
1 |
Year of establishment |
Yes |
|
2 |
Constitution of the entity -Incorporation
details |
Yes |
|
3 |
Locality of the entity |
Yes |
|
4 |
Premises details |
No |
|
5 |
Buyer visit details |
-- |
|
6 |
Contact numbers |
Yes |
|
7 |
Name of the person contacted |
Yes |
|
8 |
Designation of contact person |
Yes |
|
9 |
Promoter’s background |
Yes |
|
10 |
Date of Birth of Proprietor / Partners /
Directors |
Yes |
|
11 |
Pan Card No. of Proprietor / Partners |
No |
|
12 |
Voter Id Card No. of Proprietor / Partners |
No |
|
13 |
Type of business |
Yes |
|
14 |
Line of Business |
Yes |
|
15 |
Export/import details (if applicable) |
No |
|
16 |
No. of employees |
Yes |
|
17 |
Details of sister concerns |
Yes |
|
18 |
Major suppliers |
No |
|
19 |
Major customers |
No |
|
20 |
Banking Details |
Yes |
|
21 |
Banking facility details |
Yes |
|
22 |
Conduct of the banking account |
-- |
|
23 |
Financials, if provided |
Yes |
|
24 |
Capital in the business |
Yes |
|
25 |
Last accounts filed at ROC, if applicable |
Yes |
|
26 |
Turnover of firm for last three years |
Yes |
|
27 |
Reasons for variation <> 20% |
-- |
|
28 |
Estimation for coming financial year |
No |
|
29 |
Profitability for last three years |
Yes |
|
30 |
Major shareholders, if available |
Yes |
|
31 |
External Agency Rating, if available |
Yes |
|
32 |
Litigations that the firm/promoter
involved in |
Yes |
|
33 |
Market information |
-- |
|
34 |
Payments terms |
No |
|
35 |
Negative Reporting by Auditors in the
Annual Report |
No |
CORPORATE AND GENERAL
INFORMATION
Subject is domiciled and incorporated in India and its equity shares and GDR are listed at Bombay Stock Exchange (BSE) /National Stock Exchange (NSE) and at Luxemburg Stock Exchange (LSE) respectively. The registered office is located at O. P. Jindal Marg Distt. : Hisar – 125005 Haryana, India.
The Company is a leading manufacturer/producer of Stainless steel flat products in Austenitic, Ferritic, Martensitic and Duplex grades. The product range includes Ferro Alloys, Stainless Steel Slabs, Hot Rolled Coils, Plates and Sheets, and Cold Rolled Coils and Sheets. The financial statements of the company for the year ended 31st March 2017 were approved and authorized for issue by board of directors in their meeting held on 12th May 2017.
FINANCIAL HIGHLIGHTS
The Company has adopted Indian Accounting Standards (Ind AS) prescribed under Section 133 of the Companies Act, 2013, read with the Companies (Accounting Standard) Rules, 2015, as amended, w.e.f. April 1, 2016 and the above results have been prepared in compliance with Ind AS. Ind AS has replaced the existing Indian GAAP prescribed under Section 133 of the Companies Act, 2013 read with Rule 7 of Companies (Accounts) Rules, 2014.
The financial results for the year ended March 31, 2016 have been restated to comply with Ind AS to make them comparable.
A Composite Scheme of Arrangement (the 'Scheme') amongst the Company, Jindal Stainless (Hisar) Limited, Jindal United Steel Limited, Jindal Coke Limited and their respective shareholders and creditors under the provision of Sec 391-394 of the Companies Act, 1956 and other applicable provisions of Companies Act, 1956 and/ or Companies Act, 2013 was sanctioned by the Hon'ble High Court of Punjab and Haryana, Chandigarh (High Court) pursuant to its Order dated 21st September 2015 (as modified on 12th October, 2015). The certified copy of the said order was filed with the office of the Registrar of Companies on 1st November, 2015. Consequent thereupon, Sections I and II of the Scheme became operative with effect from the Appointed Date 1 i.e. close of business hours before midnight of 31st March, 2014. Further, the Company received approval from the Orissa Industrial and Infrastructure Development Corporation Limited (OIIDCO) on 24th September, 2016 with respect to transfer / right to use the land on which Hot Strip Mill (HSM) and Coke Oven Plant is located from the Company to Jindal United Steel Limited and Jindal Coke Limited respectively and consequent thereupon, Sections III and IV of the Scheme became operative with effect from the Appointed Date 2 i.e. close of business hours before midnight of 31st March, 2015. The impact of the implementation of the Scheme has been reflected in the financial results for the years ended on 31st March, 2016 and on 31st March, 2017.
During the year, the Revenue from operations of the Company on standalone basis has increased by 27.45% at INR 89574.000 Million as compared to INR 70282.400 Million during previous financial year 2015-16. The Profit before other income, Finance Cost, Depreciation, Exceptional Items, Tax and Amortisation (EBIDTA) on standalone basis stood at INR 11067.000 Million as compared to INR 5209.400 Million during previous year. The Net profit on standalone basis stood at INR 583.400 Million as compared to a net loss of INR 5591.200 Million during previous year.
Further, during the year, the consolidated Revenue from operations, of the Company has increased by 29.84% at INR 99247.800 Million as compared to INR 76438.600 Million during previous financial year 2015-16. Consolidated Profit before other income, Finance Cost, Depreciation, Exceptional Items, Tax and Amortization (EBIDTA) stood at INR 11655.900 Million as compared to INR 5727.300 Million during previous year. The Net profit on consolidated basis stood at INR 815.700 Million as compared to a net loss of INR 5567.900 Million during previous year.
During the year, the operations of the Company improved significantly and the EBIDTA of the Company on standalone basis increased by 102% over the last financial year. However, the high interest burden continued to put pressure on the profitability of the Company.
OUTLOOK
The world economy is gaining momentum after a dull outturn in 2016. Economic growth is expected to increase to 3.5% in 2017 from 3.1% in 2016, as per International Monetary Fund (IMF). Improved economic activity is likely to push the growth further. Economic performance across most regions is recovering but US policy uncertainty poses a concern.
Growth in emerging markets including India remains subdued. IMF projects slowdown in Indian economy on account of demonetisation with GDP growth rate estimates revised to 7.2 % for 2017-18. Further, outlook for the Asian region remains sluggish with an exception of China.
As per International Stainless Steel Forum, global stainless steel production increased to 45.8 MT in 2016, China being the highest contributor. According to estimate by Steel and Metals Market Research (SMR), global stainless steel demand will increase by 4% in 2017. In India, domestic demand will grow by over 9% in next five years as per Indian Stainless Steel Development Association (ISSDA). Major demand is expected from the Architecture, Building and Construction (ABC) segment while Automobile, Railway and Transport (ART) will also provide stimulus. Prospects of normal monsoon project a GDP growth of above 7% in 2017-18.
OPERATIONS
The Company has been able to improve its performance significantly during the year 2016-17 despite the adverse global position of Stainless Steel industry. Steel Melting Shop produced 7,22,995 MT as compared to 6,03,852 MT in the last year, having rolled both stainless steel material (7,04,680 MT) and mild steel material (3,41,798 MT), Plate Finishing Shop produced 46,966 MT against 33,082 MT in last year, HAPL in CRM produced 5,92,113 MT against 5,34,138 MT in last year and CAPL in CRM produced 3,44,725 MT against 3,11,923 MT produced in last year. The production at Ferro Alloys during the year was 2,05,510 MT against 1,54,309 MT during last year.
The captive Power Plants (2X125MW) generated 1,784.92 million units (net) of power as compared to 1,620.26 million units (net) in the last year. The Company is certified for various product and system certifications including integrated management system comprising of ISO 9001:2008 Quality Management System (ISO 9001:2008), Environment Management System (ISO 14001:2004) and Health and Safety Management System as per BS OHSAS 18001:2007. And further up-gradation of ISO 9001 and 14001 for 2015 version is under process.
The Company is now in receipt of REACH/RoHS certification for 200, 300 and 400 series stainless steel grades. This includes compliance to the 7 new additions of substances of very high concern (SVHC) in the REACH regulation 1907/2006. Scope of Construction Product Directive (CE Marking) certification is expanded to include grades – EN 1.4003, 1.4016, 1.4512 and 1.4372. This has enabled the Company to be the preferred and certified manufacturers of stainless for construction field in European market with 10 grades covered under CE marking scope. Validity of AD/ PED certification has been extended to Feb 2019 along with the grade additions of EN 1.4003. The Company's Jajpur unit has also successfully completed DNV audit against DNV guidelines for Manufacturer Product Quality Assessment (Level 4) and Marine approvals.
Asset Monetization
and Business Reorganization Plan (AMP) and Composite Scheme of Arrangement
The Company, after having various rounds of discussions with the CDR Lenders, had finalized a comprehensive plan of Asset Monetization cum Business Reorganisation Plan (“AMP”), which entailed monetization of identified business undertaking(s) of the Company through demerger/slump sale(s) and utilization of the proceeds of the slump sale(s) in reduction of debt of the Company.
As a part of the above said AMP, a Composite Scheme of Arrangement among the Company and its three wholly owned subsidiary companies viz. Jindal Stainless (Hisar) Limited (“JSHL”), Jindal United Steel Limited (“JUSL”) and Jindal Coke Limited (“JCL”) and their respective creditors and shareholders was undertaken which was approved by the Hon'ble High Court of Punjab and Haryana at Chandigarh, vide its order dated 21st September, 2015 (as modified on 12th October, 2015), Certified true copy of the said Order was filed on 1st November, 2015, with the office of Registrar of Companies, NCT of Delhi and Haryana. Consequently, Section I (pertaining to demerger of Mining Division and Ferro Alloys Division and vesting the same in JSHL) and Section II (pertaining to slump sale of manufacturing facility at Hisar from the Company to JSHL) of the Scheme became operative from the Appointed Date 1 i.e. close of business hours before midnight of 31st March, 2014. The Scheme envisaged demerger of Mining Division including the Chromite Mines located at Sukinda and vesting the same in JSHL, however, the Company did not receive approval from the Ministry of Mines, Government of Odisha for transfer of the said Mines to JSHL, therefore, the Board of Directors of the Company in its meeting held on 23rd November, 2016, in terms of clause 1.10 of Section V of the Scheme, decided not to transfer the Mines to JSHL.
Section III and IV of the Scheme with respect to JUSL and JCL respectively became operative from Appointed Date 2 i.e. close of business hours before midnight of 31st March, 2015, and became effective upon receipt of approval from Orissa Industrial and Infrastructure Development Corporation Limited (OIIDCO), on 24th September, 2016, with respect to the transfer / right to use the land on which Hot Strip Mill and Coke Oven Plant is located, from the Company to JUSL and JCL respectively.
Post implementation of the Scheme, the Company has already received an amount of INR 26000.000 INR as consideration for slump sale from JSHL, which has been utilized to prepay the debts of the Company and accordingly the debt of the Company as on date has been reduced to that extent. The Company has further received an amount of ` 2355 Crore from JUSL and INR 4900.000 INR from JCL towards consideration of slump sale and interest free security deposit for sharing infrastructure facilities in due course and that amount shall also be utilized to prepay the debts of the Company.
On 26th May, 2017, the Company has allotted (I) 605,70,320 equity shares of face value of INR 2 each (“Equity Shares”) and (ii) 14,28,30,637 - 0.01% Optionally Convertible Redeemable Preference Shares of face value of INR 2 each ("OCRPS) to the lenders of the Company upon conversion of the Funded Interest Term Loan I and the Funded Interest Term Loan II at a price of INR 39.10 (including premium of INR 37.10) per Share/OCRPS, aggregating to INR 236,82,99,512; and INR 558,46,77,906.70 respectively. In view of above the AMP scheme implementation is substantially complete.
MANAGEMENT DISCUSSION AND ANALYSIS
FORWARD-LOOKING
STATEMENT
This Annual Report includes forward-looking statements regarding guidance, industry prospects, or future results of operations or financial position. They use words such as anticipates, believes, expects, future, intends, and similar expressions to identify forward looking statements. Forward-looking statements reflect management's current expectations and are inherently uncertain. Actual results could differ materially for a variety of reasons, including, among others, fluctuations in foreign exchange rates, changes in global economic conditions and customer spending, world events and the rate of growth among others. The company assumes no responsibility to amend, modify or revise any such statements. The company disclaims any obligation to update these forward-looking statements except as may be required by law.
OVERVIEW
Jindal Stainless Limited continued to march ahead on its all-encompassing vision of Improving Lives transforming at a rapid pace and catering to the requirements of millions of people globally. Rooted in this cause, the organization has been able to scale-up its market reach, improve all key operational parameters, strengthen relationships with stakeholders and engage in welfare of the society through several new initiatives.
Stainless Steel is an extremely versatile metal and awareness about this metal is growing in multiple segments like Architecture, Building and Construction (ABC), Automotive, Road and Transport (ART) and process engineering. As a result of diversification into new segments, stainless steel today enjoys high visibility through its usage in metro train, Rajdhani coaches or bus queue shelters. In fact, compared to the situation which prevailed in the early 1990s, when utensils and kitchenware segment accounted for most of the stainless steel consumption in India, the sector consumers only 55% of the total production. The other notable developments include increased usage of stainless steel in the infrastructure projects including smart cities and individual home space going beyond utensils and new applications such as overhead water storage tanks. Moreover, with more stringent norms like Euro-VI kicking in by 2020, consumption of stainless steel is expected to get a further boost.
With India now emerging as one of the fastest growing consumer of stainless steel, countries saddled with excess stainless steel capacity are eyeing this market. Today, the biggest threat is from China, which has a surplus production of 3 million metric tons of stainless steel. Despite operating at 69% capacity utilization, it still continues to add capacities. There have been frequent instances of trade remedial action against China in stainless steel but they have failed to address these concerns. The industry has taken up this issue with the Government and is eagerly awaiting a solution.
With increased demand of stainless steel in traditional and uncharted sectors along with their unique experience in delivering highest quality product and customer experience, they are confident to maintain their position as a leading stainless steel company in the world. The company recorded highest ever production and revenue numbers (details in subsequent sections), while ensuring global standards of corporate governance. Going forward, they seek to invest efficiently in several areas of technology to enhance the customer experience and improve their process efficiencies. Inside Jindal Stainless, they will continue to bet on building market awareness, developing new applications of stainless steel and creating a customer-oriented culture to build a sustainable differentiation for the company.
ECONOMIC OUTLOOK
The financial year 2016-17 was marked by major events such as the US Presidential election and UK's Brexit referendum that contributed to socio-economic uncertainty. However, global growth prospects improved and fears of deflation receded towards the end of the year, helped by rising commodity prices and hopes of a fiscal stimulus in the US. International Monetary fund (IMF) revised the world output growth to 3.1% in 2016 and expect it to further increase to 3.4 percent in 2017 and 3.6 percent in 2018, slightly above the October 2016 World Economic Outlook (WEO) forecast. Overall, although global economy has started to pick-up, major structural impediments (low productivity growth and high-income inequality) and deflationary pressures in markets like Japan is likely to persist in the medium term.
Similarly, activities is projected to pick up markedly in emerging market and developing economies contributing to over 75% of global growth in output and consumption. In India, the growth forecast remains between 7 and 8 percent, slightly lower than earlier estimates primarily because of the temporary negative consumption shock induced by cash shortages and payment disruptions from the recent currency exchange initiative. Medium-term growth prospects are favorable, driven by key reforms, loosening of supply-side bottlenecks, and appropriate fiscal and monetary policies.
Moreover, the ushering in of the GST regime promises to bring in an era of fiscal stability, elimination of procedural bottle necks and promotion of uniformity in the taxation structure. Such initiatives by the Government of India along with the focus on developing infrastructure in the form of Smart Cities, stations redevelopment, metro projects in 50 cities, new and emerging areas like water management and sewage treatment, public projects like bus shelters, bio toilets among others, will definitely add to many more prospects for business growth in the coming years.
GLOBAL STAINLESS
STEEL SCENARIO
The demand and production of stainless steel witnessed robust growth across the world. As per the data provided by the International Stainless Steel Forum (ISSF), melt shop production in the world surged by 10.2%, growing from 41.5 million metric tones (MT) in 2015 to 45.8 MT in 2016. Most of the production growth was driven by China that grew by 15.7% year–on–year.
Overall, stainless steel demand index increased by 50% in the last 6 years. World Average Per Capita Consumption of stainless steel increased to 5.2 Kg in place of 5 Kg in 2015 with Taiwan, Korea and Japan being the major consumers of stainless steel in terms of per capita consumption. About 75% of the total consumption has come from sectors like metal products (37.8%) followed by mechanical engineering (27.8%), and motor vehicles and parts (9.6%).
China continues to be single most dominant force both in production and consumption of Stainless Steel. China witnessed accelerated growth of cold-rolled consumption in 2016 primarily due to the credit creation stimulus by the government which led to demand growth in sectors like infrastructure, real estate, and vehicle production. While the Chinese domestic market thrived, exports from China remained under check due to
ADD and countervailing duties imposed by European and USA government. This ensured that domestic industries struggled to compete and prices remained under stress in the non-tariff countries. On the raw material side, after a steep decline by the end of 2015 and start of 2016, nickel prices increased considerably to reach above $11,000pmt levels in the month February 2017primarily due to nickel mines ban in Philippines and also due to increase in Chinese stainless steel production. Major corrections happened in nickel prices post announcements of Indonesian government on nickel export ban relaxations which played an important part in pushing the nickel prices downwards from March 2017 onwards. Prices are expected to remain between $10,000 - $12,000 levels given the expected record production of stainless steel of 46 million MT, resulting in total demand of virgin nickel as 2.08 million MT against supply of 2.03 million MT.
Measured over a period of 25 years, from 1980 to 2015, the compound annual growth rate (CAGR) of stainless steel stands way higher than that of other metals in the world. Here's a snapshot on how stainless steel has grown over the long haul as a preferred choice among metals:
Financial Year 2016-17 was marked by an increase of stainless steel prices in Western Europe, USA, China and South East Asia. The price increase was particularly supported by soaring alloy costs and lower levels of distribution stocks. Moreover, during October–November 2016, South African producers of ferro-chrome announced a rise in prices that further strengthened the prices of stainless steel in second half of FY2016-17.
INDIA STAINLESS STEEL
SCENARIO
Having claimed the second position worldwide in stainless steel production in FY17, the Indian stainless steel industry is now second only to China. India registered a growth of 8.6% per annum in 2016 year-on-year, with increasing the total melt shop production to 3.32 million metric tons in 2016 from 3.1 million metric tons in 2015.India's growth momentum is likely to accelerate even further, spurred by several government initiatives viz. Smart Cities, Make in India, improving sanitation facilities, better waste management and infrastructure creation. Moreover, India's per capita consumption of stainless steel is still only 1.9 -2 Kg (as compared to the world average of 5.2 kg) indicating an immense potential for growth.
Imports and dumping from countries like China saw a staggering rise in imports by about 15% in the first nine months of the fiscal, and were only reduced after the imposition of the Quality Control Order (QCO) in February 2017. Overall, imports in FY 16-17 remained stagnant at same levels as in FY15-16.
STAINLESS STEEL
CONSUMPTION IN INDIA
The stainless steel consumption in India can be classified broadly into 6 to 7 categories – Cookware and Durables; Process Industry; Engineering Goods; Electro Mechanical Industries; Architectural, Building and Construction (ABC); Automobile, Railways and Transportation (ART) and other miscellaneous products. Out of these Cookware and Durables; Process Industry; Engineering Goods and Electro Mechanical Industries are relatively mature applications areas whereas areas like ABC, ART and miscellaneous new applications are still evolving in the country and have a great potential for growth. In line with these expectations, the pattern of stainless steel consumption by end use is likely to change in future.
EMERGING MAJOR
CATEGORIES IN USAGE OF STAINLESS STEEL:
The automotive, railway and transport (ART) sector is now emerging as the sector with the fastest growing consumption of stainless steel in the country. As information on the virtues of this metal is disseminated to the masses, it will only find greater acceptance in wide ranging applications. An example of this is the policy announcement by Ministry of Railways to the effect that from 2017-18 onwards, there will be ambitious program to convert 55,000 coaches to LHB technology which will entail the usage of stainless steel. Initiatives such as these will help to spread the message of stainless steel amongst the masses.
Another emerging segments for stainless steel consumption is the Architecture, Building and Construction (ABC) sector. The ABC sector is mostly driven by growth in the Indian real estate sector consisting of residential real estate, commercial real estate, retail space, entertainment space, hospitality projects and Special Economic Zones. The current use of Stainless Steel in the construction segment in their country is miniscule, but growing rapidly driven by rapid urbanization (elevators and escalators); integrated applications (modular kitchens etc); and architectural products (building facades, decorative material etc).
UNSECURED LOAN
|
Unsecured Loan |
31.03.2017 (INR in Million) |
31.03.2016 (INR in Million) |
|
Long-term
Borrowings |
|
|
|
Public Fixed Deposits |
0.000 |
0.000 |
|
Inter Corporate Deposits from related Party |
4850.000 |
0.000 |
|
(a) The term loan amount to INR 485 Crores shall be repayable in one or more installments by 31st March, 2023 or such other terms as may be mutually agreed between the Company and Jindal Stainless (Hisar) Limited. |
|
|
|
|
|
|
|
Short-term
borrowings |
|
|
|
Inter Corporate Deposits from related Party |
0.000 |
1926.600 |
|
|
|
|
|
Total |
4850.000 |
1926.600 |
INDEX OF CHARGES:
|
SNo |
SRN |
Charge Id |
Charge Holder Name |
Date of Creation |
Date of
Modification |
Date of
Satisfaction |
Amount |
Address |
|
1 |
G51545515 |
100118547 |
L&T FINANCE LIMITED |
24/07/2017 |
- |
- |
3000000000.0 |
TECHNOPOLIS, 7th Floor, A- Wing, Plot No. - 4,Block - BP, Sector -V, Salt LakeKolkataWe700091IN |
|
2 |
G49383144 |
100106339 |
Bank of Baroda |
29/06/2017 |
30/06/2017 |
- |
3000000000.0 |
Corporate Financial Service,Large Corporate Branch1st Floor, Bank of Baroda Building, 16,Sansad MargDelhiDL110001IN |
|
3 |
G04864484 |
100022451 |
SBICAP TRUSTEE COMPANY LIMITED |
26/02/2016 |
13/05/2016 |
- |
9580000000.0 |
202, MAKER TOWER, 'E', CUFFE PARADE,COLABAMUMBAIMH400005IN |
|
4 |
B79781340 |
10437270 |
SBICAP TRUSTEE COMPANY LIMITED |
18/07/2013 |
- |
- |
6331100000.0 |
202, Maker Tower E,Cuffe Parade,MumbaiMH400005IN |
|
5 |
B80050396 |
10244217 |
SBICAP TRUSTEE COMPANY LIMITED |
05/10/2010 |
18/07/2013 |
- |
1800000000.0 |
202, Maker Tower E,Cuffe Parade,MumbaiMH400005IN |
|
6 |
B79870341 |
10244214 |
SBICAP TRUSTEE COMPANY LIMITED |
05/10/2010 |
18/07/2013 |
- |
360000000.0 |
202, MAKER TOWER, 'E', CUFFE PARADECOLABA,MUMBAIMH400005IN |
|
7 |
B80050008 |
10244254 |
SBICAP TRUSTEE COMPANY LIMITED |
05/10/2010 |
18/07/2013 |
- |
4407000000.0 |
202, Maker Tower ECuffe ParadeMumbaiMH400005IN |
|
8 |
B79868766 |
10244207 |
SBICAP TRUSTEE COMPANY LIMITED |
05/10/2010 |
18/07/2013 |
- |
160000000.0 |
202, MAKER TOWER, 'E', CUFFE PARADECOLABA,MUMBAIMH400005IN |
|
9 |
B80064090 |
10244258 |
SBICAP TRUSTEE COMPANY LIMITED |
05/10/2010 |
18/07/2013 |
- |
3416600000.0 |
202, Maker Tower E,Cuffe Parade,MumbaiMH400005IN |
|
10 |
B80050669 |
10244257 |
SBICAP TRUSTEE COMPANY LIMITED |
05/10/2010 |
18/07/2013 |
- |
4639200000.0 |
202, Maker Tower ECuffe ParadeMumbaiMH400005IN |
UNAUDITED STANDALONE
FINANCIAL RESULTS FOR THE QUARTER AND NINE MONTHS ENDED 31ST
DECEMBER 2017
|
|
|
Particulars |
Quarter Ended |
Quarter Ended |
Nine months ended |
|
|
|
|
31.12.2017 |
30.09.2017 |
31.12.2017 |
|
|
|
Income from
Operations |
|
|
|
|
|
|
Sales/Income from Operations (Gross) |
29888.600 |
26078.400 |
77910.100 |
|
|
|
Other Income |
108.000 |
143.400 |
346.900 |
|
|
Total Income from
Operations (Net) |
29996.600 |
26221.800 |
78257.000 |
|
|
|
Expenses |
|
|
|
|
|
|
a) |
Cost of Materials consumed |
16649.700 |
14573.200 |
44854.200 |
|
|
b) |
Purchase of Stock-in-trade |
2304.200 |
1722.800 |
4036.800 |
|
|
c) |
Changes in inventories of finished goods, work-in-progress and
stock-in-trade |
(413.200) |
1148.600 |
(549.600) |
|
|
d) |
Excise Duty on Sale of Goods |
-- |
-- |
1791.200 |
|
|
e) |
Employee benefit expenses |
376.200 |
347.700 |
1008.500 |
|
|
f) |
Finance Costs |
1535.500 |
1609.100 |
4163.600 |
|
|
g) |
Depreciation and amortization expense |
769.100 |
759.400 |
2287.400 |
|
|
h) |
Stores and Spares Consumed |
1480.700 |
1159.100 |
3648.100 |
|
|
i) |
Power and Fuel |
1937.500 |
1727.800 |
5067.600 |
|
|
j) |
Other expenses |
3698.800 |
2834.400 |
9128.100 |
|
|
Total Expenses |
28338.000 |
25882.100 |
75435.900 |
|
|
|
|
|
|
|
|
|
|
Profit /(Loss)
before exceptional items and tax |
1658.600 |
339.700 |
2821.100 |
|
|
|
Exceptional Items |
383.900 |
145.100 |
340.900 |
|
|
|
Profit /(Loss) after exceptional items and before tax |
2042.500 |
484.800 |
3162.000 |
|
|
|
Tax Expense |
695.200 |
211.800 |
1126.700 |
|
|
|
Net Profit /(Loss)
after tax |
1347.300 |
273.000 |
2035.300 |
|
|
|
Other Comprehensive
Income |
|
|
|
|
|
|
A. Items that will not be reclassified to profit and loss |
-- |
-- |
-- |
|
|
|
B. Items that may be reclassified to profit and loss |
-- |
-- |
-- |
|
|
|
|
|
|
|
|
|
|
Total Comprehensive Income for the period |
1347.300 |
273.000 |
2035.300 |
|
|
|
|
|
|
|
|
|
|
Paid up equity share capital (Eq. shares of INR 2/- each) |
920.100 |
920.100 |
920.100 |
|
|
|
Reserve excluding revaluation reserves |
|
|
|
|
|
|
|
Earnings per share (before/after extraordinary items) of INR 2/- each |
|
|
|
|
|
|
Basic & Diluted |
2.93 |
0.59 |
4.54 |
Note:
1. The financial results of the Company for the quarter and nine months ended 31st December 2017 have been reviewed by the Audit committee and approved by the Board of Directors at their respective meetings held on 14th February, 2018 and tire Limited review of the same has been carried out by the auditors.
2. These results have been prepared in accordance with the Companies (Indian
Accounting Standards) Rules, 2015 (Ind AS) prescribed under Section 133 of the
Companies Act 2013 and other recognized accounting practices and policies to
the extent applicable.
3. Post section III and section IV of the Assets Monetization Cum Business
Reorganisation Plan (Scheme) becoming effective, as per the Scheme the Company
is continuing to operate the business on behalf of Jindal Coke Limited
("JCL") and Jindal United Steel Limited ("JUSL") in trust
in so far as may be necessary until all rights, licenses/permits stand fully
devolved to and in favour of the resulting companies (JCL and JUSL).
Accordingly, the revenue and expenses in this regard for nine months ended 31st
December 2017 have been excluded from these results and the transcations
entered undertaken on behalf of such companies are recognised in Company's
books as inter-company balances.
4. Finance Cost is net of interest refund of Rs.10.35 crores for the quarter
ended 31st December 2017 (INR 925.600 Million for nine months ended 31st
December 2017) received from lenders on account of interest rate reset on term
loans and other loans w.e.f 1st April 2016.
5. Net foreign exchange gain/loss has been considered by the Company as
exceptional in nature.
6. As the Company's business activity falls within a single operating segment
viz. 'Stainless Steel', the disclosure requirement of Accounting Standard (Ind
AS 108) on "Operating Segments" is not applicable.
7. Impact of conversion of Funded Interest Term Loan ("FITL") into
equity and Optionally Convertible Redeemable Preference Share
("OCRPS"), being anti-dilutive, has not been considered for the
quarter and nine months ended 31st December 2016 and year ended 31st March
2017.
8. In compliance with Ind AS-18 and SEBI (Listing Obligations and Disclosure
Requirements) Regulation 2015, the reported revenue for the period upto 30th
June 2017 is inclusive of Excise duty. Goods and Service tax (GST) is made
applicable w.e.f. 1st July 2017 and as per Ind AS-18, revenue for the quarter ended
30th September 2017 and 31st December 2017 is net of GST, hence revenue from
operations for the quarter and nine months ended 31st December 2017 is not
comparable with corresponding quarter and previous period.
9. The Company had filed requisite applications for obtaining the approval of
the Central Government for payment of managerial remuneration to a director,
the said application is in process; remuneration paid to such director is INR
47.600 Million for the period from 6 November 2015 to 31 December 2017 (INR
4.500 Million and INR 15.000 Million for quarter and nine months ended 31
December 2017 respectively). Also, the Central Government has not approved the
excess managerial remuneration paid amounting to INR 32.600 Million to
erstwhile three directors, in earlier years, which is in process of recovery.
The Company has recorded excess remuneration as recoverable in the books of
account.
CONTINGENT
LIABILITIES:
(INR in million)
|
PARTICULARS |
31.03.2017 |
31.03.2016 |
|
(a) Guarantee issued by bank on behalf of Company |
1779.100 |
1709.300 |
|
(b) Letter of Credit |
7469.900 |
4429.400 |
|
(c) Bills discounted with Banks |
1005.700 |
1763.400 |
|
(d) (i) Sale Tax/Entry Tax demands against which company preferred appeals |
1489.500 |
894.700 |
|
(ii) Excise Duty/Custom/Service Tax Show Cause Notices/ Demands against which company has preferred appeals |
1001.700 |
932.200 |
|
(iii) Income tax demands against which Company has preferred appeals. |
468.200 |
468.200 |
|
(e) (i) Claims and other liabilities against the company not acknowledged as debt. |
553.400 |
643.000 |
|
(ii) Demand made by Dy. Director of Mines, Jajpur Road Circle, Orissa against which company has preferred appeal / disputed by the Company. |
65.400 |
80.400 |
|
B.(i) Custom duty saved / to be saved on 31st March, 2017 (Bonds executed with custom authorities for import under EPCG Scheme Outstanding INR 6.06 Crores (INR 3.11 Crores as on 31.03.2016 & INR 481.10 Crores as on 01.04.2015)). |
16.300 |
8.200 |
|
(ii) Custom Duty saved on material consumed imported under Advance License. |
0.000 |
50.600 |
|
C. Letter of Comfort to banks against Credit facilities/ financial assistance availed by subsidiaries |
517.300 |
1460.200 |
|
D. Appeals in respect of certain assessments of Sales Tax / Income Tax are pending and additional tax liabilities/refunds, if any, are not determinable at this stage. Adjustments for the same will be made after the same are finally determined. In the opinion of management there will not be material liability on this account. E. Corporate Guarantee given to banks against Credit facilities / financial assistance availed by Jindal Stainless (Hisar) Limited, amount for facilities outstanding as on 31st March, 2017 INR 3,392.78 Crores (INR 1,553.55 Crores). |
||
FIXED ASSETS
- Lease Hold Land
- Free Hold Land
- Buildings
- Plant and Machinery
- Electric Installation
- Vehicle
- Furniture and Fixture
- Office Equipment
PRESS RELEASE
JINDAL STAINLESS
MIGHT COMPLETE DE-MERGER BY MARCH END
Interest on loans of
INR 78000.000 Million has hit 14%; not feasible to repay debt without demerger,
says firm
As on 14, March 2017
Ratan Jindal- controlled Jindal Stainless Group, which has manufacturing units at Hisar (Haryana) and Odisha's Kalinganagar, is giving final touches to its de-merger. The de-merger which has involved the carving out of two separate entities -- Jindal United Steel Limited (JUSL) and Jindal Coke Limited (JCL) -- is expected to be completed by March end.
As of now, two flagship companies -- Jindal Stainless Hissar Limited and Jindal Stainless Limited -- are listed entities. The move behind the de-merger is to apportion debt between the segregated entities.
"Erosion of net worth, accumulating losses and rising interest rates have prompted us to take the de-merger route. The interest rate on loans outstanding has gone up to 14 per cent and it was not feasible to repay the piling debt without splitting the entities. We have got the necessary approvals for the restructuring plan and formalities are expected to be completed by March-end", said a senior company source in the know of the matter.
Between them, Jindal Stainless Hisar Limited (JSHL), Jindal Stainless Limited (JSL), JCL and JUSL have a debt totaling INR 78000.000 Million. After the de-merger, the debt would be distributed as: JSHL, INR 26000.000 Million, JSL, INR 23000.000 Million, JCL, INR 5000.000 Million and JUSL, INR 24000.000 Million. Jindal Stainless Group had gone for corporate debt restructuring (CDR) in 2009 at the time of global economic meltdown.
In the two newly incorporated entities- JUSL and JCL (both subsidiaries of JSL), JSL which oversees the Kalinganagar operations, will hold 26 per cent equity each. Balance shares would be held by the promoters' family.
As a fall-out of de-merger, JSL would handle Steel Melting Shop (SMS), ferro alloys, captive power plant (CPP) and railway siding. JUSL would take care of the Hot Strip Mill (HSM) operations and the onus would be on JCL to oversee coke oven operations. As of now, there are no plans to list either JUCL or JCL.
Separately, JSL has committed an investment of INR 5750.000 Million to de-bottleneck its Kalingangar unit and expand capacity to 1.1 million tonne per annum (mtpa) from 0.7 mtpa. The expansion would be met through the company's internal accruals. By 2020, JSL is eyeing capacity of 1.8 mtpa by investing INR 16000.000 Million. The facility at Kalinganagar produces all grades of stainless steel and exports to Europe and South East Asian countries. In the December quarter, JSL posted a profit of Rs 40 crore as against a loss of INR 1340.000 Million in the corresponding quarter of previous fiscal. Capacity utilisation of the Kalinganagar plant was 92 per cent in Q3 and sales volume was higher by 25 per cent.
CMT REPORT (Corruption, Money Laundering & Terrorism]
The Public Notice information has been collected from various sources
including but not limited to: The Courts,
1] INFORMATION ON
DESIGNATED PARTY
No records exist designating subject or any of its beneficial owners,
controlling shareholders or senior officers as terrorist or terrorist
organization or whom notice had been received that all financial transactions
involving their assets have been blocked or convicted, found guilty or against
whom a judgement or order had been entered in a proceedings for violating
money-laundering, anti-corruption or bribery or international economic or
anti-terrorism sanction laws or whose assets were seized, blocked, frozen or
ordered forfeited for violation of money laundering or international
anti-terrorism laws.
2] Court Declaration :
No records exist to suggest that subject is
or was the subject of any formal or informal allegations, prosecutions or other
official proceeding for making any prohibited payments or other improper
payments to government officials for engaging in prohibited transactions or
with designated parties.
3] Asset Declaration :
No records exist to suggest that the property or assets of the subject
are derived from criminal conduct or a prohibited transaction.
4] Record on Financial
Crime :
Charges or conviction
registered against subject: None
5] Records on Violation of
Anti-Corruption Laws :
Charges or
investigation registered against subject: None
6] Records on Int’l
Anti-Money Laundering Laws/Standards :
Charges or
investigation registered against subject: None
7] Criminal Records
No
available information exist that suggest that subject or any of its principals
have been formally charged or convicted by a competent governmental authority
for any financial crime or under any formal investigation by a competent
government authority for any violation of anti-corruption laws or international
anti-money laundering laws or standard.
8] Affiliation with
Government :
No record
exists to suggest that any director or indirect owners, controlling
shareholders, director, officer or employee of the company is a government
official or a family member or close business associate of a Government
official.
9] Compensation Package :
Our market
survey revealed that the amount of compensation sought by the subject is fair
and reasonable and comparable to compensation paid to others for similar
services.
10] Press Report :
No press reports / filings exists on
the subject.
CORPORATE GOVERNANCE
MIRA INFORM as part of its Due Diligence do provide comments on
Corporate Governance to identify management and governance. These factors often
have been predictive and in some cases have created vulnerabilities to credit
deterioration.
Our Governance Assessment focuses principally on the interactions
between a company’s management, its Board of Directors, Shareholders and other
financial stakeholders.
CONTRAVENTION
Subject is not known to have contravened any existing local laws,
regulations or policies that prohibit, restrict or otherwise affect the terms
and conditions that could be included in the agreement with the subject.
FOREIGN EXCHANGE RATES
|
Currency |
Unit
|
INR |
|
US Dollar |
1 |
INR 65.05 |
|
|
1 |
INR 89.69 |
|
Euro |
1 |
INR 80.03 |
INFORMATION DETAILS
|
Analysis Done by
: |
VRS |
|
|
|
|
Report Prepared
by : |
SUJ |
SCORE FACTORS
|
DEMERIT POINTS |
|
|
|
--BANK CHARGES |
YES/NO |
YES |
|
--LITIGATION |
YES/NO |
YES |
|
--OTHER ADVERSE INFORMATION |
YES/NO |
NO |
|
MERIT POINTS |
|
|
|
--SOLE DISTRIBUTORSHIP |
YES/NO |
NO |
|
--EXPORT ACTIVITIES |
YES/NO |
NO |
|
--AFFILIATION |
YES/NO |
YES |
|
--LISTED |
YES/NO |
YES |
|
--OTHER MERIT FACTORS |
YES/NO |
YES |
RATING EXPLANATIONS
|
Credit Rating |
Explanation |
Rating Comments |
|
A++ |
Minimum Risk |
Business dealings permissible with minimum
risk of default |
|
A+ |
Low Risk |
Business dealings permissible with low
risk of default |
|
A |
Acceptable Risk |
Business dealings permissible with
moderate risk of default |
|
B |
Medium Risk |
Business dealings permissible on a regular
monitoring basis |
|
C |
Medium High Risk |
Business dealings permissible preferably
on secured basis |
|
D |
High Risk |
Business dealing not recommended or on
secured terms only |
|
NB |
New Business |
No recommendation can be done due to
business in infancy stage |
|
NT |
No Trace |
No recommendation can be done as the
business is not traceable |
NB is stated where there is insufficient information to facilitate rating. However, it is not to be considered as unfavourable.
This score serves as a reference to assess SC’s
credit risk and to set the amount of credit to be extended. It is calculated
from a composite of weighted scores obtained from each of the major sections of
this report. The assessed factors are as follows:
·
Financial
condition covering various ratios
·
Company
background and operations size
·
Promoters
/ Management background
·
Payment
record
·
Litigation
against the subject
·
Industry
scenario / competitor analysis
·
Supplier
/ Customer / Banker review (wherever available)
This report is issued at
your request without any risk and responsibility on the part of MIRA INFORM
PRIVATE LIMITED (MIPL) or its officials.