|
|
|


MIRA INFORM REPORT
|
Report No. : |
508798 |
|
Report Date : |
17.05.2018 |
IDENTIFICATION DETAILS
|
Name : |
THESIZE SURFACES SOCIEDAD LIMITADA |
|
|
|
|
Registered Office : |
C/Ibers 31. Poligono Industrial Cami Fondo, Supoi 8. -
Almazora/Almassora - 12550 - Castellon |
|
|
|
|
Country : |
Spain |
|
|
|
|
Financials (as on) : |
31.12.2016 |
|
|
|
|
Date of Incorporation : |
26.07.2007 |
|
|
|
|
Legal Form : |
Private Company |
|
|
|
|
Line of Business : |
Subject is engaged in the purchase-sale and lease, except for the
financial one |
|
|
|
|
No. of Employees : |
149 |
RATING & COMMENTS
(Mira Inform has adopted New Rating mechanism w.e.f. 23rd
January 2017)
|
MIRA’s Rating : |
A+ |
|
Credit Rating |
Explanation |
Rating Comments |
|
A+ |
Low Risk |
Business dealings permissible with low
risk of default |
|
Status : |
Excellent |
|
|
|
|
Payment Behaviour : |
Regular |
|
|
|
|
Litigation : |
Clear |
NOTES :
Any query related to this report can be made on
e-mail : infodept@mirainform.com
while quoting report number, name and date.
ECGC Country Risk Classification List
|
Country Name |
Previous Rating (30.09.2017) |
Current Rating (31.12.2017) |
|
Spain |
A1 |
A1 |
|
Risk Category |
ECGC
Classification |
|
Insignificant |
A1 |
|
Low Risk |
A2 |
|
Moderately Low Risk |
B1 |
|
Moderate Risk |
B2 |
|
Moderately High Risk |
C1 |
|
High Risk |
C2 |
|
Very High Risk |
D |
SPAIN - ECONOMIC OVERVIEW
After a prolonged recession that began in 2008 in the wake of the global financial crisis, Spain marked the fourth full year of positive economic growth in 2017, with economic activity surpassing its pre-crisis peak, largely because of increased private consumption. The financial crisis of 2008 broke 16 consecutive years of economic growth for Spain, leading to an economic contraction that lasted until late 2013. In that year, the government successfully shored up its struggling banking sector - heavily exposed to the collapse of Spain’s real estate boom - with the help of an EU-funded restructuring and recapitalization program.
Until 2014, contraction in bank lending, fiscal austerity, and high unemployment constrained domestic consumption and investment. The unemployment rate rose from a low of about 8% in 2007 to more than 26% in 2013, but labor reforms prompted a modest reduction to 16.4% in 2017. High unemployment strained Spain's public finances, as spending on social benefits increased while tax revenues fell. Spain’s budget deficit peaked at 11.4% of GDP in 2010, but Spain gradually reduced the deficit to about 3.3% of GDP in 2017. Public debt has increased substantially – from 60.1% of GDP in 2010 to nearly 96.7% in 2017.
Strong export growth helped bring Spain's current account into surplus in 2013 for the first time since 1986 and sustain Spain’s economic growth. Increasing labor productivity and an internal devaluation resulting from moderating labor costs and lower inflation have improved Spain’s export competitiveness and generated foreign investor interest in the economy, restoring FDI flows.
In 2017, the Spanish Government’s minority status constrained its ability to implement controversial labor, pension, health care, tax, and education reforms. The European Commission expects the government to meet its 2017 budget deficit target and anticipates that expected economic growth in 2018 will help the government meet its deficit target. Spain’s borrowing costs are dramatically lower since their peak in mid-2012, and increased economic activity has generated a modest level of inflation, at 2% in 2017.
|
Source
: CIA |
EXECUTIVE
SUMMARY
|
|
|
|
|
|
Name: |
THESIZE SURFACES SOCIEDAD LIMITADA |
|
NIF / Fiscal code: |
B85171023 |
|
Status: |
ACTIVE |
|
Incorporation Date: |
26/07/2007 |
|
Register Data |
Register Section 8 Sheet 31918 |
|
Last Publication in BORME: |
07/02/2017 [Appointments] |
|
Last Published Account Deposit: |
2016 |
|
Share Capital: |
40.610.860 |
|
|
|
|
Localization: |
C/IBERS 31. POLIGONO INDUSTRIAL CAMI FONDO, SUPOI 8. -
ALMAZORA/ALMASSORA - 12550 - CASTELLON |
|
Telephone - Fax - Email - Website: |
Telephone. 964 652 233 Email. Info@thesice.es Website.
www.thesize.es |
|
Number of Branches |
1 |
|
|
|
|
Activity: |
|
|
NACE: |
2332 - Manufacture of bricks, tiles and construction
products, in baked clay |
|
Registered Trademarks: |
|
|
Audited / Opinion: |
Si / |
|
Tenders and Awards: |
|
|
Subsidies: |
3 for a total cost of 89082.82 |
|
Quality Certificate: |
No |
|
|
|
|
Payment Behaviour: |
According to the agreed terms |
|
Prospects: |
Consolidation |
|
Industry situation: |
Maturity |
|
|
|
|
Defaults, Legal Claims and Insolvency Proceedings : |
|
|
|
|
|
|
|
Number |
Amount (€) |
Most Recent Entry |
|
Insolvency Proceedings, Bankruptcy and Suspension of
Payments |
|
Unpublished |
--- |
--- |
|
Defaults on debt with Financial Institutions and Large
Companies |
|
None |
--- |
--- |
|
Judicial Claims (Notices, Executive Proceedings,
Attachments, Auctions, Bad Debt) |
|
None |
0 |
--- |
|
Proceedings heard by the Civil Court |
|
Unpublished |
0 |
--- |
|
Proceedings heard by the Labour Court |
|
Unpublished |
0 |
--- |
|
|
|
Partners: |
|
|
|
GLOBAL SURFACES SA |
99 % |
|
|
Shares: |
7 |
|
|
Other Links: |
4 |
|
|
No. of Active Corporate Bodies: |
JOINT MANAGER 2 |
|
|
Ratios |
2016 |
2015 |
Change |
|
|
Nº of employees: |
149 |
|
|
|
|
|
|
|
Guarantees: |
|
|
Properties Registered: |
Company NO, Administrator NO |
|
Financing / Guarantee Sources : |
Sources YES, Guarantees NO |
|
|
|
|
|
|
|
INVESTIGATION SUMMARY |
|
|
The company was incorporated in 2007 and is engaged in the
manufacture and handling of natural stone and granite. It markets its
products under the brands "Neolit" and "Granith". The
subject operates at the national and international level. No negative
comments have been made upon the subject, according to the consulted sources.
However, and as its accounting development could not be fully assessed, we
recommend doing a follow up. |
|
|
Interviewed Person: |
|
Enquiry
Details
|
|
Identification |
|
|
Social Denomination: |
THESIZE SURFACES SOCIEDAD LIMITADA |
|
NIF / Fiscal code: |
B85171023 |
|
Corporate Status: |
ACTIVE |
|
Start of activity: |
2007 |
|
Registered Office: |
C/IBERS 31. POLIGONO INDUSTRIAL CAMI FONDO, SUPOI 8. |
|
Locality: |
ALMAZORA/ALMASSORA |
|
Province: |
CASTELLON |
|
Postal Code: |
12550 |
|
Telephone: |
964 652 233 |
|
Fax: |
964 652 209 |
|
Website: |
www.thesize.es |
|
Email: |
Info@thesice.es |
|
Interviewed Person: |
La presente información ha sido obtenida a través de fuentes
indirectas, ante la negativa por parte de los responsables de la titular de
prestar cualquier tipo de colaboración para la confección del presente
trabajo. |
Branch
Offices
|
|
|
|
|
|
Address |
Postal Code |
City |
Province |
|
AVENIDA LOS ROSALES 42 NAV 301 |
28021 |
MADRID |
MADRID |
Activity
|
|
|
NACE: |
2332 |
|
Corporate Purpose: |
The company is engaged in the purchase-sale and lease,
except for the financial one. |
|
Additional Information: |
It is also engaged in the manufacture and handling of
natural stone and granite. |
|
Additional Address: |
The Registered Office, work centre and offices are
located at the heading address. The fiscal domicile is located at Avda. de
los Rosales, 42 de Madrid. |
|
Franchise: |
No |
|
Import / export: |
EXPORTS |
|
Future Perspective: |
Consolidation |
|
Industry situation: |
Maturity |
Number
of Employees
|
|
|
|
|
|
|
Year |
No. of employees |
Established |
Incidentals |
|
|
|
2016 |
149 |
|
|
|
The
data of employees is from the latest available financial statements in. Failing
that, are estimates data calculated by statistical methods
Chronological
Summary
|
|||
|
|
|
|
|
|
|
Year |
Act |
|
|
|
2007 |
Appointments/ Re-elections (1) Company Formation (1) |
|
|
|
2008 |
Accounts deposit (year 2007) Appointments/ Re-elections
(3) Cessations/ Resignations/ Reversals (2) Dividends Payment (1) Increase of
Capital (1) Statutory Modifications (1) |
|
|
|
2009 |
Accounts deposit (year 2008) Appointments/ Re-elections
(1) Cessations/ Resignations/ Reversals (1) Dividends Payment (1) Increase of
Capital (1) |
|
|
|
2010 |
Appointments/ Re-elections (4) Cessations/ Resignations/
Reversals (3) Change of Social address (1) Statutory Modifications (1) |
|
|
|
2011 |
Accounts deposit (year 2009) Increase of Capital (1)
Statutory Modifications (1) |
|
|
|
2012 |
Accounts deposit (year 2010, 2011) Appointments/
Re-elections (3) Capital Reduction (3) Cessations/ Resignations/ Reversals
(1) Company Transformation (1) Disapproved accounts (1) Increase of Capital
(2) Other Concepts/ Events (1) Reopening of an entry in the Register (1)
Statutory Modifications (2) |
|
|
|
2013 |
Accounts deposit (year 2012) Appointments/ Re-elections
(1) Cessations/ Resignations/ Reversals (1) Company Transformation (1)
Increase of Capital (1) Statutory Modifications (2) |
|
|
|
2014 |
Accounts deposit (year 2013) Appointments/ Re-elections
(1) Cessations/ Resignations/ Reversals (1) Change of Social Denomination (1)
Statutory Modifications (2) |
|
|
|
2015 |
Accounts deposit (year 2014) Appointments/ Re-elections
(2) |
|
|
|
2016 |
Accounts deposit (year 2015) Appointments/ Re-elections
(2) Cessations/ Resignations/ Reversals (2) |
|
|
|
2017 |
Accounts deposit (year 2016) Appointments/ Re-elections
(2) |
|
Breakdown
of Owners' Equity
|
|
|
Registered Capital: |
40.610.860 |
|
Paid up capital: |
40.610.860 |
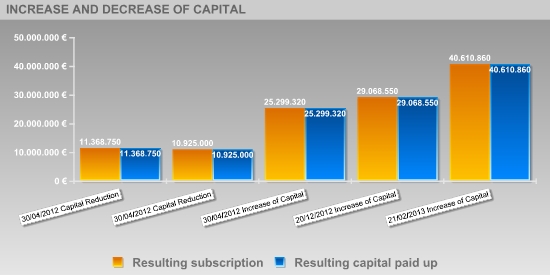
Updated
Evolution of the Subscribed and Paid-in Capital
|
|||||
|
|
|
|
|
|
|
|
|
|||||
|
|
|
|
|
|
|
|
Publishing Date |
Registration Type |
Capital Subscribed |
Paid up capital |
Underwritten result |
Disbursed Result |
|
23/08/2007 |
Company Formation |
60.200 |
60.200 |
60.200 |
60.200 |
|
27/03/2008 |
Increase of Capital |
1.939.800 |
1.008.696 |
2.000.000 |
1.068.896 |
|
13/11/2008 |
Capital call payment |
--- |
931.104 |
2.000.000 |
2.000.000 |
|
03/03/2009 |
Increase of Capital |
2.000.000 |
1.000.000 |
4.000.000 |
3.000.000 |
|
22/05/2009 |
Capital call payment |
--- |
1.000.000 |
4.000.000 |
4.000.000 |
|
10/01/2011 |
Increase of Capital |
7.500.000 |
3.368.750 |
11.500.000 |
7.368.750 |
|
30/04/2012 |
Capital Reduction |
-131.250 |
-131.250 |
11.368.750 |
11.368.750 |
|
30/04/2012 |
Capital Reduction |
-443.750 |
-443.750 |
10.925.000 |
10.925.000 |
|
30/04/2012 |
Increase of Capital |
14.374.320 |
14.374.320 |
25.299.320 |
25.299.320 |
|
20/12/2012 |
Increase of Capital |
3.769.230 |
3.769.230 |
29.068.550 |
29.068.550 |
|
21/02/2013 |
Increase of Capital |
11.542.310 |
11.542.310 |
40.610.860 |
40.610.860 |
Active
Social Bodies
|
|
|
|
|
|
Post published |
Social Body's Name |
Appointment Date |
Other Positions in this Company |
|
JOINT MANAGER |
DOMUS MARMOLES SL |
29/07/2014 |
1 |
|
|
DIMORPHANDRA SL |
29/07/2014 |
1 |
|
COMBINED PROXY |
ZAFRILLA LOPEZ JUAN CARLOS |
08/05/2008 |
2 |
|
|
AZNAR ALTABA CELESTINO |
08/05/2008 |
3 |
|
JOINT ATTORNEY |
PINA NAVARRO ENRIQUE RAMON |
30/01/2017 |
2 |
|
|
SANCHEZ MIRA DANIEL |
30/01/2017 |
6 |
|
|
ESTEVE ROMAN JOSE LUIS |
18/11/2010 |
4 |
|
JOINT ATTORNEY/COMBINED PROXY |
ESTEVE ROMAN JESUS |
23/07/2010 |
5 |
|
PROXY |
RAMOS ROMERO SILVIA |
30/01/2017 |
3 |
|
REPRESENTATIVE |
BEAUS CLIMENT ENRIQUE |
14/11/2008 |
1 |
|
|
AZNAR ALTABA CELESTINO |
14/11/2008 |
3 |
|
ACCOUNTS' AUDITOR / HOLDER |
APLEM CONSULTING SLP |
02/02/2012 |
1 |
Historical
Social Bodies
|
|
|
|
|
|
Social Body's Name |
Post published |
End Date |
Other Positions in this Company |
|
AZNAR ALTABA CELESTINO |
MEMBER OF THE BOARD |
14/11/2008 |
3 |
|
BANCO DE VALENCIA SA |
MEMBER OF THE BOARD |
23/07/2010 |
1 |
|
BAÑULS PARREÑO DESAMPARADOS |
SECRETARY |
23/07/2010 |
1 |
|
ESTEVE ROMAN JESUS |
JOINT MANAGER |
12/02/2013 |
5 |
|
|
JOINT MANAGER |
29/07/2014 |
|
|
|
MEMBER OF THE BOARD |
02/02/2012 |
|
|
|
PRESIDENT |
02/02/2012 |
|
|
ESTEVE ROMAN JOSE LUIS |
JOINT MANAGER |
12/02/2013 |
4 |
|
|
JOINT MANAGER |
29/07/2014 |
|
|
|
MEMBER OF THE BOARD |
02/02/2012 |
|
|
HERNANDO SAEZ SILVIA |
SECRETARY |
02/02/2012 |
1 |
|
INVERSIONES VALENCIA CAPITAL RIESGO SCR SA |
MEMBER OF THE BOARD |
23/07/2010 |
3 |
|
|
MEMBER OF THE BOARD |
02/02/2012 |
|
|
|
VICE CHAIRMAN |
02/02/2012 |
|
|
PINA NAVARRO ENRIQUE RAMON |
JOINT ATTORNEY |
30/01/2017 |
2 |
|
RAMOS ROMERO SILVIA |
PROXY |
18/02/2016 |
3 |
|
|
PROXY |
30/01/2017 |
|
|
SANCHEZ MIRA DANIEL |
PROXY |
18/08/2015 |
6 |
|
|
PROXY |
18/02/2016 |
|
|
|
JOINT ATTORNEY |
01/03/2012 |
|
|
|
JOINT ATTORNEY |
18/02/2016 |
|
|
|
JOINT ATTORNEY |
30/01/2017 |
|
|
TOLEDANO GARCIA ROBERTO |
SINGLE ADMINISTRATOR |
27/03/2008 |
6 |
|
|
MEMBER OF THE BOARD |
02/02/2012 |
|
|
|
JOINT ATTORNEY |
03/02/2009 |
|
|
|
COMBINED PROXY |
03/02/2009 |
|
|
|
PRESIDENT |
23/07/2010 |
|
|
|
JOINT ATTORNEY/COMBINED PROXY |
23/07/2010 |
|
|
ZAFRILLA LOPEZ JUAN CARLOS |
MEMBER OF THE BOARD |
14/11/2008 |
2 |
Defaults,
Legal Claims and Insolvency Proceedings
|
|
|
|
|
Section enabling assessment of the degree
of compliance of the company queried with its payment obligations. It provides
information on the existence and nature of all stages of Insolvency and Legal
Proceedings published with reference to the Company in the country's various
Official Bulletins and national newspapers, as well Defaults Registered in the
main national credit bureaus (ASNEF Industrial and RAI ).
>
Summary
Chronological
summary
|
|
|
Number of Publications |
Amount (€) |
Start date |
End date |
|
Insolvency Proceedings, Bankruptcy and Suspension of
Payments |
|
Unpublished |
--- |
--- |
--- |
|
Request/Declaration |
|
0 |
--- |
date |
|
|
Proceedings |
|
--- |
--- |
|
--- |
|
Resolution |
|
--- |
--- |
|
--- |
|
Defaults on debt with Financial Institutions and Large
Companies |
Bank and Commercial Delinquency |
None |
0 |
|
|
|
Status: Friendly |
|
--- |
|
|
|
|
Status: Pre-Litigation |
|
--- |
|
|
|
|
Status: Litigation |
|
--- |
|
|
|
|
Status: Non-performing |
|
--- |
|
|
|
|
Status: insolvency proceedings, bankruptcy and
suspension of payments |
|
--- |
|
|
|
|
Other status |
|
--- |
|
|
|
|
Legal and Administrative Proceedings |
|
Unpublished |
--- |
|
|
|
Notices of defaults and enforcement |
|
--- |
--- |
|
--- |
|
Seizures |
|
--- |
--- |
|
--- |
|
Auctions |
|
--- |
--- |
|
--- |
|
Declarations of insolvency and bad debt |
|
--- |
--- |
|
--- |
|
Proceedings heard by the Civil Court |
|
Unpublished |
--- |
|
|
|
Proceedings heard by the Labour Court |
|
Unpublished |
--- |
|
|
>
Details
Probability of default
|
|
|
|
|
>
Estimated Probability of Default for the next 12 months: 0.155 %
|
Sector in which comparison is carried out: 233 Manufacture of clay building materials |
|
|
Relative Position:
|
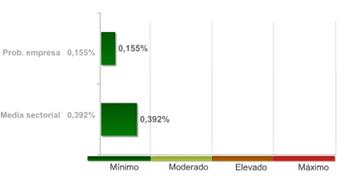
The
company's comparative analysis with the rest of the companies that comprise the
sector, shows the company holds a better position with regard to the
probability of non-compliance.
The
99.00% of the companies of the sector THESIZE SURFACES SOCIEDAD LIMITADA
belongs to show a higher probability of non-compliance.
The
probability of the company's non-compliance with its payment obligations within
deadlines estimated by our qualifications models is 0,155%.
In
the event they fail to comply with the payment, the seriousness of the loss
will depend on factors such as the promptness of the commencement of the charging
management, the existence of executive documents which match the credit or the
existence of guarantees and free debt assets under the name of the debtor.
Therefore, the probability of non-compliance should not be solely interpreted
as the total loss of the owed amount.
Result of query submitted to the R.A.I.
(Spanish Bad Debt Register) on
|
|
|
|
Summary of Judicial Claims |
|
|
|
|
|
|
|
|
||
|
|
|
Not published |
|
|
|
|
Not published |
|
|
|
|
||
|
|
|
Not published |
|
|
|
|
Not published |
|
|
|
|
Not published |
|
|
|
|
Not published |
|
|
|
|
||
|
|
|
Not published |
|
|
|
|
Not published |
|
|
|
|
||
|
|
|
Not published |
|
Guarantees
|
|
References |
|
|
|
|
Link
List
|
|
|
|
|
|
HAS IN ITS ADMINISTRATION BOARD TO: |
2 Entities |
|
IS RELATED WITH: |
2 Entities |
|
PARTICIPATES IN: |
7 Entities |
|
SHAREHOLDERS: |
1 Entities |
>
Shareholders
|
Relationship |
Entity |
Province |
Shareholding stake |
|
SHAREHOLDERS |
GLOBAL SURFACES SA |
MADRID |
99 |
|
|
NEOLITH EUROPA SARL (SUIZA) |
|
100 |
|
|
LA NOVA SUPERFICIE, SOCIEDAD LIMITADA, (ITALIA) |
|
50 |
|
|
STAMINA UNION, SOCIEDAD ANONIMA, (HONG KONG) |
|
100 |
|
|
STONE VOLUTION VERONA, SOCIEDAD LIMITADA, (ITALIA) |
|
50 |
|
PARTICIPATES IN |
T&T SUPERFICIES SOCIEDAD LIMITADA |
CASTELLON |
50 |
|
|
NATURAL AND SINTERED SURFACES, SOCIEDAD ANONIMA, (REINO
UNIDO) |
|
50.01 |
|
|
STONE EVOLUTION VERONA, SOCIEDAD LIMITADA, (ITALIA) |
|
50.1 |
>
Other relationships
|
Relationship |
Entity |
Province |
Shareholding stake |
|
IS RELATED WITH |
| | |
|
|
|
|
DOMUS MARMOLES SL |
MADRID |
|
|
|
DIMORPHANDRA SL |
MADRID |
|
|
HAS IN ITS ADMINISTRATION BOARD TO |
DIMORPHANDRA SL |
MADRID |
|
|
|
DOMUS MARMOLES SL |
MADRID |
|
Turnover
|
|
|
Total Sales 2016 |
82.306.017,12 |
The
sales data is from the latest available financial statements in. Failing that,
are estimates data calculated by statistical methods.
Estimated
Balance
|
|
Based on the last two financial statements filed at the
Trade Register by the subject, we cannot fully assess its accounting
development. |
Financial
Accounts and Balance Sheets
|
|
|
|
|
Financial
Years Presented
|
Ejercicio |
Tipo de Cuentas Anuales |
Fecha Presentacion |
|
2016 |
Normales |
September 2017 |
|
2015 |
Normales |
October 2016 |
|
2014 |
Normales |
September 2015 |
|
2013 |
Normales |
November 2014 |
|
2012 |
Normales |
September 2013 |
|
2011 |
Normales |
November 2012 |
|
2010 |
Normales |
September 2012 |
|
2009 |
Normales |
January 2011 |
|
2008 |
Normales |
October 2009 |
|
2007 |
Normales |
October 2008 |
The
data in the report regarding the last Company Accounts submitted by the company
is taken from the TRADE REGISTER serving the region in which the company's
address is located 31/12/2016
>
Normal format Balance in accordance with the New Accounting Plan 2007
Information corresponding to the
fiscal year 2016 2015 2014 2013 2012 is taken from
information submitted to the TRADE REGISTER. Data corresponding to fiscal years
before 2016 2015 2014 2013 2012 has been compiled
based on the equivalence criteria stipulated in Act JUS/206/2009. Where the
provisions of the Act did not establish relevant equivalence criteria, created
such criteria using its own methodology. To view details on the methodology.
|
|
ORIGINAL |
ORIGINAL |
ORIGINAL |
ORIGINAL |
ORIGINAL |
|
|
Assets |
2016 |
2015 |
2014 |
2013 |
2012 |
|
|
A) NON-CURRENT ASSETS: 11000 |
58.343.521,00 |
48.925.536,00 |
43.621.370,00 |
45.055.299,00 |
34.054.691,00 |
|
|
I. Intangible fixed assets :
11100 |
373.935,00 |
288.830,00 |
164.600,00 |
151.118,00 |
82.409,00 |
|
|
1. Development:
11110 |
0,00 |
0,00 |
0,00 |
0,00 |
0,00 |
|
|
2.
Concessions: 11120 |
0,00 |
0,00 |
0,00 |
0,00 |
0,00 |
|
|
3. Patents,
licencing, trade marks and similar: 11130 |
70.332,00 |
66.217,00 |
55.483,00 |
42.302,00 |
2.531,00 |
|
|
4. Goodwill:
11140 |
0,00 |
0,00 |
0,00 |
0,00 |
0,00 |
|
|
5. IT
applications: 11150 |
303.603,00 |
222.613,00 |
109.117,00 |
108.816,00 |
79.878,00 |
|
|
6. Investigation:
11160 |
0,00 |
0,00 |
0,00 |
0,00 |
0,00 |
|
|
7.
Intellectual property: 11180 |
0,00 |
0,00 |
0,00 |
0,00 |
0,00 |
|
|
8. Greenhouse
gas emission allowance: 11190 |
0,00 |
0,00 |
0,00 |
0,00 |
0,00 |
|
|
9. Other
intangible fixed assets. : 11170 |
0,00 |
0,00 |
0,00 |
0,00 |
0,00 |
|
|
II. Tangible fixed assets :
11200 |
57.215.945,00 |
47.901.654,00 |
42.666.552,00 |
44.064.227,00 |
32.533.886,00 |
|
|
1. Land and
buildings: 11210 |
23.910.707,00 |
20.428.366,00 |
20.687.256,00 |
19.354.346,00 |
15.005.003,00 |
|
|
2. Technical
installations and other tangible fixed assets: 11220 |
29.655.176,00 |
17.058.459,00 |
21.551.741,00 |
23.949.593,00 |
15.911.866,00 |
|
|
3. Tangible
asset in progress and advances: 11230 |
3.650.063,00 |
10.414.829,00 |
427.556,00 |
760.288,00 |
1.617.017,00 |
|
|
III. Real estate investment:
11300 |
0,00 |
0,00 |
0,00 |
0,00 |
0,00 |
|
|
1. Land:
11310 |
0,00 |
0,00 |
0,00 |
0,00 |
0,00 |
|
|
2. Buildings:
11320 |
0,00 |
0,00 |
0,00 |
0,00 |
0,00 |
|
|
IV. Long-term investments in Group
companies and associates : 11400 |
58.765,00 |
28.165,00 |
5.000,00 |
21.301,00 |
5.000,00 |
|
|
1. Equity
instruments: 11410 |
58.765,00 |
28.165,00 |
5.000,00 |
21.301,00 |
5.000,00 |
|
|
2. Credits to
businesses: 11420 |
0,00 |
0,00 |
0,00 |
0,00 |
0,00 |
|
|
3. Debt
securities: 11430 |
0,00 |
0,00 |
0,00 |
0,00 |
0,00 |
|
|
4.
Derivatives : 11440 |
0,00 |
0,00 |
0,00 |
0,00 |
0,00 |
|
|
5. Other
financial assets : 11450 |
0,00 |
0,00 |
0,00 |
0,00 |
0,00 |
|
|
6. Other
investments: 11460 |
0,00 |
0,00 |
0,00 |
0,00 |
0,00 |
|
|
V. Long-term financial
investments: 11500 |
92.837,00 |
29.577,00 |
28.296,00 |
6.380,00 |
124.322,00 |
|
|
1. Equity instruments:
11510 |
0,00 |
0,00 |
0,00 |
0,00 |
0,00 |
|
|
2. Credits to
third parties : 11520 |
0,00 |
0,00 |
0,00 |
0,00 |
0,00 |
|
|
3. Debt
securities: 11530 |
0,00 |
0,00 |
0,00 |
0,00 |
0,00 |
|
|
4.
Derivatives : 11540 |
0,00 |
0,00 |
0,00 |
0,00 |
0,00 |
|
|
5. Other
financial assets : 11550 |
92.837,00 |
29.577,00 |
28.296,00 |
6.380,00 |
124.322,00 |
|
|
6. Other
investments: 11560 |
0,00 |
0,00 |
0,00 |
0,00 |
0,00 |
|
|
VII. Non-current trade debts :
11700 |
0,00 |
0,00 |
0,00 |
0,00 |
0,00 |
|
|
VI. Assets for deferred tax :
11600 |
602.039,00 |
677.310,00 |
756.921,00 |
812.273,00 |
1.309.075,00 |
|
|
B) CURRENT ASSETS: 12000 |
59.410.464,00 |
40.004.463,00 |
28.644.112,00 |
21.028.086,00 |
11.626.490,00 |
|
|
I. Non-current assets held for
sale : 12100 |
0,00 |
0,00 |
0,00 |
0,00 |
0,00 |
|
|
II. Stocks: 12200 |
13.153.634,00 |
6.440.949,00 |
8.193.297,00 |
2.405.384,00 |
2.369.171,00 |
|
|
1.
Commercial: 12210 |
111.332,00 |
68.342,00 |
50.577,00 |
27.511,00 |
21.756,00 |
|
|
2. Primary
material and other supplies: 12220 |
4.424.422,00 |
2.139.031,00 |
2.518.041,00 |
556.010,00 |
554.661,00 |
|
|
a) Long-term primary material and other supplies: 12221 |
0,00 |
0,00 |
0,00 |
0,00 |
0,00 |
|
|
b) Short-term primary material and other supplies: 12222 |
4.424.422,00 |
0,00 |
0,00 |
0,00 |
0,00 |
|
|
3. Work in
progress: 12230 |
0,00 |
0,00 |
0,00 |
0,00 |
139.016,00 |
|
|
a) Of long-term production cycle : 12231 |
0,00 |
0,00 |
0,00 |
0,00 |
0,00 |
|
|
b) Of short-term production cycle : 12232 |
0,00 |
0,00 |
0,00 |
0,00 |
139.016,00 |
|
|
4. Finished
goods: 12240 |
8.604.673,00 |
4.233.575,00 |
5.622.243,00 |
1.757.527,00 |
1.651.807,00 |
|
|
a) Of long-term production cycle : 12241 |
0,00 |
0,00 |
0,00 |
0,00 |
0,00 |
|
|
b) Of short-term production cycle : 12242 |
8.604.673,00 |
4.233.575,00 |
5.622.243,00 |
1.757.527,00 |
1.651.807,00 |
|
|
5.
By-products, residues and recycled materials: 12250 |
0,00 |
0,00 |
0,00 |
0,00 |
0,00 |
|
|
6. Advances
to suppliers: 12260 |
13.207,00 |
0,00 |
2.436,00 |
64.335,00 |
1.931,00 |
|
|
III. Trade debtors and others
receivable accounts: 12300 |
26.053.720,00 |
14.244.104,00 |
8.689.202,00 |
7.124.060,00 |
3.338.305,00 |
|
|
1. Trade
debtors / accounts receivable: 12310 |
24.390.086,00 |
13.325.003,00 |
7.471.078,00 |
4.420.840,00 |
2.808.582,00 |
|
|
a) Long-term receivables from sales and services supplied :
12311 |
0,00 |
0,00 |
0,00 |
0,00 |
0,00 |
|
|
b) Customers for sales and provisions of services : 12312 |
24.390.086,00 |
13.325.003,00 |
7.471.078,00 |
4.420.840,00 |
2.808.582,00 |
|
|
2. Customers,
Group companies and associates : 12320 |
797.258,00 |
83.395,00 |
0,00 |
0,00 |
0,00 |
|
|
3. Other
accounts receivable: 12330 |
106.843,00 |
5.692,00 |
15.905,00 |
0,00 |
0,00 |
|
|
4. Personnel:
12340 |
450,00 |
0,00 |
0,00 |
500,00 |
6.000,00 |
|
|
5. Assets for
deferred tax: 12350 |
154.174,00 |
154.174,00 |
214.222,00 |
214.222,00 |
0,00 |
|
|
6. Other
debtors, including tax and social security: 12360 |
604.909,00 |
675.841,00 |
987.996,00 |
2.488.497,00 |
523.723,00 |
|
|
7. Called up
share capital: 12370 |
0,00 |
0,00 |
0,00 |
0,00 |
0,00 |
|
|
IV. Short-term investments in
Group companies and associates: 12400 |
0,00 |
0,00 |
0,00 |
0,00 |
0,00 |
|
|
1. Equity
instruments: 12410 |
0,00 |
0,00 |
0,00 |
0,00 |
0,00 |
|
|
2. Credits to
businesses: 12420 |
0,00 |
0,00 |
0,00 |
0,00 |
0,00 |
|
|
3. Debt
securities: 12430 |
0,00 |
0,00 |
0,00 |
0,00 |
0,00 |
|
|
4.
Derivatives : 12440 |
0,00 |
0,00 |
0,00 |
0,00 |
0,00 |
|
|
5. Other
financial assets : 12450 |
0,00 |
0,00 |
0,00 |
0,00 |
0,00 |
|
|
6. Other
investments: 12460 |
0,00 |
0,00 |
0,00 |
0,00 |
0,00 |
|
|
V. Short-term financial
investments : 12500 |
312.542,00 |
20.404,00 |
20.404,00 |
3.031.828,00 |
4.965.488,00 |
|
|
1. Equity
instruments: 12510 |
0,00 |
0,00 |
0,00 |
0,00 |
0,00 |
|
|
2. Credits to
businesses: 12520 |
312.157,00 |
0,00 |
0,00 |
0,00 |
0,00 |
|
|
3. Debt
securities: 12530 |
0,00 |
0,00 |
0,00 |
0,00 |
0,00 |
|
|
4.
Derivatives : 12540 |
0,00 |
0,00 |
0,00 |
0,00 |
0,00 |
|
|
5. Other
financial assets : 12550 |
385,00 |
20.404,00 |
20.404,00 |
3.031.828,00 |
4.965.488,00 |
|
|
6. Other
investments: 12560 |
0,00 |
0,00 |
0,00 |
0,00 |
0,00 |
|
|
VI. Short-term accruals:
12600 |
226.083,00 |
154.778,00 |
78.366,00 |
0,00 |
51.777,00 |
|
|
VII. Cash and other equivalent
liquid assets : 12700 |
19.664.486,00 |
19.144.229,00 |
11.662.843,00 |
8.466.814,00 |
901.750,00 |
|
|
1. Treasury:
12710 |
19.664.486,00 |
17.144.229,00 |
9.662.843,00 |
8.466.814,00 |
901.750,00 |
|
|
2. Other
equivalent liquid assets: 12720 |
0,00 |
2.000.000,00 |
2.000.000,00 |
0,00 |
0,00 |
|
|
TOTAL ASSETS (A + B) : 10000 |
117.753.985,00 |
88.929.999,00 |
72.265.482,00 |
66.083.385,00 |
45.681.182,00 |
|
|
|
ORIGINAL |
ORIGINAL |
ORIGINAL |
ORIGINAL |
ORIGINAL |
|
|
Liabilities and Net Worth |
2016 |
2015 |
2014 |
2013 |
2012 |
|
|
A) NET WORTH: 20000 |
86.738.996,00 |
63.273.892,00 |
52.721.606,00 |
44.133.528,00 |
41.332.347,00 |
|
|
A-1) Shareholders' equity:
21000 |
86.738.996,00 |
63.273.892,00 |
52.721.606,00 |
44.133.528,00 |
41.332.347,00 |
|
|
I. Capital: 21100 |
40.610.860,00 |
40.610.860,00 |
40.610.860,00 |
40.610.860,00 |
40.610.860,00 |
|
|
1. Registered
capital : 21110 |
40.610.860,00 |
40.610.860,00 |
40.610.860,00 |
40.610.860,00 |
40.610.860,00 |
|
|
2. (Uncalled
capital): 21120 |
0,00 |
0,00 |
0,00 |
0,00 |
0,00 |
|
|
II. Share premium: 21200 |
4.593.462,00 |
4.593.462,00 |
4.593.462,00 |
4.593.462,00 |
4.593.462,00 |
|
|
III. Reserves: 21300 |
18.069.570,00 |
10.944.915,00 |
2.757.707,00 |
-43.474,00 |
-43.474,00 |
|
|
1. Legal and statutory:
21310 |
2.321.989,00 |
1.266.760,00 |
4.941,00 |
4.941,00 |
4.941,00 |
|
|
2. Other
reserves: 21320 |
15.747.581,00 |
9.678.155,00 |
2.752.765,00 |
-48.415,00 |
-48.415,00 |
|
|
3. Revaluation
reserves: 21330 |
0,00 |
0,00 |
0,00 |
0,00 |
0,00 |
|
|
2.
Capitalisation Reserves: 21350 |
0,00 |
0,00 |
0,00 |
0,00 |
0,00 |
|
|
IV. (Common stock equity):
21400 |
0,00 |
0,00 |
0,00 |
0,00 |
0,00 |
|
|
V. Results from previous periods:
21500 |
0,00 |
-3.427.631,00 |
-3.828.501,00 |
-3.828.501,00 |
-5.057.427,00 |
|
|
1. Brought
forward: 21510 |
0,00 |
0,00 |
0,00 |
0,00 |
0,00 |
|
|
2. (Negative results
from previous periods): 21520 |
0,00 |
-3.427.631,00 |
-3.828.501,00 |
-3.828.501,00 |
-5.057.427,00 |
|
|
VI. Other shareholders'
contributions: 21600 |
0,00 |
0,00 |
0,00 |
0,00 |
0,00 |
|
|
VII. Result of the period: 21700 |
23.465.104,00 |
10.552.286,00 |
8.588.078,00 |
2.801.181,00 |
1.228.927,00 |
|
|
VIII. (Interim dividend):
21800 |
0,00 |
0,00 |
0,00 |
0,00 |
0,00 |
|
|
IX. Other net worth instruments:
21900 |
0,00 |
0,00 |
0,00 |
0,00 |
0,00 |
|
|
A-2) Adjustments due to changes in
value: 22000 |
0,00 |
0,00 |
0,00 |
0,00 |
0,00 |
|
|
I. Financial assets held for sale:
22100 |
0,00 |
0,00 |
0,00 |
0,00 |
0,00 |
|
|
II. Hedge operations: 22200 |
0,00 |
0,00 |
0,00 |
0,00 |
0,00 |
|
|
III. Linked non-current assets and
liabilities held for sale : 22300 |
0,00 |
0,00 |
0,00 |
0,00 |
0,00 |
|
|
IV. Exchange rate difference:
22400 |
0,00 |
0,00 |
0,00 |
0,00 |
0,00 |
|
|
V. Other: 22500 |
0,00 |
0,00 |
0,00 |
0,00 |
0,00 |
|
|
A-3) Received subsidies, donations
and legacies: 23000 |
0,00 |
0,00 |
0,00 |
0,00 |
0,00 |
|
|
B) NON-CURRENT LIABILITIES: 31000 |
4.757.241,00 |
7.666.600,00 |
4.747.125,00 |
4.605.641,00 |
743.750,00 |
|
|
I. Long-term provisions:
31100 |
0,00 |
0,00 |
0,00 |
0,00 |
0,00 |
|
|
1. Long-term
employee benefits liability: 31110 |
0,00 |
0,00 |
0,00 |
0,00 |
0,00 |
|
|
2.
Environmental actions: 31120 |
0,00 |
0,00 |
0,00 |
0,00 |
0,00 |
|
|
3.
Restructuring provisions: 31130 |
0,00 |
0,00 |
0,00 |
0,00 |
0,00 |
|
|
4. Other
provisions: 31140 |
0,00 |
0,00 |
0,00 |
0,00 |
0,00 |
|
|
II Long-term creditors:
31200 |
4.757.241,00 |
7.666.600,00 |
4.747.125,00 |
4.605.641,00 |
743.750,00 |
|
|
1.
Liabilities and other securities: 31210 |
0,00 |
0,00 |
0,00 |
0,00 |
0,00 |
|
|
2. Amounts owed
to credit institutions: 31220 |
4.757.241,00 |
7.666.600,00 |
4.747.125,00 |
4.605.641,00 |
300.000,00 |
|
|
3. Creditors
from financial leasing: 31230 |
0,00 |
0,00 |
0,00 |
0,00 |
0,00 |
|
|
4. Derivatives
: 31240 |
0,00 |
0,00 |
0,00 |
0,00 |
0,00 |
|
|
5. Other
financial liabilities : 31250 |
0,00 |
0,00 |
0,00 |
0,00 |
443.750,00 |
|
|
III. Long-term debts with Group
companies and associates: 31300 |
0,00 |
0,00 |
0,00 |
0,00 |
0,00 |
|
|
IV. Liabilities for deferred tax:
31400 |
0,00 |
0,00 |
0,00 |
0,00 |
0,00 |
|
|
V. Long-term accruals: 31500 |
0,00 |
0,00 |
0,00 |
0,00 |
0,00 |
|
|
VI. Non-current trade creditors : 31600 |
0,00 |
0,00 |
0,00 |
0,00 |
0,00 |
|
|
VII. Special long-term debts :
31700 |
0,00 |
0,00 |
0,00 |
0,00 |
0,00 |
|
|
C) CURRENT LIABILITIES : 32000 |
26.257.748,00 |
17.989.507,00 |
14.796.750,00 |
17.344.215,00 |
3.605.084,00 |
|
|
I. Liabilities linked to
non-current assets held for sale: 32100 |
0,00 |
0,00 |
0,00 |
0,00 |
0,00 |
|
|
II. Short-term provisions:
32200 |
0,00 |
0,00 |
0,00 |
0,00 |
0,00 |
|
|
1. Provisions
from greenhouse gas emission allowance: 32210 |
0,00 |
0,00 |
0,00 |
0,00 |
0,00 |
|
|
2. Other
provisions: 32220 |
0,00 |
0,00 |
0,00 |
0,00 |
0,00 |
|
|
III. Short-term creditors :
32300 |
4.844.418,00 |
6.009.086,00 |
4.201.469,00 |
11.298.142,00 |
689.271,00 |
|
|
1.
Liabilities and other securities: 32310 |
0,00 |
0,00 |
0,00 |
0,00 |
0,00 |
|
|
2. Amounts
owed to credit institutions: 32320 |
2.908.602,00 |
2.880.907,00 |
1.019.624,00 |
1.144.704,00 |
100.000,00 |
|
|
3. Creditors
from financial leasing: 32330 |
0,00 |
0,00 |
0,00 |
0,00 |
0,00 |
|
|
4.
Derivatives : 32340 |
0,00 |
0,00 |
0,00 |
0,00 |
0,00 |
|
|
5. Other
financial liabilities : 32350 |
1.935.816,00 |
3.128.178,00 |
3.181.845,00 |
10.153.438,00 |
589.271,00 |
|
|
IV. Short-term debts with Group
companies and associates: 32400 |
0,00 |
0,00 |
0,00 |
0,00 |
1,00 |
|
|
V. Trade creditors and other
accounts payable: 32500 |
21.413.330,00 |
11.980.421,00 |
10.595.281,00 |
6.046.073,00 |
2.915.812,00 |
|
|
1. Suppliers:
32510 |
13.228.242,00 |
7.311.077,00 |
5.946.428,00 |
4.317.118,00 |
1.679.023,00 |
|
|
a) Long-term debts : 32511 |
0,00 |
0,00 |
0,00 |
0,00 |
0,00 |
|
|
b) Short-term debts : 32512 |
13.228.242,00 |
7.311.077,00 |
5.946.428,00 |
4.317.118,00 |
1.679.023,00 |
|
|
2. Suppliers,
Group companies and associates: 32520 |
20.367,00 |
44.383,00 |
0,00 |
0,00 |
0,00 |
|
|
3. Other
creditors: 32530 |
3.041.231,00 |
3.384.346,00 |
1.781.181,00 |
1.305.877,00 |
832.395,00 |
|
|
4. Personnel
(remuneration due): 32540 |
817.527,00 |
372.916,00 |
423.305,00 |
218.040,00 |
120.137,00 |
|
|
5.
Liabilities for current tax: 32550 |
2.299.250,00 |
0,00 |
1.852.490,00 |
0,00 |
0,00 |
|
|
6. Other accounts
payable to Public Administrations.: 32560 |
1.609.735,00 |
259.135,00 |
238.053,00 |
156.831,00 |
158.635,00 |
|
|
7. Advances
from clients: 32570 |
396.978,00 |
608.563,00 |
353.824,00 |
48.207,00 |
125.623,00 |
|
|
VI. Short-term accruals:
32600 |
0,00 |
0,00 |
0,00 |
0,00 |
0,00 |
|
|
VII. Special short-term debts :
32700 |
0,00 |
0,00 |
0,00 |
0,00 |
0,00 |
|
|
TOTAL NET WORTH AND LIABILITIES (A + B + C) :
30000 |
117.753.985,00 |
88.929.999,00 |
72.265.482,00 |
66.083.385,00 |
45.681.182,00 |
|
|
|
ORIGINAL |
ORIGINAL |
ORIGINAL |
ORIGINAL |
ORIGINAL |
|
|
Profit and Loss |
2016 |
2015 |
2014 |
2013 |
2012 |
|
|
1. Net turnover: 40100 |
82.306.017,00 |
58.011.576,00 |
38.691.087,00 |
23.587.881,00 |
11.863.456,00 |
|
|
a) Sales: 40110 |
82.256.710,00 |
58.011.576,00 |
38.691.087,00 |
0,00 |
0,00 |
|
|
b) Rendering of services:
40120 |
49.307,00 |
0,00 |
0,00 |
0,00 |
0,00 |
|
|
c) Income of financial nature of
holding companies: 40130 |
0,00 |
0,00 |
0,00 |
0,00 |
0,00 |
|
|
2. Changes in stocks of finished goods and work in
progress: 40200 |
4.371.098,00 |
-1.388.668,00 |
3.864.716,00 |
-33.296,00 |
-12.711,00 |
|
|
3. Works carried out by the company for its assets:
40300 |
0,00 |
0,00 |
0,00 |
0,00 |
0,00 |
|
|
4. Supplies : 40400 |
-27.831.553,00 |
-20.600.971,00 |
-13.459.424,00 |
-7.966.095,00 |
-4.017.560,00 |
|
|
a) Stock consumption: 40410 |
-2.530.603,00 |
-1.081.529,00 |
-313.326,00 |
0,00 |
0,00 |
|
|
b) Consumption of raw materials
and miscellaneous consumable ones: 40420 |
-23.874.200,00 |
-17.223.434,00 |
-12.518.470,00 |
0,00 |
0,00 |
|
|
c) Works carried out by other
companies: 40430 |
-1.426.750,00 |
-2.296.008,00 |
-627.628,00 |
0,00 |
0,00 |
|
|
d) Impairment of stock, primary
material and other supplies: 40440 |
0,00 |
0,00 |
0,00 |
0,00 |
0,00 |
|
|
5. Other operating income: 40500 |
529.198,00 |
206.181,00 |
159.759,00 |
174.329,00 |
78.684,00 |
|
|
a) Auxiliary income and other from
current management: 40510 |
481.913,00 |
164.383,00 |
159.759,00 |
0,00 |
0,00 |
|
|
b) Operation subsidies included in
the Period's result: 40520 |
47.285,00 |
41.798,00 |
0,00 |
0,00 |
0,00 |
|
|
6. Personnel costs: 40600 |
-7.323.842,00 |
-5.282.335,00 |
-4.259.119,00 |
-2.839.467,00 |
-1.669.104,00 |
|
|
a) Wages, salaries et al.:
40610 |
-5.592.876,00 |
-4.123.969,00 |
-3.313.250,00 |
0,00 |
0,00 |
|
|
b) Social security costs:
40620 |
-1.730.966,00 |
-1.158.366,00 |
-945.868,00 |
0,00 |
0,00 |
|
|
c) Provisions : 40630 |
0,00 |
0,00 |
0,00 |
0,00 |
0,00 |
|
|
7. Other operating costs: 40700 |
-14.279.797,00 |
-10.220.110,00 |
-7.195.302,00 |
-5.114.817,00 |
-3.379.084,00 |
|
|
a) External services: 40710 |
-13.965.326,00 |
-10.043.446,00 |
-6.970.979,00 |
0,00 |
0,00 |
|
|
b) Taxes: 40720 |
-161.526,00 |
-164.252,00 |
-190.615,00 |
0,00 |
0,00 |
|
|
c) Losses, impairments and
variation in provisions from trade operations : 40730 |
-152.944,00 |
-12.412,00 |
-33.707,00 |
0,00 |
0,00 |
|
|
d) Other current management
expenditure : 40740 |
0,00 |
0,00 |
0,00 |
0,00 |
0,00 |
|
|
e) Expenses due to greenhouse gas
emissions: 40750 |
0,00 |
0,00 |
0,00 |
0,00 |
0,00 |
|
|
8. Amortisation of fixed assets: 40800 |
-6.972.785,00 |
-6.272.002,00 |
-5.982.037,00 |
-4.130.555,00 |
-1.118.461,00 |
|
|
9. Allocation of subsidies of non-financial fixed
assets and other: 40900 |
0,00 |
0,00 |
0,00 |
0,00 |
0,00 |
|
|
10. Excess provisions : 41000 |
0,00 |
0,00 |
0,00 |
0,00 |
0,00 |
|
|
11. Impairment and result of transfers of fixed assets:
41100 |
-5.306,00 |
-251.507,00 |
-5.440,00 |
-273.227,00 |
-47.667,00 |
|
|
a) Impairment and losses : 41110 |
0,00 |
0,00 |
0,00 |
0,00 |
0,00 |
|
|
b) Results for transfers and other
: 41120 |
-5.306,00 |
-251.507,00 |
-5.440,00 |
0,00 |
0,00 |
|
|
c) Impairment and profit due to
disposals of assets of holding companies: 41130 |
0,00 |
0,00 |
0,00 |
0,00 |
0,00 |
|
|
12. Negative difference in combined businesses:
41200 |
0,00 |
0,00 |
0,00 |
0,00 |
0,00 |
|
|
13. Other results : 41300 |
-108,00 |
7.483,00 |
9.377,00 |
54.641,00 |
8.048,00 |
|
|
A.1) OPERATING INCOME (1 + 2 + 3 + 4 + 5 + 6 + 7 + 8 +
9 + 10 + 11 + 12 + 13) : 49100 |
30.792.924,00 |
14.209.649,00 |
11.823.618,00 |
3.459.394,00 |
1.705.602,00 |
|
|
14. Financial income : 41400 |
66.905,00 |
34.440,00 |
22.463,00 |
46.551,00 |
37.983,00 |
|
|
a) Of shares in equity instruments
: 41410 |
0,00 |
0,00 |
0,00 |
0,00 |
0,00 |
|
|
a 1) In Group
companies and associates: 41411 |
0,00 |
0,00 |
0,00 |
0,00 |
0,00 |
|
|
a 2) In third
parties: 41412 |
0,00 |
0,00 |
0,00 |
0,00 |
0,00 |
|
|
b) From negotiable securities and
other financial instruments : 41420 |
66.905,00 |
34.440,00 |
22.463,00 |
0,00 |
0,00 |
|
|
b 1) From Group
companies and associates : 41421 |
28.110,00 |
0,00 |
0,00 |
0,00 |
0,00 |
|
|
b 2) From
third parties : 41422 |
38.796,00 |
34.440,00 |
22.463,00 |
0,00 |
0,00 |
|
|
c) Allocation of financial subsidies,
donations and legacies : 41430 |
0,00 |
0,00 |
0,00 |
0,00 |
0,00 |
|
|
15. Financial expenditure: 41500 |
-124.231,00 |
-150.446,00 |
-263.371,00 |
-166.771,00 |
-62.685,00 |
|
|
a) Amounts owed to Group companies
and associates : 41510 |
-32.227,00 |
0,00 |
0,00 |
0,00 |
0,00 |
|
|
b) For debts with third parties :
41520 |
-92.004,00 |
-150.446,00 |
-263.371,00 |
0,00 |
0,00 |
|
|
c) Stock renewal : 41530 |
0,00 |
0,00 |
0,00 |
0,00 |
0,00 |
|
|
16. Changes in fair value of financial instruments :
41600 |
0,00 |
0,00 |
0,00 |
0,00 |
-19.825,00 |
|
|
a) Trading book and other :
41610 |
0,00 |
0,00 |
0,00 |
0,00 |
0,00 |
|
|
b) Allocation of financial assets
held for sale to the result for the period: 41620 |
0,00 |
0,00 |
0,00 |
0,00 |
0,00 |
|
|
17. Exchange rate differences : 41700 |
385.570,00 |
326.300,00 |
277.005,00 |
-41.191,00 |
-22.413,00 |
|
|
18. Impairment and result for transfers of financial
instruments: 41800 |
-188.499,00 |
16.301,00 |
-16.301,00 |
0,00 |
0,00 |
|
|
a) Impairment and losses :
41810 |
-188.499,00 |
16.301,00 |
-16.301,00 |
0,00 |
0,00 |
|
|
b) Results for transfers and other
: 41820 |
0,00 |
0,00 |
0,00 |
0,00 |
0,00 |
|
|
19. Other financial income and expenditure: 42100 |
0,00 |
0,00 |
0,00 |
0,00 |
0,00 |
|
|
a) Incorporation of financial
expenditure to assets: 42110 |
0,00 |
0,00 |
0,00 |
0,00 |
0,00 |
|
|
b) Financial income from
arrangement with creditors: 42120 |
0,00 |
0,00 |
0,00 |
0,00 |
0,00 |
|
|
c) Other income and expenditure:
42130 |
0,00 |
0,00 |
0,00 |
0,00 |
0,00 |
|
|
A.2) FINANCIAL REVENUE (14+15+16+17+18+19) :
49200 |
139.745,00 |
226.596,00 |
19.795,00 |
-161.411,00 |
-66.940,00 |
|
|
A.3) NET RESULT BEFORE TAXES (A.1+A.2) : 49300 |
30.932.669,00 |
14.436.245,00 |
11.843.414,00 |
3.297.983,00 |
1.638.662,00 |
|
|
20. Income taxes: 41900 |
-7.467.565,00 |
-3.883.959,00 |
-3.255.336,00 |
-496.802,00 |
-409.735,00 |
|
|
A.4) PROFIT AFTER TAXES (A.3+20) : 49400 |
23.465.104,00 |
10.552.286,00 |
8.588.078,00 |
0,00 |
0,00 |
|
|
21. Result of the year coming from interrupted
operations : 42000 |
0,00 |
0,00 |
0,00 |
0,00 |
0,00 |
|
|
A.5) RESULT OF THE PERIOD (A.4+21) : 49500 |
23.465.104,00 |
10.552.286,00 |
8.588.078,00 |
2.801.181,00 |
1.228.927,00 |
|
>
Normal Balance Sheet under the rules of the 1990 General Accounting Plan
(repealed since 1st January of 2008)
Information
corresponding to the fiscal year
2016 2015 2014 2013 2012 has been compiled based on
the equivalence criteria stipulated in Act JUS/206/2009. Where the provisions
of the Act did not establish relevant equivalence criteria. To view details on
the methodology 2016 2015 2014 2013 2012 is taken
from information submitted to the TRADE REGISTER.
|
|
EQUIVALENCIA |
EQUIVALENCIA |
EQUIVALENCIA |
EQUIVALENCIA |
EQUIVALENCIA |
|
|
ASSETS |
2016 |
2015 |
2014 |
2013 |
2012 |
|
|
A) SHAREHOLDERS (PARTNERS) BY UNCALLED SUSCRIBED
CAPITAL: |
0,00 |
0,00 |
0,00 |
0,00 |
0,00 |
|
|
B) FIXED ASSETS: |
57.741.482,00 |
48.248.226,00 |
42.864.448,00 |
44.243.027,00 |
32.745.617,00 |
|
|
I. Formation expenses: |
0,00 |
0,00 |
0,00 |
0,00 |
0,00 |
|
|
II. Intangible fixed assets:
|
373.935,00 |
288.830,00 |
164.600,00 |
151.118,00 |
82.409,00 |
|
|
III. Tangible fixed assets: |
57.215.945,00 |
47.901.654,00 |
42.666.552,00 |
44.064.227,00 |
32.533.886,00 |
|
|
IV. Financial investments: |
151.602,00 |
57.742,00 |
33.296,00 |
27.682,00 |
129.322,00 |
|
|
V. Own shares: |
0,00 |
0,00 |
0,00 |
0,00 |
0,00 |
|
|
VI. Long-term trade receivables:
|
0,00 |
0,00 |
0,00 |
0,00 |
0,00 |
|
|
C) Deferred expenses: |
0,00 |
0,00 |
0,00 |
0,00 |
0,00 |
|
|
D) CURRENT ASSETS: |
60.012.503,00 |
40.681.773,00 |
29.401.033,00 |
21.840.358,00 |
12.935.565,00 |
|
|
I. Called-up share capital (not
paid): |
0,00 |
0,00 |
0,00 |
0,00 |
0,00 |
|
|
II. Stocks: |
13.153.634,00 |
6.440.949,00 |
8.193.297,00 |
2.405.384,00 |
2.369.171,00 |
|
|
III. Debtors: |
26.655.759,00 |
14.921.414,00 |
9.446.124,00 |
7.936.333,00 |
4.647.380,00 |
|
|
IV. Short-term investments: |
312.542,00 |
20.404,00 |
20.404,00 |
3.031.828,00 |
4.965.488,00 |
|
|
V. Short-term treasury shares:
|
0,00 |
0,00 |
0,00 |
0,00 |
0,00 |
|
|
VI. Cash at bank and in hand:
|
19.664.486,00 |
19.144.229,00 |
11.662.843,00 |
8.466.814,00 |
901.750,00 |
|
|
VII. Prepayments and accrued
income: |
226.083,00 |
154.778,00 |
78.366,00 |
0,00 |
51.777,00 |
|
|
GENERAL TOTAL (A + B + C + D): |
117.753.985,00 |
88.929.999,00 |
72.265.482,00 |
66.083.385,00 |
45.681.182,00 |
|
MERCANTILE
REGISTRY.
|
|
EQUIVALENCIA |
EQUIVALENCIA |
EQUIVALENCIA |
EQUIVALENCIA |
EQUIVALENCIA |
|
|
LIABILITIES |
2016 |
2015 |
2014 |
2013 |
2012 |
|
|
A) EQUITY: |
86.738.996,00 |
63.273.892,00 |
52.721.606,00 |
44.133.528,00 |
41.332.347,00 |
|
|
I. Subscribed capital: |
40.610.860,00 |
40.610.860,00 |
40.610.860,00 |
40.610.860,00 |
40.610.860,00 |
|
|
II. Share premium: |
4.593.462,00 |
4.593.462,00 |
4.593.462,00 |
4.593.462,00 |
4.593.462,00 |
|
|
III. Revaluation reserves: |
0,00 |
0,00 |
0,00 |
0,00 |
0,00 |
|
|
IV. Reserves: |
18.069.570,00 |
10.944.915,00 |
2.757.707,00 |
-43.474,00 |
-43.474,00 |
|
|
a)
Differences for capital adjustment to euros: |
0,00 |
0,00 |
0,00 |
0,00 |
0,00 |
|
|
b) Remaining
Reserves: |
18.069.570,00 |
10.944.915,00 |
2.757.707,00 |
-43.474,00 |
-43.474,00 |
|
|
V. Profit or loss brought forward:
|
0,00 |
-3.427.631,00 |
-3.828.501,00 |
-3.828.501,00 |
-5.057.427,00 |
|
|
VI. Profit or loss for the
financial year: |
23.465.104,00 |
10.552.286,00 |
8.588.078,00 |
2.801.181,00 |
1.228.927,00 |
|
|
VII. Interim dividend paid: |
0,00 |
0,00 |
0,00 |
0,00 |
0,00 |
|
|
VIII. Own shares for capital reduction:
|
0,00 |
0,00 |
0,00 |
0,00 |
0,00 |
|
|
B) Deferred income: |
0,00 |
0,00 |
0,00 |
0,00 |
0,00 |
|
|
C) PROVISIONS FOR LIABILITIES AND CHARGES: |
0,00 |
0,00 |
0,00 |
0,00 |
0,00 |
|
|
D) LONG TERM LIABILITIES: |
4.757.241,00 |
7.666.600,00 |
4.747.125,00 |
4.605.641,00 |
743.750,00 |
|
|
E) SHORT TERM CREDITORS: |
26.257.748,00 |
17.989.507,00 |
14.796.750,00 |
17.344.215,00 |
3.605.084,00 |
|
|
F) SHORT-TERM PROVISIONS FOR LIABILITIES AND CHARGES:
|
0,00 |
0,00 |
0,00 |
0,00 |
0,00 |
|
|
GENERAL TOTAL (A + B + C + D + E + F): |
117.753.985,00 |
88.929.999,00 |
72.265.482,00 |
66.083.385,00 |
45.681.182,00 |
|
MERCANTILE
REGISTRY.
|
|
EQUIVALENCIA |
EQUIVALENCIA |
EQUIVALENCIA |
EQUIVALENCIA |
EQUIVALENCIA |
|
|
DEBIT |
2016 |
2015 |
2014 |
2013 |
2012 |
|
|
A) CHARGES (A.1 to A.15): |
59.822.586,00 |
48.049.996,00 |
30.571.612,00 |
21.062.221,00 |
10.759.244,00 |
|
|
A.1.
Operating consumption: |
23.460.455,00 |
21.989.639,00 |
9.594.707,00 |
7.999.391,00 |
4.030.270,00 |
|
|
A.2. Staff
Costs: |
7.323.842,00 |
5.282.335,00 |
4.259.119,00 |
2.839.467,00 |
1.669.104,00 |
|
|
a) Wages, salaries et al.: |
5.592.876,00 |
4.123.969,00 |
3.313.250,00 |
0,00 |
0,00 |
|
|
b) Social security costs: |
1.730.966,00 |
1.158.366,00 |
945.868,00 |
2.839.467,00 |
1.669.104,00 |
|
|
A.3.
Depreciation expense: |
6.972.785,00 |
6.272.002,00 |
5.982.037,00 |
4.130.555,00 |
1.118.461,00 |
|
|
A.4.
Variation of trade provisions and losses of unrecovered receivables: |
0,00 |
0,00 |
0,00 |
0,00 |
0,00 |
|
|
A.5. Other operating
charges: |
14.279.797,00 |
10.220.110,00 |
7.195.302,00 |
5.114.817,00 |
3.379.084,00 |
|
|
A.I. OPERATING BENEFITS
(B.1-A.1-A.2-A.3-A.4-A.5): |
30.798.337,00 |
14.453.672,00 |
11.819.681,00 |
3.677.979,00 |
1.745.221,00 |
|
|
A.6.
Financial and similar charges: |
312.730,00 |
150.446,00 |
279.672,00 |
166.771,00 |
62.685,00 |
|
|
a) Due to liabilities with companies of the group: |
32.227,00 |
0,00 |
0,00 |
0,00 |
0,00 |
|
|
b) Due to liabilities with associated companies: |
0,00 |
0,00 |
0,00 |
0,00 |
0,00 |
|
|
c) Due to other debts: |
92.004,00 |
150.446,00 |
263.371,00 |
166.771,00 |
62.685,00 |
|
|
d) Losses from financial investments: |
188.499,00 |
0,00 |
16.301,00 |
0,00 |
0,00 |
|
|
A.7.
Financial investment provision change: |
0,00 |
0,00 |
0,00 |
0,00 |
19.825,00 |
|
|
A.8. Exchange
losses: |
0,00 |
0,00 |
0,00 |
41.191,00 |
22.413,00 |
|
|
A.II. POSITIVE FINANCIAL RESULTS
(B.2+B.3-A.6-A.7-A.8): |
139.745,00 |
210.294,00 |
19.795,00 |
0,00 |
0,00 |
|
|
A.III. PROFIT FROM ORDINARY
ACTIVITIES (A.I+A.II-B.I-B.II): |
30.938.082,00 |
14.663.967,00 |
11.839.477,00 |
3.516.568,00 |
1.678.281,00 |
|
|
A.9. Changes
in provisions for intangible, tangible and securities portfolio: |
0,00 |
0,00 |
0,00 |
0,00 |
0,00 |
|
|
A.10. Losses from
tangible and intangible fixed assets and portfolio: |
5.306,00 |
251.507,00 |
5.440,00 |
273.227,00 |
47.667,00 |
|
|
A.11. Losses
from transactions with own shares and debentures: |
0,00 |
0,00 |
0,00 |
0,00 |
0,00 |
|
|
A.12.
Extraordinary expenses: |
108,00 |
0,00 |
0,00 |
0,00 |
0,00 |
|
|
A.13. Prior
year expenses and losses: |
0,00 |
0,00 |
0,00 |
0,00 |
0,00 |
|
|
A.IV. EXTRAORDINARY PROFIT (B.4+B.5+B.6+B.7+B.8-A.9-A.10-A.11-A.12-A.13):
|
0,00 |
0,00 |
3.937,00 |
0,00 |
0,00 |
|
|
A.V. PROFIT BEFORE TAXES
(A.III+A.IV-B.III-B.IV): |
30.932.669,00 |
14.419.943,00 |
11.843.414,00 |
3.297.983,00 |
1.638.662,00 |
|
|
A.14.
Corporation Tax: |
7.467.565,00 |
3.883.959,00 |
3.255.336,00 |
496.802,00 |
409.735,00 |
|
|
A.15.
Miscellaneous taxes: |
0,00 |
0,00 |
0,00 |
0,00 |
0,00 |
|
|
A.VI. FINANCIAL YEAR RESULT (PROFIT)
(A.V-A.14-A.15): |
23.465.104,00 |
10.535.985,00 |
8.588.078,00 |
2.801.181,00 |
1.228.927,00 |
|
MERCANTILE
REGISTRY.
|
|
EQUIVALENCIA |
EQUIVALENCIA |
EQUIVALENCIA |
EQUIVALENCIA |
EQUIVALENCIA |
|
|
CREDIT |
2016 |
2015 |
2014 |
2013 |
2012 |
|
|
B) INCOME ( B.1 to B.8): |
83.287.690,00 |
58.585.981,00 |
39.159.690,00 |
23.863.402,00 |
11.988.171,00 |
|
|
B.1.
Operating income: |
82.835.215,00 |
58.217.757,00 |
38.850.846,00 |
23.762.210,00 |
11.942.140,00 |
|
|
a) Net total sales: |
82.306.017,00 |
58.011.576,00 |
38.691.087,00 |
23.587.881,00 |
11.863.456,00 |
|
|
b) Miscellaneous operating income: |
529.198,00 |
206.181,00 |
159.759,00 |
174.329,00 |
78.684,00 |
|
|
B.I. PÉRDIDAS DE EXPLOTACIÓN
(A.1+A.2+A.3+A.4+A.5-B.1 ): |
0,00 |
0,00 |
0,00 |
0,00 |
0,00 |
|
|
B.2.
Financial income: |
66.905,00 |
34.440,00 |
22.463,00 |
46.551,00 |
37.983,00 |
|
|
a) Companies of the group: |
28.110,00 |
0,00 |
0,00 |
0,00 |
0,00 |
|
|
b) In associated companies: |
0,00 |
0,00 |
0,00 |
0,00 |
0,00 |
|
|
c) Miscellaneous: |
38.796,00 |
34.440,00 |
22.463,00 |
46.551,00 |
37.983,00 |
|
|
d) Profit on financial investment: |
0,00 |
0,00 |
0,00 |
0,00 |
0,00 |
|
|
B.3. Exchange
gains: |
385.570,00 |
326.300,00 |
277.005,00 |
0,00 |
0,00 |
|
|
B.II. NEGATIVE FINANCIAL RESULTS
(A.6+A.7+A.8-B.2-B.3): |
0,00 |
0,00 |
0,00 |
161.411,00 |
66.940,00 |
|
|
B.III. LOSSES ON ORDINARY
ACTIVITIES ( B.I + B.II - A.I - A.II ): |
0,00 |
0,00 |
0,00 |
0,00 |
0,00 |
|
|
B.4. Profit
on disposal of both tangible and intangible fixed assets and securities
portfolio: |
0,00 |
0,00 |
0,00 |
0,00 |
0,00 |
|
|
B.5. Profit
on transactions with own shares and debentures: |
0,00 |
0,00 |
0,00 |
0,00 |
0,00 |
|
|
B.6. Capital
grants transferred to profit and loss: |
0,00 |
0,00 |
0,00 |
0,00 |
0,00 |
|
|
B.7.
Extraordinary income: |
0,00 |
7.483,00 |
9.377,00 |
54.641,00 |
8.048,00 |
|
|
B.8. Income and
profit of former financial years: |
0,00 |
0,00 |
0,00 |
0,00 |
0,00 |
|
|
B.IV. NEGATIVE EXTRAORDINARY
RESULTS (A.9+A.10+A.11+A.12+A.13-B.4-B.5-B.6-B.7-B.8): |
5.413,00 |
244.023,00 |
0,00 |
218.586,00 |
39.619,00 |
|
|
B.V. LOSSES BEFORE TAXES
(B.III+B.IV-A.III-A.IV): |
0,00 |
0,00 |
0,00 |
0,00 |
0,00 |
|
|
B.VI. FINANCIAL YEAR RESULTS
(LOSSES) (B.V+A.14+A.15): |
0,00 |
0,00 |
0,00 |
0,00 |
0,00 |
|
MERCANTILE
REGISTRY.
CASHFLOW
STATEMENT
|
|
|
|
|
Model:
Normal
>
Source of information: Data contained in this section is taken from the
information declared in the Annual Accounts submitted to the Trade Register.
|
Net Rights Granted |
2016 |
2015 |
2014 |
2013 |
2012 |
|
|
1. Fiscal year result before taxes.: 61100 |
30.932.669,00 |
14.436.245,00 |
11.843.414,00 |
3.297.983,00 |
1.638.662,00 |
|
|
2. Results adjustments.: 61200 |
6.944.112,00 |
6.260.043,00 |
5.992.012,00 |
4.558.446,00 |
1.400.874,00 |
|
|
a) Fixed Assets Amortization (+).:
61201 |
6.972.785,00 |
6.272.002,00 |
5.982.037,00 |
4.130.555,00 |
1.118.461,00 |
|
|
b) Obsolescence Allowances (+/-).
: 61202 |
188.499,00 |
-16.301,00 |
16.301,00 |
0,00 |
0,00 |
|
|
c) Variation in Provision (+/-). :
61203 |
152.944,00 |
12.412,00 |
33.707,00 |
47.894,00 |
175.854,00 |
|
|
d) Allocation of grants (-).:
61204 |
-47.285,00 |
-41.798,00 |
0,00 |
0,00 |
0,00 |
|
|
e) Results on disposal of fixed assets
(+/-). : 61205 |
5.306,00 |
251.507,00 |
5.440,00 |
273.227,00 |
47.667,00 |
|
|
g) Financial income (-).:
61207 |
-66.905,00 |
-34.440,00 |
-22.463,00 |
-46.551,00 |
-37.983,00 |
|
|
h) Financial Expenses (+). :
61208 |
124.231,00 |
150.446,00 |
263.371,00 |
166.771,00 |
62.685,00 |
|
|
i) Exchange differences (+/-). :
61209 |
-385.570,00 |
-326.300,00 |
-277.005,00 |
41.191,00 |
22.413,00 |
|
|
j) Reasonable Value Variation in Financial
Instruments (+/-).: 61210 |
0,00 |
0,00 |
0,00 |
0,00 |
19.825,00 |
|
|
k) Other income and expense (-/+).
: 61211 |
108,00 |
-7.483,00 |
-9.377,00 |
-54.641,00 |
-8.048,00 |
|
|
3. Changes in current capital equity.: 61300 |
-11.306.392,00 |
-637.061,00 |
-4.530.101,00 |
-628.178,00 |
575.990,00 |
|
|
a) Stock (+/-).: 61301 |
-6.712.685,00 |
1.752.348,00 |
-5.787.913,00 |
-36.213,00 |
58.012,00 |
|
|
d) Debtors and other accounts receivable
(+/-). : 61302 |
-11.830.631,00 |
-5.550.628,00 |
-1.545.610,00 |
-3.524.754,00 |
-318.518,00 |
|
|
c) Other current assets (+/-). :
61303 |
-71.305,00 |
-76.412,00 |
0,00 |
51.777,00 |
-11.648,00 |
|
|
d) Creditors and other accounts
payable (+/-). : 61304 |
7.308.229,00 |
3.237.631,00 |
2.803.422,00 |
2.881.012,00 |
848.144,00 |
|
|
4. Cash Flows from Other Operating Activities:
61400 |
-5.131.214,00 |
-5.708.441,00 |
-1.462.275,00 |
-184.079,00 |
21.013,00 |
|
|
a) Interest payments (-). :
61401 |
-124.231,00 |
-150.446,00 |
-263.371,00 |
-166.771,00 |
-46.824,00 |
|
|
c) Interest collection (+). :
61403 |
44.136,00 |
34.440,00 |
22.463,00 |
73.340,00 |
37.213,00 |
|
|
d) Income tax payment collection
(payments) (+/-).: 61404 |
-5.078.078,00 |
-5.591.267,00 |
-1.340.588,00 |
0,00 |
0,00 |
|
|
e) Other payments (payment
collection) (-/+) : 61405 |
26.959,00 |
-1.169,00 |
119.221,00 |
-90.648,00 |
30.624,00 |
|
|
5. Cash Flows from Operating Activities (1 + 2 + 3 + 4)
: 61500 |
21.439.175,00 |
14.350.785,00 |
11.843.049,00 |
7.044.173,00 |
3.636.539,00 |
|
|
6. Payments for investment (-).: 62100 |
-20.950.842,00 |
-11.907.499,00 |
-4.709.852,00 |
-22.717.955,00 |
-7.042.039,00 |
|
|
a) Companies of the group and
affiliates. : 62101 |
-219.099,00 |
-6.864,00 |
0,00 |
-16.576,00 |
0,00 |
|
|
b) Intangible fixed assets. :
62102 |
-144.570,00 |
-162.466,00 |
-40.627,00 |
-43.694,00 |
-21.465,00 |
|
|
c) Fixed assets. : 62103 |
-16.232.916,00 |
-11.735.090,00 |
-4.641.080,00 |
-16.655.461,00 |
-2.083.362,00 |
|
|
e) Other financial assets. :
62105 |
-4.354.257,00 |
-3.079,00 |
-28.145,00 |
-6.002.224,00 |
-4.937.213,00 |
|
|
7. Divestment payment collection (+). : 62200 |
4.021.628,00 |
1.798,00 |
3.022.653,00 |
8.029.215,00 |
0,00 |
|
|
c) Fixed assets. : 62203 |
0,00 |
0,00 |
6.000,00 |
2.178,00 |
0,00 |
|
|
e) Other financial assets. :
62205 |
4.021.628,00 |
1.798,00 |
3.016.653,00 |
8.027.037,00 |
0,00 |
|
|
8. Cash Flow from Investing Activities (6+7) less
Amortization: 62300 |
-16.929.214,00 |
-11.905.701,00 |
-1.687.199,00 |
-18.819.295,00 |
-8.160.500,00 |
|
|
9. Payment collection and payments for equity
instruments. : 63100 |
0,00 |
0,00 |
0,00 |
0,00 |
4.899.999,00 |
|
|
a) Issuance of equity instruments
(+). : 63101 |
0,00 |
0,00 |
0,00 |
0,00 |
4.899.999,00 |
|
|
10. Payment collection and payments for financial
liabilities instruments.: 63200 |
-4.073.269,00 |
5.036.301,00 |
-6.959.821,00 |
15.209.632,00 |
-1.011.531,00 |
|
|
a) Issuance : 63201 |
1.935.816,00 |
10.628.178,00 |
7.182.455,00 |
16.299.087,00 |
989.271,00 |
|
|
2. Debts incurred with credit
institutions (+). : 63203 |
0,00 |
7.500.000,00 |
4.000.000,00 |
5.850.530,00 |
400.000,00 |
|
|
5. Other debts (+). : 63206 |
1.935.816,00 |
3.128.178,00 |
3.182.455,00 |
10.448.557,00 |
589.271,00 |
|
|
b) Repayment and amortization of :
63207 |
-6.009.086,00 |
-5.591.877,00 |
-14.142.276,00 |
-1.089.455,00 |
-2.000.802,00 |
|
|
2. Debts incurred with credit institutions
(-).: 63209 |
-2.880.907,00 |
-2.410.032,00 |
-3.987.470,00 |
-500.185,00 |
-1.013.034,00 |
|
|
5. Other debts (-). : 63212 |
-3.128.178,00 |
-3.181.845,00 |
-10.154.807,00 |
-589.271,00 |
-987.768,00 |
|
|
11. Payments from dividends and remunerations from
other assets instruments. : 63300 |
0,00 |
0,00 |
0,00 |
0,00 |
0,00 |
|
|
12. Cash Flows from Financing Activities (9+10+11):
63400 |
-4.073.269,00 |
5.036.301,00 |
-6.959.821,00 |
15.209.632,00 |
3.888.468,00 |
|
|
D) EFFECT OF EXCHANGE RATE CHANGES: 64000 |
83.565,00 |
0,00 |
0,00 |
0,00 |
0,00 |
|
|
E) NET INCREASE/DECREASE OF CASH OR EQUIVALENT ASSETS
(+/-5+/-8+/12+/-D) : 65000 |
520.257,00 |
7.481.385,00 |
3.196.029,00 |
7.565.065,00 |
482.968,00 |
|
|
Cash or equivalent assets as of
beginning of the fiscal year.: 65100 |
19.144.229,00 |
11.662.843,00 |
8.466.814,00 |
901.750,00 |
418.782,00 |
|
|
Cash or equivalent assets as of end
of the fiscal year.: 65200 |
19.664.486,00 |
19.144.229,00 |
11.662.843,00 |
8.466.814,00 |
901.750,00 |
|
FINANCIAL
DIAGNOSIS
|
>
Economic-Financial Comparative Analysis
Data
used in the following ratios and indicators is taken from the Annual Accounts
submitted by the company to the TRADE REGISTER.
>
Comparison within the Sector
|
Cash Flow |
2016 |
2015 |
Variación 2016 - 2015 |
|
|||
|
|
Empresa |
Sector |
Empresa |
Sector |
Empresa |
Sector |
|
|
Cash Flow over Sales: |
0,01 % |
0,01 % |
0,13 % |
0,06 % |
-95,10 % |
-82,31 % |
|
|
Net Financial Debt: |
-0,27 |
2,32 |
-0,26 |
2,88 |
-3,72 |
-19,55 |
|
|
Cash Flow Yield: |
0,00 % |
0,01 % |
0,08 % |
0,03 % |
-94,75 % |
-82,08 % |
|
|
EBITDA over Sales: |
45,89 % |
11,97 % |
35,73 % |
10,43 % |
28,45 % |
14,76 % |
|
|
Profitability |
2016 |
2015 |
Variación 2016 - 2015 |
|
|||
|
|
Empresa |
Sector |
Empresa |
Sector |
Empresa |
Sector |
|
|
Operating economic profitability: |
26,25 % |
8,83 % |
15,98 % |
6,97 % |
64,25 % |
26,69 % |
|
|
Total economic profitability: |
26,37 % |
4,89 % |
16,40 % |
3,20 % |
60,80 % |
53,09 % |
|
|
Financial profitability: |
27,05 % |
7,26 % |
16,68 % |
4,15 % |
62,21 % |
75,09 % |
|
|
Margin: |
37,17 % |
7,82 % |
24,39 % |
6,34 % |
52,38 % |
23,27 % |
|
|
Mark-up: |
37,34 % |
7,03 % |
24,78 % |
3,78 % |
50,67 % |
86,06 % |
|
|
Solvency |
2016 |
2015 |
Variación 2016 - 2015 |
|
|||
|
|
Empresa |
Sector |
Empresa |
Sector |
Empresa |
Sector |
|
|
Liquidity: |
0,75 |
0,16 |
1,06 |
0,14 |
-29,63 |
16,50 |
|
|
Acid Test: |
1,75 |
0,90 |
1,86 |
0,86 |
-5,60 |
4,23 |
|
|
Working Capital / Investment: |
0,28 |
0,03 |
0,25 |
0,03 |
13,73 |
10,50 |
|
|
Solvency: |
2,29 |
1,21 |
2,26 |
1,18 |
1,07 |
2,25 |
|
|
Indebtedness |
2016 |
2015 |
Variación 2016 - 2015 |
|
|||
|
|
Empresa |
Sector |
Empresa |
Sector |
Empresa |
Sector |
|
|
Indebtedness level: |
0,36 |
1,24 |
0,41 |
1,32 |
-11,82 |
-5,86 |
|
|
Borrowing Composition: |
0,18 |
1,05 |
0,43 |
1,03 |
-57,49 |
1,78 |
|
|
Repayment Ability: |
0,82 |
9,28 |
1,24 |
11,09 |
-33,67 |
-16,30 |
|
|
Warranty: |
3,80 |
1,82 |
3,47 |
1,77 |
9,53 |
2,74 |
|
|
Generated resources / Total creditors: |
0,99 |
0,09 |
0,66 |
0,08 |
50,73 |
19,81 |
|
|
Efficiency |
2016 |
2015 |
Variación 2016 - 2015 |
|
|||
|
|
Empresa |
Sector |
Empresa |
Sector |
Empresa |
Sector |
|
|
Productivity: |
6,16 |
1,91 |
4,92 |
1,80 |
25,06 |
6,20 |
|
|
Turnover of Collection Rights : |
3,18 |
5,09 |
4,09 |
5,22 |
-22,21 |
-2,49 |
|
|
Turnover of Payment Entitlements: |
2,17 |
3,54 |
2,46 |
3,68 |
-11,64 |
-3,81 |
|
|
Stock rotation: |
3,96 |
8,11 |
6,79 |
7,72 |
-41,78 |
4,97 |
|
|
Assets turnover: |
0,71 |
1,13 |
0,66 |
1,10 |
7,79 |
2,78 |
|
|
Borrowing Cost: |
0,40 |
2,33 |
0,59 |
2,45 |
-31,69 |
-4,78 |
|
>
Trend of indicators under the General Accounting Plan of 2007 (2016, 2015,
2014, 2013, 2012)
|
Cash Flow |
2016 |
2015 |
2014 |
2013 |
2012 |
|
|
Cash Flow over Sales: |
0,01 % |
0,13 % |
0,08 % |
0,32 % |
0,04 % |
|
|
Net Financial Debt: |
-0,27 |
-0,26 |
-0,15 |
0,56 |
-1,55 |
|
|
Cash Flow Yield: |
0,00 % |
0,08 % |
0,04 % |
0,11 % |
0,01 % |
|
|
EBITDA over Sales: |
45,89 % |
35,73 % |
46,01 % |
33,10 % |
24,14 % |
|
|
Profitability |
2016 |
2015 |
2014 |
2013 |
2012 |
|
|
Operating economic profitability: |
26,25 % |
15,98 % |
16,36 % |
5,40 % |
4,18 % |
|
|
Total economic profitability: |
26,37 % |
16,40 % |
16,75 % |
5,24 % |
3,72 % |
|
|
Financial profitability: |
27,05 % |
16,68 % |
16,29 % |
6,35 % |
2,97 % |
|
|
Margin: |
37,17 % |
24,39 % |
30,41 % |
14,33 % |
14,21 % |
|
|
Mark-up: |
37,34 % |
24,78 % |
30,46 % |
13,65 % |
13,65 % |
|
|
Solvency |
2016 |
2015 |
2014 |
2013 |
2012 |
|
|
Liquidity: |
0,75 |
1,06 |
0,79 |
0,49 |
0,25 |
|
|
Acid Test: |
1,75 |
1,86 |
1,38 |
1,07 |
2,55 |
|
|
Working Capital / Investment: |
0,28 |
0,25 |
0,19 |
0,06 |
0,18 |
|
|
Solvency: |
2,29 |
2,26 |
1,99 |
1,26 |
3,59 |
|
|
Indebtedness |
2016 |
2015 |
2014 |
2013 |
2012 |
|
|
Indebtedness level: |
0,36 |
0,41 |
0,37 |
0,50 |
0,11 |
|
|
Borrowing Composition: |
0,18 |
0,43 |
0,32 |
0,27 |
0,21 |
|
|
Repayment Ability: |
0,82 |
1,24 |
1,10 |
2,81 |
1,52 |
|
|
Warranty: |
3,80 |
3,47 |
3,70 |
3,01 |
10,50 |
|
|
Generated resources / Total creditors: |
0,99 |
0,66 |
0,75 |
0,32 |
0,54 |
|
|
Efficiency |
2016 |
2015 |
2014 |
2013 |
2012 |
|
|
Productivity: |
6,16 |
4,92 |
5,18 |
3,75 |
2,72 |
|
|
Turnover of Collection Rights : |
3,18 |
4,09 |
4,47 |
3,34 |
3,58 |
|
|
Turnover of Payment Entitlements: |
2,17 |
2,46 |
2,31 |
2,16 |
2,53 |
|
|
Stock rotation: |
3,96 |
6,79 |
3,30 |
8,35 |
4,30 |
|
|
Assets turnover: |
0,71 |
0,66 |
0,54 |
0,38 |
0,29 |
|
|
Borrowing Cost: |
0,40 |
0,59 |
1,35 |
0,76 |
1,44 |
|
COMPARATIVE SECTORIAL BALANCE
|
Sector-based
Comparison under the rules of the New General Accounting Plan.
|
Net Rights Granted |
Variación - |
|
|
|
Empresa |
Sector |
|
Net Rights Granted |
Variación - |
|
|
|
Empresa |
Sector |
|
Net Rights Granted |
Variación - |
|
|
|
Empresa |
Sector |
News
|
|
Alimarket |
06/11/2017 |
|
TheSize pone en marcha un nuevo almacén |
|
|
Companies related |
|
|
|
|
Public
Tenders and Works Won
|
No
Public Tenders assigned to the name of the company.
Detail
of Subsidies appearing in Balances Memories
|
|
Entity |
CONSELLERIA DE ECONOMIA, INDUSTRIA, TURISMO Y EMPLEO |
|
Subsidy Concept |
Subvención de explotación |
|
Status |
CONCEDIDA |
|
Amount Granted |
41.797,80 |
|
Entity |
CONSEJERIA DE ECONOMIA INDUSTRIA TURISMO Y EMPLEO |
|
Subsidy Concept |
Subvención de explotación |
|
Status |
CONCEDIDA |
|
Amount Granted |
41.789,43 |
|
Entity |
ORGANISMO NO ESPECIFICADO |
|
Subsidy Concept |
Subvención de explotación |
|
Status |
CONCEDIDA |
|
Amount Granted |
5.495,59 |
Research
Summary
|
|
The company was incorporated in 2007
and is engaged in the manufacture and handling of natural stone and granite. It
markets its products under the brands "Neolit" and
"Granith". The subject operates at the national and international
level. No negative comments have been made upon the subject, according to the
consulted sources. However, and as its accounting development could not be
fully assessed, we recommend doing a follow up. |
Sources
|
|
Registry of Commerce's Official Gazette. Own and
external data bases Company References |
FOREIGN EXCHANGE RATES
|
Currency |
Unit
|
Indian Rupees |
|
US Dollar |
1 |
INR 67.82 |
|
|
1 |
INR 91.68 |
|
Euro |
1 |
INR 80.29 |
|
Euro |
1 |
INR 80.06 |
Note :
Above are approximate rates obtained from sources believed to be correct
INFORMATION DETAILS
|
Analysis Done by
: |
NIY |
|
|
|
|
Report Prepared
by : |
DNS |
RATING EXPLANATIONS
|
Credit Rating |
Explanation |
Rating Comments |
|
A++ |
Minimum Risk |
Business dealings permissible with minimum
risk of default |
|
A+ |
Low Risk |
Business dealings permissible with low
risk of default |
|
A |
Acceptable Risk |
Business dealings permissible with
moderate risk of default |
|
B |
Medium Risk |
Business dealings permissible on a regular
monitoring basis |
|
C |
Medium High Risk |
Business dealings permissible preferably
on secured basis |
|
D |
High Risk |
Business dealing not recommended or on
secured terms only |
|
NB |
New Business |
No recommendation can be done due to
business in infancy stage |
|
NT |
No Trace |
No recommendation can be done as the
business is not traceable |
NB is stated where there is insufficient information to facilitate rating. However, it is not to be considered as unfavourable.
This score serves as a reference to assess
SC’s credit risk and to set the amount of credit to be extended. It is
calculated from a composite of weighted scores obtained from each of the major
sections of this report. The assessed factors are as follows:
·
Financial
condition covering various ratios
·
Company
background and operations size
·
Promoters
/ Management background
·
Payment
record
·
Litigation
against the subject
·
Industry
scenario / competitor analysis
·
Supplier
/ Customer / Banker review (wherever available)
This report is issued at
your request without any risk and responsibility on the part of MIRA INFORM
PRIVATE LIMITED (MIPL) or its officials.