|
|
|


MIRA INFORM REPORT
|
Report No. : |
508755 |
|
Report Date : |
18.05.2018 |
IDENTIFICATION DETAILS
|
Name : |
LOPEZ MATENCIO SA |
|
|
|
|
Registered Office : |
Calle Juan De La Cierva S/N ( Pol. Ind. Oeste ) - Murcia - 30169 -
Murcia |
|
|
|
|
Country : |
Spain |
|
|
|
|
Financials (as on) : |
31.12.2016 |
|
|
|
|
Date of Incorporation : |
25.12.1966 |
|
|
|
|
Legal Form : |
Public Company |
|
|
|
|
Line of Business : |
Subject is engaged in the processing of paprika, and it also imports spices. |
|
|
|
|
No. of Employees : |
7 (2017) |
RATING & COMMENTS
(Mira Inform has adopted New Rating mechanism w.e.f. 23rd
January 2017)
|
MIRA’s Rating : |
A |
|
Credit Rating |
Explanation |
Rating Comments |
|
A |
Acceptable Risk |
Business dealings permissible with
moderate risk of default |
|
Maximum Credit Limit : |
73.500 |
|
|
|
|
Status : |
Good |
|
|
|
|
Payment Behaviour : |
No Complaints |
|
|
|
|
Litigation : |
Clear |
NOTES :
Any query related to this report can be made on
e-mail : infodept@mirainform.com
while quoting report number, name and date.
SPAIN - ECONOMIC OVERVIEW
After a prolonged recession that began in 2008 in the wake of the global financial crisis, Spain marked the fourth full year of positive economic growth in 2017, with economic activity surpassing its pre-crisis peak, largely because of increased private consumption. The financial crisis of 2008 broke 16 consecutive years of economic growth for Spain, leading to an economic contraction that lasted until late 2013. In that year, the government successfully shored up its struggling banking sector - heavily exposed to the collapse of Spain’s real estate boom - with the help of an EU-funded restructuring and recapitalization program.
Until 2014, contraction in bank lending, fiscal austerity, and high unemployment constrained domestic consumption and investment. The unemployment rate rose from a low of about 8% in 2007 to more than 26% in 2013, but labor reforms prompted a modest reduction to 16.4% in 2017. High unemployment strained Spain's public finances, as spending on social benefits increased while tax revenues fell. Spain’s budget deficit peaked at 11.4% of GDP in 2010, but Spain gradually reduced the deficit to about 3.3% of GDP in 2017. Public debt has increased substantially – from 60.1% of GDP in 2010 to nearly 96.7% in 2017.
Strong export growth helped bring Spain's current account into surplus in 2013 for the first time since 1986 and sustain Spain’s economic growth. Increasing labor productivity and an internal devaluation resulting from moderating labor costs and lower inflation have improved Spain’s export competitiveness and generated foreign investor interest in the economy, restoring FDI flows.
In 2017, the Spanish Government’s minority status constrained its ability to implement controversial labor, pension, health care, tax, and education reforms. The European Commission expects the government to meet its 2017 budget deficit target and anticipates that expected economic growth in 2018 will help the government meet its deficit target. Spain’s borrowing costs are dramatically lower since their peak in mid-2012, and increased economic activity has generated a modest level of inflation, at 2% in 2017.
|
Source
: CIA |
EXECUTIVE
SUMMARY
|
|
Name: |
LOPEZ MATENCIO SA |
|
NIF / Fiscal code: |
A30066328 |
|
Trade Name |
LOPEZS MATENCIO SA |
|
Status: |
ACTIVE |
|
Incorporation Date: |
25/12/1966 |
|
Register
Data |
Register Section 8 Sheet 8641 |
|
Last
Publication in BORME: |
08/03/2018 [Appointments] |
|
Last Published Account Deposit: |
2016 |
|
Share Capital: |
0 |
|
Localization: |
CALLE JUAN DE LA CIERVA S/N ( POL. IND. OESTE
) - MURCIA - 30169 - MURCIA |
|
Telephone - Fax - Email - Website: |
Telephone. 968882696 Email.
info@lopezmatencio.com Website. www.lopezmatencio.com |
|
Number of Branches |
1 |
|
Activity: |
|
|
NACE: |
1083 - Processing of tea and coffee |
|
Registered Trademarks: |
|
|
Audited / Opinion: |
No |
|
Tenders and Awards: |
|
|
Subsidies: |
0 for a total cost of 0 |
|
Quality Certificate: |
No |
|
Maximum recommended commercial credit: |
73.500 |
|
Payment Behaviour: |
According to the agreed terms |
|
Prospects: |
Consolidation |
|
Industry situation: |
Maturity |
|
|
|
|
Defaults,
Legal Claims and Insolvency Proceedings : |
|
|
|
Number |
Amount (€) |
Most Recent Entry |
|
Insolvency Proceedings, Bankruptcy and
Suspension of Payments |
Unpublished |
--- |
--- |
|
Defaults on debt with Financial
Institutions and Large Companies |
None |
--- |
--- |
|
Judicial Claims (Notices, Executive Proceedings,
Attachments, Auctions, Bad Debt) |
None |
0 |
--- |
|
Proceedings heard by the Civil Court |
Unpublished |
0 |
--- |
|
Proceedings heard by the Labour Court |
Unpublished |
0 |
--- |
|
Partners: |
|
Shares: |
0 |
|
|
Other Links: |
0 |
|
|
No. of Active Corporate Bodies: |
SINGLE ADMINISTRATOR 1 |
|
|
Ratios |
2016 |
2015 |
Change |
|
|
Nº of employees: |
5 |
|
|
|
Guarantees
|
Properties Registered: |
Company NO, Administrator NO |
|
Financing / Guarantee Sources : |
Sources NO, Guarantees NO |
|
|
|
|
|
|
|
INVESTIGATION
SUMMARY |
|
|
The subject was incorporated in December
1966, with a Shareholder Equity that amounted to Euro 213,355 Processing of
paprika and import of spices. |
|
|
Interviewed Person: |
|
|
Enquiry
Details |
Identification
|
Social
Denomination: |
LOPEZ MATENCIO SA |
|
Trade
Name: |
LOPEZS MATENCIO SA |
|
NIF
/ Fiscal code: |
A30066328 |
|
Corporate
Status: |
ACTIVE |
|
Start
of activity: |
25-12-1966 |
|
Registered
Office: |
CALLE JUAN DE LA CIERVA S/N ( POL. IND.
OESTE ) |
|
Locality: |
MURCIA |
|
Province: |
MURCIA |
|
Postal
Code: |
30169 |
|
Telephone: |
968882696 |
|
Fax: |
968882694 |
|
Website: |
www.lopezmatencio.com |
|
Email: |
info@lopezmatencio.com |
|
Interviewed
Person: |
Administration |
|
Branch
Offices |
|
|
|
|
|
Address |
Postal Code |
City |
Province |
|
CALLE INDUSTRIAL OESTE 27 CL JUAN |
30169 |
MURCIA |
MURCIA |
Activity
|
|
|
NACE: |
1083 |
|
CNAE
Obtaining Source: |
1083 |
|
Corporate
Purpose: |
It is engaged in the processing of paprika,
and it also imports spices. |
|
Additional
Information: |
Processing of sweet, spicyand smoked
paprika. Import of spices and whole trade. |
|
Additional
Address: |
The Registered Office and premises are
located at the heading address. |
|
Franchise: |
No |
|
Import
/ export: |
IMPORTS / EXPORTS |
|
Future
Perspective: |
Consolidation |
|
Industry
situation: |
Maturity |
|
Number
of Employees |
|
|
Year |
No. of employees |
Established |
Incidentals |
|
|
|
2016 |
5 |
|
|
|
|
|
2017 |
7 |
|
|
|
The data of employees is from the latest
available financial statements in . Failing that, are estimates data calculated
by statistical methods
Chronological
Summary
|
|||
|
|
Year |
Act |
|
|
|
1990 |
Appointments/ Re-elections (1) Cessations/
Resignations/ Reversals (1) |
|
|
|
1991 |
Accounts deposit (year 1989, 1990) |
|
|
|
1993 |
Accounts deposit (year 1991, 1992)
Adaptation to Law (1) Appointments/ Re-elections (1) Cessations/
Resignations/ Reversals (1) |
|
|
|
1994 |
Accounts deposit (year 1993) |
|
|
|
1995 |
Accounts deposit (year 1994) |
|
|
|
1996 |
Accounts deposit (year 1995) Change of
Social address (1) |
|
|
|
1997 |
Accounts deposit (year 1996) Board Meeting
(1) |
|
|
|
1998 |
Accounts deposit (year 1997) Appointments/ Re-elections
(1) Board Meeting (1) Cessations/ Resignations/ Reversals (1) Other Concepts/
Events (1) |
|
|
|
1999 |
Accounts deposit (year 1998) Board Meeting
(1) |
|
|
|
2000 |
Board Meeting (1) |
|
|
|
2001 |
Accounts deposit (year 1999, 2000)
Appointments/ Re-elections (1) Board Meeting (1) Cessations/ Resignations/
Reversals (1) |
|
|
|
2002 |
Accounts deposit (year 2001) Board Meeting
(1) |
|
|
|
2003 |
Board Meeting (1) |
|
|
|
2004 |
Accounts deposit (year 2002, 2003) Board
Meeting (1) |
|
|
|
2005 |
Accounts deposit (year 2004) Board Meeting
(1) |
|
|
|
2006 |
Accounts deposit (year 2005) Board Meeting
(1) |
|
|
|
2007 |
Appointments/ Re-elections (1) Board Meeting
(1) Cessations/ Resignations/ Reversals (1) |
|
|
|
2008 |
Accounts deposit (year 2006, 2007) Board
Meeting (1) |
|
|
|
2009 |
Accounts deposit (year 2008) Appointments/ Re-elections
(1) Board Meeting (1) Cessations/ Resignations/ Reversals (1) Statutory
Modifications (1) |
|
|
|
2010 |
Accounts deposit (year 2009) Board Meeting
(1) |
|
|
|
2011 |
Accounts deposit (year 2010) Board Meeting
(1) |
|
|
|
2012 |
Accounts deposit (year 2011) Board Meeting
(1) |
|
|
|
2013 |
Accounts deposit (year 2012) Board Meeting
(1) |
|
|
|
2014 |
Accounts deposit (year 2013) Appointments/ Re-elections
(1) Board Meeting (1) Cessations/ Resignations/ Reversals (1) |
|
|
|
2015 |
Accounts deposit (year 2014) Board Meeting
(1) |
|
|
|
2016 |
Accounts deposit (year 2015) Board Meeting
(1) |
|
|
|
2017 |
Accounts deposit (year 2016) Other
Concepts/ Events (2) |
|
|
|
2018 |
Appointments/ Re-elections (1) Cessations/
Resignations/ Reversals (1) |
|
|
Breakdown
of Owners' Equity |
|
|
Registered
Capital: |
0 |
|
Paid
up capital: |
0 |
|
Founding
Partners |
|
|
Partner Name |
NIF |
% Shareholding stake |
|
|
|
JOSE LUIS LOPEZ MATENCIO PEREZ |
|
|
|
|
|
ALVARO LOPEZ MATENCIO VALCARCEL |
|
|
|
Active
Social Bodies
|
Post published |
Social Body's Name |
Appointment Date |
Other Positions in this Company |
|
SINGLE ADMINISTRATOR |
ALVARO LOPEZ MATENCIO VALCARCEL |
01/03/2018 |
1 |
|
MANAGING DIRECTOR |
JOSE LUIS LOPEZ MATENCIO PEREZ |
21/01/1993 |
6 |
|
Historical
Social Bodies |
|
Social Body's Name |
Post published |
End Date |
Other Positions in this Company |
|
JOSE LUIS LOPEZ MATENCIO PEREZ |
JOINT MANAGER |
05/11/2014 |
6 |
|
|
SECRETARY |
30/11/1990 |
|
|
|
SECRETARY |
21/01/1993 |
|
|
|
GENERAL MANAGER |
30/11/1990 |
|
|
|
GENERAL MANAGER |
21/01/1993 |
|
|
JOSE LUIS LOPEZ-MATENCIO PEREZ |
SINGLE ADMINISTRATOR |
01/03/2018 |
1 |
|
JOSE MARIA LOPEZ MATENCIO GARCIA |
PRESIDENT |
30/11/1990 |
2 |
|
|
GENERAL MANAGER |
30/11/1990 |
|
|
MARIA DOLORES PEREZ FERNANDEZ |
SINGLE ADMINISTRATOR |
24/09/1998 |
8 |
|
|
SINGLE ADMINISTRATOR |
05/11/2001 |
|
|
|
SINGLE ADMINISTRATOR |
10/12/2007 |
|
|
|
SINGLE ADMINISTRATOR |
25/09/2009 |
|
|
|
JOINT MANAGER |
05/11/2014 |
|
|
|
PRESIDENT |
21/01/1993 |
|
|
|
MEMBER |
30/11/1990 |
|
|
|
GENERAL MANAGER |
30/11/1990 |
|
|
PABLO LOPEZ MATENCIO PEREZ |
VICE CHAIRMAN |
21/01/1993 |
1 |
|
Executive
board |
|
Post |
NIF |
Name |
|
ADMINISTRATOR UNICO |
|
ALVARO LOPEZ MATENCIO VALCARCEL |
|
DIRECTOR/GENERAL MANAGER |
|
ALVARO LOPEZ MATENCIO VALCARCEL |
|
DIRECTOR/GENERAL MANAGER |
|
JOSE LUIS LOPEZ MATENCIO PEREZ |
|
Defaults,
Legal Claims and Insolvency Proceedings |
Section enabling assessment of the degree of compliance
of the company queried with its payment obligations. It provides information on
the existence and nature of all stages of Insolvency and Legal Proceedings
published with reference to the Company in the country's various Official
Bulletins and national newspapers, as well Defaults Registered in the main
national credit bureaus (ASNEF Industrial and RAI ).
> Summary
Chronological
summary
|
|
|
Number of Publications |
Amount (€) |
Start date |
End date |
|
Insolvency Proceedings, Bankruptcy and
Suspension of Payments |
|
Unpublished |
--- |
--- |
--- |
|
Request/Declaration |
|
0 |
--- |
date |
|
|
Proceedings |
|
--- |
--- |
|
--- |
|
Resolution |
|
--- |
--- |
|
--- |
|
Defaults on debt with Financial
Institutions and Large Companies |
Bank and Commercial Delinquency |
None |
0 |
|
|
|
Status: Friendly |
|
--- |
|
|
|
|
Status: Pre-Litigation |
|
--- |
|
|
|
|
Status: Litigation |
|
--- |
|
|
|
|
Status: Non-performing |
|
--- |
|
|
|
|
Status: insolvency proceedings, bankruptcy
and suspension of payments |
|
--- |
|
|
|
|
Other status |
|
--- |
|
|
|
|
Legal and Administrative Proceedings |
|
Unpublished |
--- |
|
|
|
Notices of defaults and enforcement |
|
--- |
--- |
|
--- |
|
Seizures |
|
--- |
--- |
|
--- |
|
Auctions |
|
--- |
--- |
|
--- |
|
Declarations of insolvency and bad debt |
|
--- |
--- |
|
--- |
|
Proceedings heard by the Civil Court |
|
Unpublished |
--- |
|
|
|
Proceedings heard by the Labour Court |
|
Unpublished |
--- |
|
|
> Basis for scoring
|
Positive Factors |
Adverse Factors |
|
No judicial claims have been detected in the
Official Gazettes, regarding any Entity's outstanding debts with the Tax
Bureau or Social Security administrations, as submitted by Courts of the
various court jurisdictions. No irregular payment performance has been
detected based on information obtained from credit bureaus. The current debt represents a 25.14of the
financial structure. In principle, a decrease in this ratio would indicate an
improvement in the short-term financial situation. It has financial profitability.. LOPEZ MATENCIO
SAobtains financial return as a consequence of an investment in its own
resources which, a priori, might improve its financial and economic
situation. It presents a efficient productivity. Gross
margin shows adequate efficiency of the company in the variable costs
associated with production. |
Possible difficulty accessing financing.
Uncertainties about economic recovery will hinder access to credit for new
projects or for obtaining the liquidity necessary for short-term needs. In the past year the company has suffered
terminations or resignations of corporate bodies . Instability in the
management and administration of the company may affect the operational
structure of the company disfavoring the long-term growth. |
Probability of default
|
> Estimated Probability of Default for the
next 12 months: 0.870 %
|
Sector in which comparison is carried out: 108 Manufacture of other food products |
|
|
Relative Position:
|
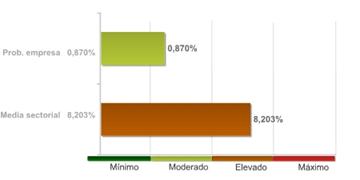
The
company's comparative analysis with the rest of the companies that comprise the
sector, shows the company holds a better position with regard to the
probability of non-compliance.
The 97.00%
of the companies of the sector LOPEZ MATENCIO SA belongs to show a higher
probability of non-compliance.
The
probability of the company's non-compliance with its payment obligations within
deadlines estimated by our qualifications models is 0,870%.
In the event
they fail to comply with the payment, the seriousness of the loss will depend
on factors such as the promptness of the commencement of the charging
management, the existence of executive documents which match the credit or the
existence of guarantees and free debt assets under the name of the debtor.
Therefore, the probability of non-compliance should not be solely interpreted
as the total loss of the owed amount.
Favourable
until 73.500 (Guideline value of
outstanding commercial balance that recommends be awarded to or maintained with
the company queried)
|
Result
of query submitted to the R.A.I. (Spanish Bad Debt Register) on |
|
Summary of Judicial Claims |
|
PROCEDURES OF CONTEST, BANKRUPTCY AND
BANKRUPTCY PROTECTION |
|
|
|
|
|
Not published |
|
|
|
Not published |
|
|
|
|
|
|
|
Not published |
|
|
|
Not published |
|
|
|
Not published |
|
|
|
Not published |
|
|
|
|
|
|
|
Not published |
|
|
|
Not published |
|
|
|
|
|
|
|
Not published |
|
Guarantees |
|
References |
|
Turnover |
|
|
Total
Sales 2016 |
1.503.429,87 |
The sales data is from the latest available
financial statements in . Failing that, are estimates data calculated by
statistical methods.
|
Estimated
Balance |
|
Micro company whose Turnover for the 2016
fiscal year increased by 41% The balance sheet shows a solid financial
statement, as evidenced by the Liquidity Ratio (3,7/1), the Treasury Ratio
(2/1) and total Solvency Ratio (4/1). |
Financial
Accounts and Balance Sheets
|
Financial
Years Presented
|
Ejercicio |
Tipo de Cuentas Anuales |
Fecha Presentacion |
|
2016 |
Normales |
October 2017 |
|
2015 |
Normales |
August 2016 |
|
2014 |
Normales |
August 2015 |
|
2013 |
Normales |
November 2014 |
|
2012 |
Normales |
September 2013 |
|
2011 |
Normales |
September 2012 |
|
2010 |
Normales |
September 2011 |
|
2009 |
Normales |
October 2010 |
|
2008 |
Normales |
September 2009 |
|
2007 |
Normales |
October 2008 |
|
2006 |
Normales |
January 2008 |
|
2005 |
Normales |
August 2006 |
|
2004 |
Normales |
August 2005 |
|
2003 |
Normales |
September 2004 |
|
2002 |
Normales |
November 2003 |
|
2001 |
Normales |
August 2002 |
|
2000 |
Normales |
September 2001 |
|
1999 |
Normales |
January 2001 |
|
1998 |
Normales |
September 1999 |
|
1997 |
Normales |
August 1998 |
|
1996 |
Normales |
November 1997 |
|
1995 |
Normales |
November 1996 |
|
1994 |
Normales |
July 1995 |
|
1993 |
Normales |
July 1994 |
|
1992 |
Normales |
July 1993 |
|
1991 |
Normales |
December 1992 |
|
1990 |
Normales |
July 1991 |
|
1989 |
Normales |
December 1990 |
The data in
the report regarding the last Company Accounts submitted by the company is taken
from the TRADE REGISTER serving the region in which the company's address is
located 31/12/2016
> Balance en formato Pyme de acuerdo
al Nuevo Plan General Contable 2007
Information
corresponding to the fiscal year
2016 2015 2014 2013 2012 is taken from information
submitted to the TRADE REGISTER. Data corresponding to fiscal years before
2016 2015 2014 2013 2012 has been compiled based on
the equivalence criteria stipulated in Act JUS/206/2009. Where the provisions
of the Act did not establish relevant equivalence criteria. To view details on
the methodology.
|
|
ORIGINAL |
ORIGINAL |
ORIGINAL |
ORIGINAL |
ORIGINAL |
|
|
Assets |
2016 |
2015 |
2014 |
2013 |
2012 |
|
|
A) NON-CURRENT ASSETS: 11000 |
48.890,00 |
21.137,00 |
27.571,00 |
34.256,00 |
29.492,00 |
|
|
I. Intangible fixed
assets : 11100 |
1.584,00 |
2.252,00 |
3.258,00 |
4.264,00 |
240,00 |
|
|
II. Tangible fixed
assets : 11200 |
47.306,00 |
18.885,00 |
24.312,00 |
29.992,00 |
29.252,00 |
|
|
III. Real estate
investment: 11300 |
0,00 |
0,00 |
0,00 |
0,00 |
0,00 |
|
|
IV. Long-term
investments in Group companies and associates : 11400 |
0,00 |
0,00 |
0,00 |
0,00 |
0,00 |
|
|
V. Long-term financial
investments: 11500 |
0,00 |
0,00 |
0,00 |
0,00 |
0,00 |
|
|
VI. Assets for
deferred tax : 11600 |
0,00 |
0,00 |
0,00 |
0,00 |
0,00 |
|
|
VII. Non-current trade
debtors : 11700 |
0,00 |
0,00 |
0,00 |
0,00 |
0,00 |
|
|
B) CURRENT ASSETS: 12000 |
838.068,00 |
660.968,00 |
644.875,00 |
662.218,00 |
581.173,00 |
|
|
I. Stocks :
12200 |
391.985,00 |
315.520,00 |
261.179,00 |
315.525,00 |
305.488,00 |
|
|
II. Trade debtors and others
receivable accounts : 12300 |
395.472,00 |
230.393,00 |
265.296,00 |
225.254,00 |
215.131,00 |
|
|
1. Trade debtors / accounts receivable: 12380 |
389.675,00 |
225.986,00 |
265.296,00 |
222.017,00 |
203.205,00 |
|
|
a) Long-term receivables from sales and services
supplied : 12381 |
0,00 |
0,00 |
0,00 |
0,00 |
0,00 |
|
|
b) Customers for sales and provisions of services :
12382 |
389.675,00 |
225.986,00 |
265.296,00 |
222.017,00 |
203.205,00 |
|
|
2. Called up share capital: 12370 |
0,00 |
0,00 |
0,00 |
0,00 |
0,00 |
|
|
3. Other accounts receivable : 12390 |
5.797,00 |
4.407,00 |
0,00 |
3.237,00 |
11.926,00 |
|
|
III. Short-term investment
in Group companies and associates: 12400 |
0,00 |
0,00 |
0,00 |
0,00 |
0,00 |
|
|
IV. Short-term
financial investments : 12500 |
0,00 |
0,00 |
0,00 |
0,00 |
0,00 |
|
|
V. Short-term accruals
: 12600 |
0,00 |
0,00 |
0,00 |
0,00 |
0,00 |
|
|
VI. Cash and other
equivalent liquid assets : 12700 |
50.611,00 |
115.055,00 |
118.400,00 |
121.438,00 |
60.554,00 |
|
|
TOTAL ASSETS (A + B) : 10000 |
886.957,00 |
682.105,00 |
672.446,00 |
696.474,00 |
610.665,00 |
|
|
|
ORIGINAL |
ORIGINAL |
ORIGINAL |
ORIGINAL |
ORIGINAL |
|
|
Liabilities and Net Worth |
2016 |
2015 |
2014 |
2013 |
2012 |
|
|
A) NET WORTH: 20000 |
663.956,00 |
576.302,00 |
549.001,00 |
521.081,00 |
509.798,00 |
|
|
A-1) Shareholders' equity: 21000 |
663.236,00 |
574.576,00 |
546.269,00 |
521.081,00 |
509.798,00 |
|
|
I. Capital:
21100 |
213.355,00 |
213.355,00 |
213.355,00 |
213.355,00 |
213.355,00 |
|
|
1.
Registered capital : 21110 |
213.355,00 |
213.355,00 |
213.355,00 |
213.355,00 |
213.355,00 |
|
|
2. (Uncalled capital): 21120 |
0,00 |
0,00 |
0,00 |
0,00 |
0,00 |
|
|
II. Share premium:
21200 |
0,00 |
0,00 |
0,00 |
0,00 |
0,00 |
|
|
III. Reserves:
21300 |
361.221,00 |
332.914,00 |
307.726,00 |
296.443,00 |
287.415,00 |
|
|
1. Capitalisation Reserves: 21350 |
2.267,00 |
0,00 |
0,00 |
0,00 |
0,00 |
|
|
2.
Otras Reservas: 21360 |
358.954,00 |
0,00 |
0,00 |
0,00 |
0,00 |
|
|
IV. (Common stock
equity): 21400 |
0,00 |
0,00 |
0,00 |
0,00 |
0,00 |
|
|
V. Profit or loss
brought forward: 21500 |
0,00 |
0,00 |
0,00 |
0,00 |
0,00 |
|
|
VI. Other
shareholders' contributions: 21600 |
0,00 |
0,00 |
0,00 |
0,00 |
0,00 |
|
|
VII. Result of the
period: 21700 |
88.660,00 |
28.307,00 |
25.188,00 |
11.283,00 |
9.028,00 |
|
|
VIII. (Interim dividend):
21800 |
0,00 |
0,00 |
0,00 |
0,00 |
0,00 |
|
|
A-2) Changes in net worth : 22000 |
0,00 |
0,00 |
0,00 |
0,00 |
0,00 |
|
|
A-3) Received subsidies, donations and
legacies: 23000 |
720,00 |
1.726,00 |
2.732,00 |
0,00 |
0,00 |
|
|
B) NON-CURRENT LIABILITIES: 31000 |
0,00 |
0,00 |
0,00 |
0,00 |
0,00 |
|
|
I. Long-term
provisions: 31100 |
0,00 |
0,00 |
0,00 |
0,00 |
0,00 |
|
|
II. Long-term
creditors : 31200 |
0,00 |
0,00 |
0,00 |
0,00 |
0,00 |
|
|
1. Amounts owed to credit institutions: 31220 |
0,00 |
0,00 |
0,00 |
0,00 |
0,00 |
|
|
2. Creditors from financial leasing : 31230 |
0,00 |
0,00 |
0,00 |
0,00 |
0,00 |
|
|
3.
Other long-term creditors : 31290 |
0,00 |
0,00 |
0,00 |
0,00 |
0,00 |
|
|
III. Long-term debts
with Group companies and associates: 31300 |
0,00 |
0,00 |
0,00 |
0,00 |
0,00 |
|
|
IV. Liabilities for
deferred tax: 31400 |
0,00 |
0,00 |
0,00 |
0,00 |
0,00 |
|
|
V. Long-term accruals:
31500 |
0,00 |
0,00 |
0,00 |
0,00 |
0,00 |
|
|
VI. Non-current trade
creditors : 31600 |
0,00 |
0,00 |
0,00 |
0,00 |
0,00 |
|
|
VII. Special long-term
debts : 31700 |
0,00 |
0,00 |
0,00 |
0,00 |
0,00 |
|
|
C) CURRENT LIABILITIES : 32000 |
223.001,00 |
105.803,00 |
123.445,00 |
175.393,00 |
100.867,00 |
|
|
I. Short-term
provisions: 32200 |
0,00 |
0,00 |
0,00 |
0,00 |
0,00 |
|
|
II. Short-term
creditors : 32300 |
51.160,00 |
24.827,00 |
25.101,00 |
25.943,00 |
25.101,00 |
|
|
1. Amounts owed to credit institutions: 32320 |
0,00 |
0,00 |
0,00 |
0,00 |
0,00 |
|
|
2.
Creditors from financial leasing : 32330 |
0,00 |
0,00 |
0,00 |
0,00 |
0,00 |
|
|
3. Other short-term creditors : 32390 |
51.160,00 |
24.827,00 |
25.101,00 |
25.943,00 |
25.101,00 |
|
|
III. Short-term amounts
owed to group and associated companies: 32400 |
0,00 |
0,00 |
0,00 |
0,00 |
0,00 |
|
|
IV. Trade creditors
and other accounts payable: 32500 |
171.841,00 |
80.976,00 |
98.344,00 |
149.451,00 |
75.766,00 |
|
|
1.
Suppliers: 32580 |
123.002,00 |
54.996,00 |
68.981,00 |
111.446,00 |
55.369,00 |
|
|
a) Long-term debts : 32581 |
0,00 |
0,00 |
0,00 |
0,00 |
0,00 |
|
|
b) Short-term debts : 32582 |
123.002,00 |
54.996,00 |
68.981,00 |
111.446,00 |
55.369,00 |
|
|
2. Other creditors: 32590 |
48.839,00 |
25.979,00 |
29.362,00 |
38.005,00 |
20.397,00 |
|
|
V. Short-term accruals
: 32600 |
0,00 |
0,00 |
0,00 |
0,00 |
0,00 |
|
|
VI. Special short-term
debts : 32700 |
0,00 |
0,00 |
0,00 |
0,00 |
0,00 |
|
|
TOTAL NET WORTH AND LIABILITIES (A + B + C)
: 30000 |
886.957,00 |
682.105,00 |
672.446,00 |
696.474,00 |
610.665,00 |
|
|
|
ORIGINAL |
ORIGINAL |
ORIGINAL |
ORIGINAL |
ORIGINAL |
|
|
Profit and Loss |
2016 |
2015 |
2014 |
2013 |
2012 |
|
|
1. Net turnover:
40100 |
1.503.430,00 |
1.065.086,00 |
1.197.159,00 |
1.079.202,00 |
885.435,00 |
|
|
2. Changes in stocks of
finished goods and work in progress: 40200 |
0,00 |
-1.703,00 |
0,00 |
54,00 |
2.033,00 |
|
|
3. Works carried out
by the company for its assets: 40300 |
0,00 |
0,00 |
0,00 |
0,00 |
0,00 |
|
|
4. Supplies :
40400 |
-1.146.154,00 |
-799.814,00 |
-943.181,00 |
-851.716,00 |
-660.013,00 |
|
|
5. Other operating
income: 40500 |
0,00 |
420,00 |
420,00 |
0,00 |
0,00 |
|
|
6. Personnel costs:
40600 |
-150.990,00 |
-145.279,00 |
-148.476,00 |
-139.206,00 |
-139.397,00 |
|
|
7. Other operating
costs: 40700 |
-77.334,00 |
-74.066,00 |
-66.368,00 |
-64.958,00 |
-69.982,00 |
|
|
8. Amortisation of
fixed assets: 40800 |
-13.418,00 |
-8.685,00 |
-7.986,00 |
-8.181,00 |
-5.998,00 |
|
|
9. Allocation of
subsidies of non-financial fixed assets and other: 40900 |
1.006,00 |
1.006,00 |
2.012,00 |
0,00 |
0,00 |
|
|
10. Excess provisions
: 41000 |
0,00 |
0,00 |
0,00 |
0,00 |
0,00 |
|
|
11. Impairment and
result of transfers of fixed assets: 41100 |
0,00 |
0,00 |
0,00 |
0,00 |
0,00 |
|
|
12. Other results :
41300 |
820,00 |
0,00 |
-5,00 |
-162,00 |
-50,00 |
|
|
A) OPERATING INCOME (1 + 2 + 3 + 4 + 5 + 6 +
7 + 8 + 9 + 10 + 11 + 12) : 49100 |
117.359,00 |
36.964,00 |
33.576,00 |
15.033,00 |
12.029,00 |
|
|
13. Financial income :
41400 |
5,00 |
23,00 |
9,00 |
11,00 |
8,00 |
|
|
a)
Allocation of financial subsidies, donations and legacies: 41430 |
0,00 |
0,00 |
0,00 |
0,00 |
0,00 |
|
|
b) Other financial income: 41490 |
5,00 |
23,00 |
9,00 |
11,00 |
8,00 |
|
|
14. Financial
expenditure : 41500 |
0,00 |
0,00 |
0,00 |
0,00 |
0,00 |
|
|
15. Changes in fair
value of financial instruments : 41600 |
0,00 |
0,00 |
0,00 |
0,00 |
0,00 |
|
|
16. Exchange rate
differences: 41700 |
0,00 |
0,00 |
0,00 |
0,00 |
0,00 |
|
|
17. Impairment and
result for transfers of financial instruments : 41800 |
0,00 |
0,00 |
0,00 |
0,00 |
0,00 |
|
|
18. Other financial
income and expenditure: 42100 |
0,00 |
0,00 |
0,00 |
0,00 |
0,00 |
|
|
a)
Incorporation of financial expenditure to assets: 42110 |
0,00 |
0,00 |
0,00 |
0,00 |
0,00 |
|
|
b) Financial income from arrangement with creditors: 42120 |
0,00 |
0,00 |
0,00 |
0,00 |
0,00 |
|
|
c)
Other income and expenditure: 42130 |
0,00 |
0,00 |
0,00 |
0,00 |
0,00 |
|
|
B) FINANCIAL REVENUE ( 13 + 14 + 15 + 16 +
17 +18 ) : 49200 |
5,00 |
23,00 |
9,00 |
11,00 |
8,00 |
|
|
C) NET RESULT BEFORE TAXES ( A + B ) :
49300 |
117.365,00 |
36.987,00 |
33.584,00 |
15.044,00 |
12.037,00 |
|
|
19. Income taxes :
41900 |
-28.704,00 |
-8.680,00 |
-8.396,00 |
-3.761,00 |
-3.009,00 |
|
|
D) RESULT OF THE PERIOD ( C + 19 ) :
49500 |
88.660,00 |
28.307,00 |
25.188,00 |
11.283,00 |
9.028,00 |
|
> Normal Balance Sheet under the rules of
the 1990 General Accounting Plan (repealed since 1st January of 2008)
Information
corresponding to the fiscal year
2016 2015 2014 2013 2012 has been compiled based on
the equivalence criteria stipulated in Act JUS/206/2009. Where the provisions
of the Act did not establish relevant equivalence criteria. To view details on
the methodology 2016 2015 2014 2013 2012 is taken
from information submitted to the TRADE REGISTER.
|
|
EQUIVALENCIA |
EQUIVALENCIA |
EQUIVALENCIA |
EQUIVALENCIA |
EQUIVALENCIA |
|
|
ASSETS |
2016 |
2015 |
2014 |
2013 |
2012 |
|
|
A) SHAREHOLDERS (PARTNERS) BY UNCALLED
SUSCRIBED CAPITAL: |
0,00 |
0,00 |
0,00 |
0,00 |
0,00 |
|
|
B) FIXED ASSETS: |
48.890,00 |
21.137,00 |
27.571,00 |
34.256,00 |
29.492,00 |
|
|
I. Formation expenses:
|
0,00 |
0,00 |
0,00 |
0,00 |
0,00 |
|
|
II. Intangible fixed
assets: |
1.584,00 |
2.252,00 |
3.258,00 |
4.264,00 |
240,00 |
|
|
III. Tangible fixed
assets: |
47.306,00 |
18.885,00 |
24.312,00 |
29.992,00 |
29.252,00 |
|
|
IV. Financial
investments: |
0,00 |
0,00 |
0,00 |
0,00 |
0,00 |
|
|
V. Own shares: |
0,00 |
0,00 |
0,00 |
0,00 |
0,00 |
|
|
VI. Long-term trade
receivables: |
0,00 |
0,00 |
0,00 |
0,00 |
0,00 |
|
|
C) Deferred expenses: |
0,00 |
0,00 |
0,00 |
0,00 |
0,00 |
|
|
D) CURRENT ASSETS: |
838.068,00 |
660.968,00 |
644.875,00 |
662.218,00 |
581.173,00 |
|
|
I. Called-up share
capital (not paid): |
0,00 |
0,00 |
0,00 |
0,00 |
0,00 |
|
|
II. Stocks: |
391.985,00 |
315.520,00 |
261.179,00 |
315.525,00 |
305.488,00 |
|
|
III. Debtors: |
395.472,00 |
230.393,00 |
265.296,00 |
225.254,00 |
215.131,00 |
|
|
IV. Short-term
investments: |
0,00 |
0,00 |
0,00 |
0,00 |
0,00 |
|
|
V. Short-term treasury
shares: |
0,00 |
0,00 |
0,00 |
0,00 |
0,00 |
|
|
VI. Cash at bank and
in hand: |
50.611,00 |
115.055,00 |
118.400,00 |
121.438,00 |
60.554,00 |
|
|
VII. Prepayments and
accrued income: |
0,00 |
0,00 |
0,00 |
0,00 |
0,00 |
|
|
GENERAL TOTAL (A + B + C + D): |
886.957,00 |
682.105,00 |
672.446,00 |
696.474,00 |
610.665,00 |
|
MERCANTILE
REGISTRY.
|
|
EQUIVALENCIA |
EQUIVALENCIA |
EQUIVALENCIA |
EQUIVALENCIA |
EQUIVALENCIA |
|
|
LIABILITIES |
2016 |
2015 |
2014 |
2013 |
2012 |
|
|
A) EQUITY: |
663.236,00 |
574.576,00 |
546.269,00 |
521.081,00 |
509.798,00 |
|
|
I. Subscribed capital:
|
213.355,00 |
213.355,00 |
213.355,00 |
213.355,00 |
213.355,00 |
|
|
II. Share premium:
|
0,00 |
0,00 |
0,00 |
0,00 |
0,00 |
|
|
III. Revaluation
reserves: |
0,00 |
0,00 |
0,00 |
0,00 |
0,00 |
|
|
IV. Reserves: |
361.221,00 |
332.914,00 |
307.726,00 |
296.443,00 |
287.415,00 |
|
|
a) Differences for capital adjustment to euros: |
6,00 |
6,00 |
5,00 |
5,00 |
5,00 |
|
|
b)
Remaining Reserves: |
361.215,00 |
332.908,00 |
307.720,00 |
296.438,00 |
287.410,00 |
|
|
V. Profit or loss
brought forward: |
0,00 |
0,00 |
0,00 |
0,00 |
0,00 |
|
|
VI. Profit or loss for
the financial year: |
88.660,00 |
28.307,00 |
25.188,00 |
11.283,00 |
9.028,00 |
|
|
VII. Interim dividend
paid: |
0,00 |
0,00 |
0,00 |
0,00 |
0,00 |
|
|
VIII. Own shares for
capital reduction: |
0,00 |
0,00 |
0,00 |
0,00 |
0,00 |
|
|
B) Deferred income: |
720,00 |
1.726,00 |
2.732,00 |
0,00 |
0,00 |
|
|
C) PROVISIONS FOR LIABILITIES AND CHARGES:
|
0,00 |
0,00 |
0,00 |
0,00 |
0,00 |
|
|
D) LONG TERM LIABILITIES: |
0,00 |
0,00 |
0,00 |
0,00 |
0,00 |
|
|
E) SHORT TERM CREDITORS: |
223.001,00 |
105.803,00 |
123.445,00 |
175.393,00 |
100.867,00 |
|
|
F) SHORT-TERM PROVISIONS FOR LIABILITIES
AND CHARGES: |
0,00 |
0,00 |
0,00 |
0,00 |
0,00 |
|
|
GENERAL TOTAL (A + B + C + D + E + F):
|
886.957,00 |
682.105,00 |
672.446,00 |
696.474,00 |
610.665,00 |
|
MERCANTILE
REGISTRY.
|
|
EQUIVALENCIA |
EQUIVALENCIA |
EQUIVALENCIA |
EQUIVALENCIA |
EQUIVALENCIA |
|
|
DEBIT |
2016 |
2015 |
2014 |
2013 |
2012 |
|
|
A) CHARGES (A.1 to A.15): |
1.416.601,00 |
1.038.227,00 |
1.174.412,00 |
1.067.930,00 |
876.415,00 |
|
|
A.1. Operating consumption: |
1.146.154,00 |
801.517,00 |
943.181,00 |
851.661,00 |
657.979,00 |
|
|
A.2. Staff Costs: |
150.990,00 |
145.279,00 |
148.476,00 |
139.206,00 |
139.397,00 |
|
|
a) Wages, salaries et al.: |
120.287,00 |
115.738,00 |
118.285,00 |
110.900,00 |
111.052,00 |
|
|
b) Social security costs: |
30.702,00 |
29.541,00 |
30.191,00 |
28.306,00 |
28.345,00 |
|
|
A.3. Depreciation expense: |
13.418,00 |
8.685,00 |
7.986,00 |
8.181,00 |
5.998,00 |
|
|
A.4. Variation of trade provisions and losses of unrecovered receivables:
|
0,00 |
0,00 |
0,00 |
0,00 |
0,00 |
|
|
A.5. Other operating charges: |
77.334,00 |
74.066,00 |
66.368,00 |
64.958,00 |
69.982,00 |
|
|
A.I. OPERATING
BENEFITS (B.1-A.1-A.2-A.3-A.4-A.5): |
115.534,00 |
35.958,00 |
31.569,00 |
15.196,00 |
12.079,00 |
|
|
A.6. Financial and similar charges: |
0,00 |
0,00 |
0,00 |
0,00 |
0,00 |
|
|
a) Due to liabilities with companies of the group:
|
0,00 |
0,00 |
0,00 |
0,00 |
0,00 |
|
|
b) Due to liabilities with associated companies: |
0,00 |
0,00 |
0,00 |
0,00 |
0,00 |
|
|
c) Due to other debts: |
0,00 |
0,00 |
0,00 |
0,00 |
0,00 |
|
|
d) Losses from financial investments: |
0,00 |
0,00 |
0,00 |
0,00 |
0,00 |
|
|
A.7. Financial investment provision change: |
0,00 |
0,00 |
0,00 |
0,00 |
0,00 |
|
|
A.8. Exchange losses: |
0,00 |
0,00 |
0,00 |
0,00 |
0,00 |
|
|
A.II. POSITIVE FINANCIAL
RESULTS (B.2+B.3-A.6-A.7-A.8): |
5,00 |
23,00 |
9,00 |
11,00 |
8,00 |
|
|
A.III. PROFIT FROM
ORDINARY ACTIVITIES (A.I+A.II-B.I-B.II): |
115.539,00 |
35.981,00 |
31.577,00 |
15.206,00 |
12.087,00 |
|
|
A.9.
Changes in provisions for intangible, tangible and securities portfolio:
|
0,00 |
0,00 |
0,00 |
0,00 |
0,00 |
|
|
A.10. Losses from tangible and intangible fixed assets and portfolio: |
0,00 |
0,00 |
0,00 |
0,00 |
0,00 |
|
|
A.11. Losses from transactions with own shares and debentures: |
0,00 |
0,00 |
0,00 |
0,00 |
0,00 |
|
|
A.12. Extraordinary expenses: |
0,00 |
0,00 |
5,00 |
162,00 |
50,00 |
|
|
A.13.
Prior year expenses and losses: |
0,00 |
0,00 |
0,00 |
0,00 |
0,00 |
|
|
A.IV. EXTRAORDINARY
PROFIT (B.4+B.5+B.6+B.7+B.8-A.9-A.10-A.11-A.12-A.13): |
1.826,00 |
1.006,00 |
2.007,00 |
0,00 |
0,00 |
|
|
A.V. PROFIT BEFORE TAXES
(A.III+A.IV-B.III-B.IV): |
117.365,00 |
36.987,00 |
33.584,00 |
15.044,00 |
12.037,00 |
|
|
A.14. Corporation Tax: |
28.704,00 |
8.680,00 |
8.396,00 |
3.761,00 |
3.009,00 |
|
|
A.15. Miscellaneous taxes: |
0,00 |
0,00 |
0,00 |
0,00 |
0,00 |
|
|
A.VI. FINANCIAL YEAR
RESULT (PROFIT) (A.V-A.14-A.15): |
88.660,00 |
28.307,00 |
25.188,00 |
11.283,00 |
9.028,00 |
|
MERCANTILE
REGISTRY.
|
|
EQUIVALENCIA |
EQUIVALENCIA |
EQUIVALENCIA |
EQUIVALENCIA |
EQUIVALENCIA |
|
|
CREDIT |
2016 |
2015 |
2014 |
2013 |
2012 |
|
|
B) INCOME ( B.1 to B.8): |
1.505.261,00 |
1.066.534,00 |
1.199.600,00 |
1.079.213,00 |
885.443,00 |
|
|
B.1. Operating income: |
1.503.430,00 |
1.065.506,00 |
1.197.579,00 |
1.079.202,00 |
885.435,00 |
|
|
a) Net total sales: |
1.503.430,00 |
1.065.086,00 |
1.197.159,00 |
1.079.202,00 |
885.435,00 |
|
|
b) Miscellaneous operating income: |
0,00 |
420,00 |
420,00 |
0,00 |
0,00 |
|
|
B.I. PÉRDIDAS DE
EXPLOTACIÓN (A.1+A.2+A.3+A.4+A.5-B.1 ): |
0,00 |
0,00 |
0,00 |
0,00 |
0,00 |
|
|
B.2. Financial income: |
5,00 |
23,00 |
9,00 |
11,00 |
8,00 |
|
|
a) Companies of the group: |
0,00 |
0,00 |
0,00 |
0,00 |
0,00 |
|
|
b) In associated companies: |
0,00 |
0,00 |
0,00 |
0,00 |
0,00 |
|
|
c) Miscellaneous: |
5,00 |
23,00 |
9,00 |
11,00 |
8,00 |
|
|
d) Profit on financial investment: |
0,00 |
0,00 |
0,00 |
0,00 |
0,00 |
|
|
B.3. Exchange gains: |
0,00 |
0,00 |
0,00 |
0,00 |
0,00 |
|
|
B.II. NEGATIVE
FINANCIAL RESULTS (A.6+A.7+A.8-B.2-B.3): |
0,00 |
0,00 |
0,00 |
0,00 |
0,00 |
|
|
B.III. LOSSES ON
ORDINARY ACTIVITIES ( B.I + B.II - A.I - A.II ): |
0,00 |
0,00 |
0,00 |
0,00 |
0,00 |
|
|
B.4.
Profit on disposal of both tangible and intangible fixed assets and
securities portfolio: |
0,00 |
0,00 |
0,00 |
0,00 |
0,00 |
|
|
B.5. Profit on transactions with own shares and debentures: |
0,00 |
0,00 |
0,00 |
0,00 |
0,00 |
|
|
B.6. Capital grants transferred to profit and loss: |
1.006,00 |
1.006,00 |
2.012,00 |
0,00 |
0,00 |
|
|
B.7. Extraordinary income: |
820,00 |
0,00 |
0,00 |
0,00 |
0,00 |
|
|
B.8.
Income and profit of former financial years: |
0,00 |
0,00 |
0,00 |
0,00 |
0,00 |
|
|
B.IV. NEGATIVE
EXTRAORDINARY RESULTS (A.9+A.10+A.11+A.12+A.13-B.4-B.5-B.6-B.7-B.8): |
0,00 |
0,00 |
0,00 |
162,00 |
50,00 |
|
|
B.V. LOSSES BEFORE
TAXES (B.III+B.IV-A.III-A.IV): |
0,00 |
0,00 |
0,00 |
0,00 |
0,00 |
|
|
B.VI. FINANCIAL YEAR
RESULTS (LOSSES) (B.V+A.14+A.15): |
0,00 |
0,00 |
0,00 |
0,00 |
0,00 |
|
MERCANTILE
REGISTRY.
CASHFLOW
STATEMENT
Model: Normal
> Source of information: Data contained in
this section is taken from the information declared in the Annual Accounts
submitted to the Trade Register.
|
Net Rights Granted |
2016 |
2015 |
2014 |
2013 |
2012 |
|
|
1. Fiscal year result before taxes.:
61100 |
117.365,00 |
36.987,00 |
33.584,00 |
15.044,00 |
12.037,00 |
|
|
2. Results adjustments.: 61200 |
13.413,00 |
8.663,00 |
7.977,00 |
8.171,00 |
5.990,00 |
|
|
a) Fixed Assets Amortization
(+).: 61201 |
13.418,00 |
8.685,00 |
7.986,00 |
8.181,00 |
5.998,00 |
|
|
g) Financial income
(-).: 61207 |
-5,00 |
-23,00 |
-9,00 |
-11,00 |
-8,00 |
|
|
3. Changes in current capital equity.:
61300 |
-179.383,00 |
-45.486,00 |
-45.198,00 |
49.763,00 |
-89.209,00 |
|
|
a) Stock (+/-).:
61301 |
-76.465,00 |
-54.341,00 |
54.346,00 |
-10.037,00 |
-79.270,00 |
|
|
d) Debtors and other
accounts receivable (+/-). : 61302 |
-165.079,00 |
34.902,00 |
-40.041,00 |
-10.123,00 |
-12.374,00 |
|
|
d) Creditors and other
accounts payable (+/-). : 61304 |
62.161,00 |
-26.048,00 |
-59.503,00 |
69.923,00 |
2.435,00 |
|
|
4. Cash Flows from Other Operating
Activities: 61400 |
5,00 |
23,00 |
9,00 |
11,00 |
8,00 |
|
|
c) Interest collection
(+). : 61403 |
5,00 |
23,00 |
9,00 |
11,00 |
8,00 |
|
|
5. Cash Flows from Operating Activities (1
+ 2 + 3 + 4) : 61500 |
-48.600,00 |
186,00 |
-3.628,00 |
72.988,00 |
-71.174,00 |
|
|
6. Payments for investment (-).:
62100 |
-28.421,00 |
0,00 |
0,00 |
-4.764,00 |
0,00 |
|
|
b) Intangible fixed
assets. : 62102 |
0,00 |
0,00 |
0,00 |
-4.024,00 |
0,00 |
|
|
c) Fixed assets. :
62103 |
-28.421,00 |
0,00 |
0,00 |
-740,00 |
0,00 |
|
|
7. Divestment payment collection (+). :
62200 |
669,00 |
6.434,00 |
6.686,00 |
0,00 |
5.998,00 |
|
|
b) Intangible fixed
assets. : 62202 |
669,00 |
1.006,00 |
1.006,00 |
0,00 |
461,00 |
|
|
c) Fixed assets. :
62203 |
0,00 |
5.428,00 |
5.680,00 |
0,00 |
5.536,00 |
|
|
8. Cash Flow from Investing Activities
(6+7) less Amortization: 62300 |
-41.171,00 |
-2.252,00 |
-1.300,00 |
-12.945,00 |
0,00 |
|
|
9. Payment collection and payments for
equity instruments. : 63100 |
-1.006,00 |
-1.006,00 |
2.732,00 |
0,00 |
0,00 |
|
|
e) Grants, donations
and bequests received (+). : 63105 |
-1.006,00 |
-1.006,00 |
2.732,00 |
0,00 |
0,00 |
|
|
10. Payment collection and payments for
financial liabilities instruments.: 63200 |
26.333,00 |
-274,00 |
-841,00 |
841,00 |
-383,00 |
|
|
a) Issuance :
63201 |
26.333,00 |
0,00 |
0,00 |
841,00 |
0,00 |
|
|
5. Other debts (+). : 63206 |
26.333,00 |
0,00 |
0,00 |
841,00 |
0,00 |
|
|
b) Repayment and
amortization of : 63207 |
0,00 |
-274,00 |
-841,00 |
0,00 |
-383,00 |
|
|
5. Other debts (-). :
63212 |
0,00 |
-274,00 |
-841,00 |
0,00 |
-383,00 |
|
|
11. Payments from dividends and
remunerations from other assets instruments. : 63300 |
0,00 |
0,00 |
0,00 |
0,00 |
0,00 |
|
|
12. Cash Flows from Financing Activities
(9+10+11): 63400 |
25.327,00 |
-1.280,00 |
1.891,00 |
841,00 |
-383,00 |
|
|
D) EFFECT OF EXCHANGE RATE CHANGES:
64000 |
0,00 |
0,00 |
0,00 |
0,00 |
0,00 |
|
|
E) NET INCREASE/DECREASE OF CASH OR
EQUIVALENT ASSETS (+/-5+/-8+/12+/-D) : 65000 |
-64.444,00 |
-3.346,00 |
-3.038,00 |
60.884,00 |
-71.557,00 |
|
|
Cash or equivalent
assets as of beginning of the fiscal year.: 65100 |
115.055,00 |
118.400,00 |
121.438,00 |
60.554,00 |
132.111,00 |
|
|
Cash or equivalent
assets as of end of the fiscal year.: 65200 |
50.611,00 |
115.055,00 |
118.400,00 |
121.438,00 |
60.554,00 |
|
FINANCIAL
DIAGNOSIS
> Economic-Financial Comparative Analysis
Data used in the following ratios and
indicators is taken from the Annual Accounts submitted by the company to the
TRADE REGISTER.
> Comparison within the Sector
|
Cash Flow |
2016 |
2015 |
Variación 2016 - 2015 |
|
|||
|
|
Empresa |
Sector |
Empresa |
Sector |
Empresa |
Sector |
|
|
Cash Flow over Sales: |
-0,04 % |
0,01 % |
0,00 % |
0,01 % |
|
10,77 % |
|
|
Net Financial Debt: |
0,00 |
1,83 |
-2,02 |
2,16 |
100,21 |
-15,49 |
|
|
Cash Flow Yield: |
-0,07 % |
0,01 % |
0,00 % |
0,01 % |
|
7,71 % |
|
|
EBITDA over Sales: |
8,58 % |
6,68 % |
4,19 % |
6,39 % |
104,63 % |
4,53 % |
|
|
Profitability |
2016 |
2015 |
Variación 2016 - 2015 |
|
|||
|
|
Empresa |
Sector |
Empresa |
Sector |
Empresa |
Sector |
|
|
Operating economic profitability: |
13,14 % |
4,39 % |
5,42 % |
3,92 % |
142,46 % |
12,05 % |
|
|
Total economic profitability: |
13,23 % |
4,44 % |
5,42 % |
3,96 % |
144,03 % |
12,28 % |
|
|
Financial profitability: |
13,37 % |
5,55 % |
4,93 % |
4,60 % |
171,34 % |
20,73 % |
|
|
Margin: |
7,75 % |
4,45 % |
3,47 % |
3,94 % |
123,44 % |
13,07 % |
|
|
Mark-up: |
7,75 % |
4,49 % |
3,47 % |
3,56 % |
123,31 % |
25,95 % |
|
|
Solvency |
2016 |
2015 |
Variación 2016 - 2015 |
|
|||
|
|
Empresa |
Sector |
Empresa |
Sector |
Empresa |
Sector |
|
|
Liquidity: |
0,23 |
0,38 |
1,09 |
0,34 |
-79,13 |
12,46 |
|
|
Acid Test: |
2,00 |
1,19 |
3,27 |
1,17 |
-38,73 |
1,72 |
|
|
Working Capital / Investment: |
0,69 |
0,23 |
0,81 |
0,21 |
-14,80 |
10,07 |
|
|
Solvency: |
3,76 |
1,88 |
6,25 |
1,78 |
-39,84 |
5,68 |
|
|
Indebtedness |
2016 |
2015 |
Variación 2016 - 2015 |
|
|||
|
|
Empresa |
Sector |
Empresa |
Sector |
Empresa |
Sector |
|
|
Indebtedness level: |
0,34 |
0,85 |
0,18 |
0,92 |
82,94 |
-6,69 |
|
|
Borrowing Composition: |
0,00 |
0,66 |
0,00 |
0,67 |
|
-1,40 |
|
|
Repayment Ability: |
1,73 |
8,98 |
2,37 |
9,47 |
-27,03 |
-5,15 |
|
|
Warranty: |
3,98 |
2,17 |
6,45 |
2,09 |
-38,31 |
3,73 |
|
|
Generated resources / Total creditors:
|
0,46 |
0,10 |
0,35 |
0,09 |
30,92 |
9,42 |
|
|
Efficiency |
2016 |
2015 |
Variación 2016 - 2015 |
|
|||
|
|
Empresa |
Sector |
Empresa |
Sector |
Empresa |
Sector |
|
|
Productivity: |
1,85 |
1,30 |
1,31 |
1,30 |
41,82 |
0,16 |
|
|
Turnover of Collection Rights : |
3,80 |
4,85 |
4,62 |
4,74 |
-17,80 |
2,31 |
|
|
Turnover of Payment Entitlements: |
7,12 |
3,12 |
10,77 |
3,16 |
-33,90 |
-1,19 |
|
|
Stock rotation: |
3,54 |
4,30 |
3,26 |
4,91 |
8,51 |
-12,59 |
|
|
Assets turnover: |
1,70 |
0,99 |
1,56 |
0,99 |
8,51 |
-0,90 |
|
|
Borrowing Cost: |
0,00 |
1,53 |
0,00 |
1,77 |
|
-13,42 |
|
> Trend of indicators under the General
Accounting Plan of 2007 (2016, 2015, 2014, 2013, 2012)
|
Cash Flow |
2016 |
2015 |
2014 |
2013 |
2012 |
|
|
Cash Flow over Sales: |
-0,04 % |
0,00 % |
0,00 % |
0,06 % |
-0,08 % |
|
|
Net Financial Debt: |
0,00 |
-2,02 |
-2,36 |
-4,09 |
-1,96 |
|
|
Cash Flow Yield: |
-0,07 % |
0,00 % |
0,00 % |
0,09 % |
-0,12 % |
|
|
EBITDA over Sales: |
8,58 % |
4,19 % |
3,30 % |
2,17 % |
2,04 % |
|
|
Profitability |
2016 |
2015 |
2014 |
2013 |
2012 |
|
|
Operating economic profitability: |
13,14 % |
5,42 % |
4,99 % |
2,18 % |
1,98 % |
|
|
Total economic profitability: |
13,23 % |
5,42 % |
4,99 % |
2,16 % |
1,97 % |
|
|
Financial profitability: |
13,37 % |
4,93 % |
4,61 % |
2,17 % |
1,77 % |
|
|
Margin: |
7,75 % |
3,47 % |
2,80 % |
1,41 % |
1,36 % |
|
|
Mark-up: |
7,75 % |
3,47 % |
2,80 % |
1,41 % |
1,37 % |
|
|
Solvency |
2016 |
2015 |
2014 |
2013 |
2012 |
|
|
Liquidity: |
0,23 |
1,09 |
0,96 |
0,69 |
0,60 |
|
|
Acid Test: |
2,00 |
3,27 |
3,11 |
1,98 |
2,73 |
|
|
Working Capital / Investment: |
0,69 |
0,81 |
0,78 |
0,70 |
0,79 |
|
|
Solvency: |
3,76 |
6,25 |
5,22 |
3,78 |
5,76 |
|
|
Indebtedness |
2016 |
2015 |
2014 |
2013 |
2012 |
|
|
Indebtedness level: |
0,34 |
0,18 |
0,22 |
0,34 |
0,20 |
|
|
Borrowing Composition: |
0,00 |
0,00 |
0,00 |
0,00 |
0,00 |
|
|
Repayment Ability: |
1,73 |
2,37 |
3,12 |
7,50 |
5,58 |
|
|
Warranty: |
3,98 |
6,45 |
5,45 |
3,97 |
6,05 |
|
|
Generated resources / Total creditors:
|
0,46 |
0,35 |
0,27 |
0,11 |
0,15 |
|
|
Efficiency |
2016 |
2015 |
2014 |
2013 |
2012 |
|
|
Productivity: |
1,85 |
1,31 |
1,27 |
1,17 |
1,13 |
|
|
Turnover of Collection Rights : |
3,80 |
4,62 |
4,51 |
4,79 |
4,12 |
|
|
Turnover of Payment Entitlements: |
7,12 |
10,77 |
10,27 |
6,13 |
9,66 |
|
|
Stock rotation: |
3,54 |
3,26 |
4,46 |
3,37 |
2,86 |
|
|
Assets turnover: |
1,70 |
1,56 |
1,78 |
1,55 |
1,45 |
|
|
Borrowing Cost: |
0,00 |
0,00 |
0,00 |
0,00 |
0,00 |
|
COMPARATIVE
SECTORIAL BALANCE
Sector-based
Comparison under the rules of the New General Accounting Plan.
|
Net Rights Granted |
Variación - |
|
|
|
Empresa |
Sector |
|
Net Rights Granted |
Variación - |
|
|
|
Empresa |
Sector |
|
Net Rights Granted |
Variación - |
|
|
|
Empresa |
Sector |
News
|
la
verdad |
16/10/2017 |
|
López
Matencio prevé duplicar sus ventas de especias en dos años |
|
|
Companies
related |
|
|
Public
Tenders and Works Won |
No Public Tenders
assigned to the name of the company.
Research
Summary
|
The
subject was incorporated in December 1966, with a Shareholder Equity that
amounted to Euro 213,355 Processing of paprika and import of spices. |
Answer
to additional question
This is a
family Business that was incorporated in 1918 by the first generation.
Processing of paprika, in conjunction with growers. Marketing of spices, such
as seasonings for paella, pasta, herbs, etc. Import from Asia, Latin America
and European countries. Export to Austria and Sweden.
Sources
|
|
Registry
of Commerce's Official Gazette. Own and external data bases Company
References |
FOREIGN EXCHANGE RATES
|
Currency |
Unit
|
Indian Rupees |
|
US Dollar |
1 |
INR 66.71 |
|
|
1 |
INR 91.89 |
|
Euro |
1 |
INR 79.89 |
|
EURO |
1 |
INR 80.29 |
Note :
Above are approximate rates obtained from sources believed to be correct
INFORMATION DETAILS
|
Analysis Done by
: |
NIY |
|
|
|
|
Report Prepared
by : |
POJ |
RATING EXPLANATIONS
|
Credit Rating |
Explanation |
Rating Comments |
|
A++ |
Minimum Risk |
Business dealings permissible with minimum
risk of default |
|
A+ |
Low Risk |
Business dealings permissible with low
risk of default |
|
A |
Acceptable Risk |
Business dealings permissible with
moderate risk of default |
|
B |
Medium Risk |
Business dealings permissible on a regular
monitoring basis |
|
C |
Medium High Risk |
Business dealings permissible preferably
on secured basis |
|
D |
High Risk |
Business dealing not recommended or on
secured terms only |
|
NB |
New Business |
No recommendation can be done due to
business in infancy stage |
|
NT |
No Trace |
No recommendation can be done as the
business is not traceable |
NB is stated where there is insufficient information to facilitate rating. However, it is not to be considered as unfavourable.
This score serves as a reference to assess
SC’s credit risk and to set the amount of credit to be extended. It is
calculated from a composite of weighted scores obtained from each of the major
sections of this report. The assessed factors are as follows:
·
Financial
condition covering various ratios
·
Company
background and operations size
·
Promoters
/ Management background
·
Payment
record
·
Litigation
against the subject
·
Industry
scenario / competitor analysis
·
Supplier
/ Customer / Banker review (wherever available)
This report is issued at
your request without any risk and responsibility on the part of MIRA INFORM
PRIVATE LIMITED (MIPL) or its officials.