|
|
|


MIRA
INFORM REPORT
|
Report No. : |
508818 |
|
Report Date : |
21.05.2018 |
IDENTIFICATION DETAILS
|
Name : |
OLYMPIC OIL INDUSTRIES LIMITED |
|
|
|
|
Registered
Office : |
709, C Wing, One BKC, Near Indian Oil Petrol Pump, G Block, Bandra-Kurla Complex, Bandra (East), Mumbai - 400051, Maharashtra |
|
Tel. No.: |
91-22-26540901 |
|
|
|
|
Country : |
India |
|
|
|
|
Financials (as
on) : |
31.03.2017 |
|
|
|
|
Date of
Incorporation : |
29.07.1980 |
|
|
|
|
Com. Reg. No.: |
11-022912 |
|
|
|
|
Capital
Investment / Paid-up Capital : |
INR 28.540 Million |
|
|
|
|
CIN No.: [Company Identification
No.] |
L15141MH1980PLC022912 |
|
|
|
|
IEC No.: [Import-Export Code No.] |
Not Divulged |
|
|
|
|
GSTN : [Goods & Service Tax
Registration No.] |
Not Divulged |
|
|
|
|
TIN No.: |
Not Divulged |
|
|
|
|
TAN No.: [Tax Deduction &
Collection Account No.] |
Not Available |
|
|
|
|
PAN No.: [Permanent Account No.] |
Not Divulged |
|
|
|
|
Legal Form : |
A Public Limited Liability Company. The Company’s Shares are Listed on
the Stock Exchanges. |
|
|
|
|
Line of Business
: |
Trading
of Agri-Commodities, Mineral and Metals, Paper, Aluminum Foil, Laptops,
Computers, Invertors, Polymers and Coal etc. [Registered Activity] |
|
|
|
|
No. of Employees
: |
15 (Approximately) |
RATING & COMMENTS
(Mira Inform has adopted New Rating mechanism w.e.f. 23rd
January 2017)
|
MIRA’s Rating : |
A |
|
Credit Rating |
Explanation |
Rating Comments |
|
A |
Acceptable Risk |
Business dealings permissible with
moderate risk of default |
|
Maximum Credit Limit : |
USD 1046300 |
|
|
|
|
Status : |
Good |
|
|
|
|
Payment Behaviour : |
Regular |
|
|
|
|
Litigation : |
Clear |
|
|
|
|
Comments : |
Subject was incorporated in the year 1980 and it is a trader, exporter and importer of Rapeseed Meal, Yellow Peas Paper, Aluminium Foils and Agri Commodities. As per the financials of March 2017, the company has registered decline in its revenue as compared to its previous year’s revenue and has reported minimal profit margin of 0.47%. Rating takes into consideration the company’s established track record of business operations marked by sound net worth base along with strong debt coverage indicators and good liquidity position. Shares are quoted high Stock Exchanges. (Shares are traded at a price of INR 127.85 against its face value of INR 10.) As per unaudited financials of December 2017, the company has achieved a revenue of INR 4,030.95 million and has reported minimal profit margin of 0.13%. Payments seems to be regular. In view of aforesaid, the subject can be considered for business dealings at usual trade terms and conditions. |
NOTES :
Any query related to this report can be made
on e-mail : infodept@mirainform.com
while quoting report number, name and date.
ECGC Country Risk Classification List
|
Country Name |
Previous Rating (30.09.2017) |
Current Rating (31.12.2017) |
|
India |
A1 |
A1 |
|
Risk Category |
ECGC Classification |
|
Insignificant |
A1 |
|
Low Risk |
A2 |
|
Moderately Low Risk |
B1 |
|
Moderate Risk |
B2 |
|
Moderately High Risk |
C1 |
|
High Risk |
C2 |
|
Very High Risk |
D |
EXTERNAL AGENCY RATING
NOT AVAILABLE
RBI DEFAULTERS’ LIST STATUS
Subject’s name is not enlisted as a defaulter
in the publicly available RBI Defaulters’ list.
EPF (Employee Provident Fund) DEFAULTERS’ LIST STATUS
Subject’s name is not enlisted as a defaulter
in the publicly available EPF (Employee Provident Fund) Defaulters’ list as of
31-03-2018.
BIFR (Board for Industrial & Financial Reconstruction) LISTING
STATUS
Subject’s name is not listed as a Sick Unit in
the publicly available BIFR (Board for Industrial & Financial
Reconstruction) list as of 21.05.2018.
IBBI (Insolvency and Bankruptcy Board of India) LISTING STATUS
Subject’s name is not listed in the publicly
available IBBI (Insolvency and Bankruptcy Board of India) list as of report
date.
INFORMATION DECLINED BY
|
Name : |
Mr. Jitendra Pawar |
|
Designation : |
Export Executive |
|
Contact No.: |
91-9320670020 |
|
Date : |
12.05.2018 |
LOCATIONS
|
Registered Office : |
709, C Wing, One BKC, Near Indian Oil Petrol Pump, G Block, Bandra-Kurla Complex, Bandra (East), Mumbai - 400051, Maharashtra, India |
|
Tel. No.: |
91-22-26540901/ 42138333/ 42634444 |
|
Mobile No.: |
91-9320670020 [Mr. Jitendra Pawar] |
|
Fax No.: |
91-22-28240906 |
|
E-Mail : |
|
|
Website : |
|
|
|
|
|
Branch Offices : |
|
DIRECTORS
AS ON: 31.03.2018
|
Name : |
Mr. Arvind Srivastava |
|
Designation : |
Director |
|
Address : |
M-78B FF, Block –M, Malviya Nagar, Delhi – 110017, India |
|
Date of Appointment : |
24.09.2010 |
|
DIN No.: |
01957831 |
|
|
|
|
Name : |
Mr. Rakesh Dipakkumar Desai |
|
Designation : |
Additional Director |
|
Address : |
A-21 Vrundavan Society,Vip Road,Behind Bright School, Karelibaug, Vadodara- 390018, Gujarat, India |
|
Date of Appointment : |
10.11.2017 |
|
DIN No.: |
07960015 |
|
|
|
|
Name : |
Mr. Gopal Saxena |
|
Designation : |
Director |
|
Address : |
Hno.133 Chak Nan.111, Ashok Nagar, Anshik ''Ps'' Teh-Kanpur, Sadar, Kanpur Nagar – 208001, Uttar Pradesh, India |
|
Date of Appointment : |
12.08.2013 |
|
DIN No.: |
06656177 |
|
|
|
|
Name : |
Mrs. Sharad Bhartia |
|
Designation : |
Whole Time Director |
|
Address : |
7/190 A Swaroop Nagar , Kanpur – 208002, Uttar Pradesh, India |
|
Date of Birth/Age : |
35 Years |
|
Qualification : |
Bachelor of Business Management |
|
Brief
resume and Expertise in specific functional area : |
Hailing from a business
background, he took the plunge into his business as soon as he graduated.
Over the years he has gained tremendous experience and today Plastics &
Paper and Silk Yarn has become his forte. He has also ventured into the
corrugated and cardboard boxes manufacturing facilities and enjoys good
clientele. He is serving to the Company on whole time basis since 26th October, 2010. |
|
Date of Appointment : |
26.10.2010 |
|
DIN No.: |
01719932 |
|
|
|
|
Name : |
Mr. Nipun Verma |
|
Designation : |
Whole Time Director |
|
Address : |
3a/217, Azad Nagar, Kanpur – 208002, Uttar Pradesh, India |
|
Date of Appointment : |
01.11.2015 |
|
DIN No.: |
02923423 |
|
|
|
|
Name : |
Mrs. Poonam Singh |
|
Designation : |
Director |
|
Address : |
S-379, First Floor, Greater Kailash, Part – II, New Delhi – 110048, India |
|
Date of Birth/Age : |
56 Years |
|
Qualification : |
BA (Hons) |
|
Brief
resume and Expertise in specific functional area : |
Ms. Poonam has wide experience in Management and administration of business. |
|
Date of Appointment : |
28.09.2016 |
|
DIN No.: |
07099937 |
KEY EXECUTIVES
|
Name : |
Mr. Mahesh Madhav Kuwalekar |
|
Designation : |
Company Secretary |
|
Address : |
C-106, Surya Complex, Subhash Road, Dombivli (West), Thane - 421202 , Maharashtra, India |
|
Date of Appointment : |
30.05.2014 |
|
PAN No.: |
AXWPK4306N |
|
|
|
|
Name : |
Mr. Manoj Kumar Upadhyay |
|
Designation : |
Chief Financial Officer |
|
Address : |
Plot No. 66-A, Greater Kailash, Tiwaripur, Jajmau, Kanpur – 208010, Uttar Pradesh, India |
|
Date of Appointment : |
01.06.2017 |
|
PAN No.: |
AAPPU2464B |
|
|
|
|
Name : |
Mr. Jitendra Pawar |
|
Designation : |
Export Executive |
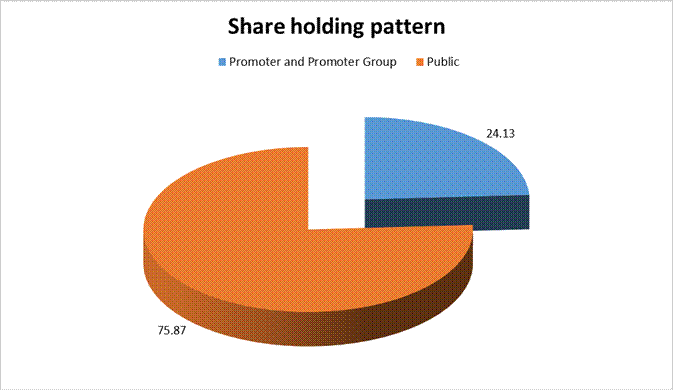
MAJOR SHAREHOLDERS / SHAREHOLDING PATTERN
AS ON 31.03.2018
|
Category of Shareholder |
Total No. of Shares |
As a % |
|
(A) Promoter and Promoter Group |
688660 |
24.13 |
|
(B) Public |
2165340 |
75.87 |
|
|
|
|
|
Grand Total |
2854000 |
100.00 |
Statement showing
shareholding pattern of the Promoter and Promoter Group
|
Category of
shareholder |
No. of fully paid
up equity shares held |
Shareholding as a %
of total no. of shares (calculated as per SCRR, 1957)As a % of (A+B+C2) |
|
|
A1) Indian |
0.00 |
|
|
|
Individuals/Hindu undivided Family |
6,88,660 |
24.13 |
|
|
NILIMA U DESAI |
36,100 |
1.26 |
|
|
SUJAY U DESAI |
1,10,700 |
3.88 |
|
|
UDAY JAYANT DESAI |
1,91,640 |
6.71 |
|
|
SUNIL VERMA |
3,50,220 |
12.27 |
|
|
Sub Total A1 |
6,88,660 |
24.13 |
|
|
A2) Foreign |
0.00 |
|
|
|
A=A1+A2 |
6,88,660 |
24.13 |
|
Statement showing
shareholding pattern of the Public shareholder
|
Category & Name
of the Shareholders |
No. of fully paid
up equity shares held |
Shareholding %
calculated as per SCRR, 1957 As a % of (A+B+C2) |
|
|
|||
|
|||
|
|||
|
B1) Institutions |
0 |
0.00 |
|
|
B2) Central Government/ State
Government(s)/ President of India |
0 |
0.00 |
|
|
B3) Non-Institutions |
0 |
0.00 |
|
|
Individual share capital upto INR 0.200
Million |
226523 |
7.94 |
|
|
Individual share capital in excess of INR
0.200 Million |
1529635 |
53.60 |
|
|
ADITI MALVIYA . |
30000 |
1.05 |
|
|
ASHISH AGARWAL |
30000 |
1.05 |
|
|
MANISH AGARWAL |
30000 |
1.05 |
|
|
MINI SINGH |
30000 |
1.05 |
|
|
AMIT KUMAR AGARWAL HUF |
30000 |
1.05 |
|
|
ALKA BAJPAI |
30900 |
1.08 |
|
|
JEETENDRA SINGH |
34650 |
1.21 |
|
|
NITIN KUMAR VERMA |
45000 |
1.58 |
|
|
SACHIN KUMAR VERMA |
46000 |
1.61 |
|
|
SURESH PANDYA |
50000 |
1.75 |
|
|
RAJENDRA PRASAD YADAV |
50000 |
1.75 |
|
|
RAKESH KUMAR |
50000 |
1.75 |
|
|
YAMINI TRIVEDI |
56000 |
1.96 |
|
|
MADHU AGARWAL |
60000 |
2.10 |
|
|
NIRAJ JITENDRA KUMAR KAMODIA |
60000 |
2.10 |
|
|
SAURABH VERMA |
60000 |
2.10 |
|
|
TEENA AGARWAL |
60000 |
2.10 |
|
|
ANITA TIBREWALA |
62550 |
2.19 |
|
|
RASHMI TIWARI |
68000 |
2.38 |
|
|
AJAY MEHROTRA |
69000 |
2.42 |
|
|
NAGENDRA SHUKLA . |
70000 |
2.45 |
|
|
ATUL KUMAR TRIVEDI |
73600 |
2.58 |
|
|
RAM PRAKASH MISHRA |
78760 |
2.76 |
|
|
HEMANT RASIKLAL KAMODIA |
80000 |
2.80 |
|
|
RAMESH VISHWAKARMA |
80000 |
2.80 |
|
|
VINEET KUMAR PANDEY |
80198 |
2.81 |
|
|
AJAY V VERMA |
89977 |
3.15 |
|
|
Any Other (specify) |
409182 |
14.34 |
|
|
Non-Resident Indian (NRI) |
253 |
0.01 |
|
|
Clearing Members |
1108 |
0.04 |
|
|
UNIQUE SPINNER MARKETING PRIVATE LI |
29800 |
1.04 |
|
|
J.U.D.TRADING PRIVATE LIMITED |
140000 |
4.91 |
|
|
NEXTGEN ENTERTAINMENT PRIVATE LIMIT |
140000 |
4.91 |
|
|
Bodies Corporate |
311221 |
10.90 |
|
|
ARVIND SRIVASTAVA |
50000 |
1.75 |
|
|
Gopal Saxena |
46600 |
1.63 |
|
|
Sub Total B3 |
2165340 |
75.87 |
|
|
B=B1+B2+B3 |
2165340 |
75.87 |
|
BUSINESS DETAILS
|
Line of Business : |
Trading
of Agri-Commodities, Mineral and Metals, Paper, Aluminum Foil, Laptops,
Computers, Invertors, Polymers and Coal etc. [Registered Activity] |
|
|
|
|
Brand Names : |
Not Available |
|
|
|
|
Agencies Held : |
Not Available |
|
|
|
|
Exports : |
Not Divulged |
|
|
|
|
Imports : |
Not Divulged |
|
|
|
|
Terms : |
|
|
Selling : |
Not Divulged |
|
|
|
|
Purchasing : |
Not Divulged |
PRODUCTION STATUS: (NOT AVAILABLE)
GENERAL INFORMATION
|
Suppliers : |
|
|||||||||||||||
|
|
|
|||||||||||||||
|
Customers : |
|
|||||||||||||||
|
|
|
|||||||||||||||
|
No. of Employees : |
15 (Approximately) |
|||||||||||||||
|
|
|
|||||||||||||||
|
Bankers : |
· Bank of India ·
Allahabad Bank · Oriental Bank of Commerce · Bank of Baroda · State Bank of India · Indian Overseas Bank · ICICI Bank Limited |
|||||||||||||||
|
|
|
|||||||||||||||
|
Facilities : |
|
|
|
|
|
Auditors : |
|
|
Name : |
Shankarlal Jain and Associates LLP Chartered Accountants |
|
Address : |
12, Engineer Building, 265 Princess Street, Mumbai – 400002, Maharashtra, India |
|
|
|
|
Memberships : |
Not Available |
|
|
|
|
Collaborators : |
Not Available |
|
|
|
|
Enterprise over which Key Management
Personnel, Substantial Shareholders or Their relatives exercise significant
influence : |
· Frost International Limited · Frost Infrastructure and Energy Limited · Bhartia Commercial Co. · Globiz Exim Private Limited · Frost Global Pte. Limited |
CAPITAL STRUCTURE
AS ON: 31.03.2017
Authorised Capital :
|
No. of Shares |
Type |
Value |
Amount |
|
|
|
|
|
|
4000000 |
Equity Shares |
INR 10/- each |
INR 40.000 Million |
|
200 |
11% Redeemable Cum. Preference Shares |
INR 100/- each |
INR 0.020 Million |
|
|
Total |
|
INR 40.020
Million |
Issued, Subscribed & Paid-up Capital :
|
No. of Shares |
Type |
Value |
Amount |
|
|
|
|
|
|
2854000 |
Equity Shares |
INR 10/- each |
INR 28.540 Million |
|
|
|
|
|
Reconciliation of the number of Shares Outstanding
and the amount of Share Capital as at 31st March
|
Equity Shares |
Number
of Shares |
|
Number of Shares and Share Capital at the beginning |
2854000 |
|
Add : Shares issued during the year |
-- |
|
Number of Shares at the end |
2854000 |
|
|
|
|
Share Capital at the beginning of the year |
2854000 |
Terms/Rights
attached to equity shares
The
Company has only one class of equity shares having a face value of INR 10/- per
share. Each shareholder is entitled to one vote per share.
Following are the
Share holders holding more than 5% of Equity Shares :
|
Particulars |
No. of shares |
|
Mr. Sunil Verma |
350220 |
|
Mr. Uday Desai |
191640 |
Aggregate number of
bonus shares issued during the period of 5 years immediately preceding
reporting date is 2140500 equity shares
FINANCIAL DATA
[all figures are
in INR Million]
ABRIDGED
BALANCE SHEET
|
SOURCES OF FUNDS |
31.03.2017 |
31.03.2016 |
31.03.2015 |
|
I.
EQUITY AND LIABILITIES |
|
|
|
|
(1)Shareholders' Funds |
|
|
|
|
(a) Share Capital |
28.540 |
28.540 |
28.540 |
|
(b) Reserves & Surplus |
337.682 |
280.521 |
194.612 |
|
(c) Money received against share warrants |
0.000 |
0.000 |
0.000 |
|
|
|
|
|
|
(2) Share
Application money pending allotment |
0.000 |
0.000 |
0.000 |
|
Total
Shareholders’ Funds (1) + (2) |
366.222 |
309.061 |
223.152 |
|
|
|
|
|
|
(3)
Non-Current Liabilities |
|
|
|
|
(a) Long-term borrowings |
0.000 |
0.000 |
0.000 |
|
(b) Deferred tax liabilities (Net) |
0.000 |
0.000 |
0.000 |
|
(c)
Other long term liabilities |
0.000 |
0.000 |
0.000 |
|
(d)
long-term provisions |
1.112 |
1.077 |
0.705 |
|
Total
Non-current Liabilities (3) |
1.112 |
1.077 |
0.705 |
|
|
|
|
|
|
(4) Current Liabilities |
|
|
|
|
(a)
Short term borrowings |
0.000 |
6.043 |
65.864 |
|
(b)
Trade payables |
7860.613 |
10122.321 |
9430.173 |
|
(c)
Other current liabilities |
906.994 |
1992.505 |
2.134 |
|
(d)
Short-term provisions |
0.044 |
0.006 |
1313.324 |
|
Total
Current Liabilities (4) |
8767.651 |
12120.875 |
10811.495 |
|
|
|
|
|
|
TOTAL |
9134.985 |
12431.013 |
11035.352 |
|
|
|
|
|
|
II.
ASSETS |
|
|
|
|
(1) Non-current assets |
|
|
|
|
(a)
Fixed Assets |
|
|
|
|
(i)
Tangible assets |
4.603 |
7.125 |
10.470 |
|
(ii)
Intangible Assets |
0.000 |
0.000 |
0.000 |
|
(iii)
Capital work-in-progress |
0.000 |
0.000 |
0.000 |
|
(iv) Intangible assets under development |
0.000 |
0.000 |
0.000 |
|
(b) Non-current
Investments |
41.000 |
41.000 |
41.000 |
|
(c) Deferred tax assets
(net) |
2.014 |
1.240 |
0.671 |
|
(d) Long-term Loan
and Advances |
0.000 |
0.000 |
0.000 |
|
(e)
Other Non-current assets |
0.000 |
0.000 |
0.000 |
|
Total
Non-Current Assets |
47.617 |
49.365 |
52.141 |
|
|
|
|
|
|
(2) Current assets |
|
|
|
|
(a)
Current investments |
0.000 |
0.000 |
0.000 |
|
(b)
Inventories |
2.448 |
3.213 |
9.406 |
|
(c)
Trade receivables |
2775.130 |
2065.348 |
2835.291 |
|
(d)
Cash and cash equivalents |
5350.843 |
9139.957 |
7540.185 |
|
(e)
Short-term loans and advances |
886.527 |
1020.636 |
441.451 |
|
(f)
Other current assets |
72.420 |
152.494 |
156.878 |
|
Total
Current Assets |
9087.368 |
12381.648 |
10983.211 |
|
|
|
|
|
|
TOTAL |
9134.985 |
12431.013 |
11035.352 |
PROFIT
& LOSS ACCOUNT
|
|
PARTICULARS |
31.03.2017 |
31.03.2016 |
31.03.2015 |
|
|
|
SALES |
|
|
|
|
|
|
|
Revenue from Operations |
12110.768 |
19764.045 |
18778.841 |
|
|
|
Other Income |
125.534 |
56.607 |
14.134 |
|
|
|
TOTAL |
12236.302 |
19820.652 |
18792.975 |
|
|
|
|
|
|
|
|
Less |
EXPENSES |
|
|
|
|
|
|
|
Cost of Materials Consumed |
0.000 |
5.262 |
53.269 |
|
|
|
Purchases of Stock-in-Trade |
12075.313 |
19516.423 |
18285.757 |
|
|
|
Changes in inventories of Stock-in-Trade |
0.765 |
0.933 |
41.262 |
|
|
|
Employees benefits expense |
8.004 |
8.741 |
9.232 |
|
|
|
Administrative and Other expenses |
24.752 |
49.179 |
167.230 |
|
|
|
Manufacturing Expenses |
0.000 |
0.000 |
21.126 |
|
|
|
Extraordinary Items |
0.000 |
0.008 |
0.028 |
|
|
|
TOTAL |
12108.834 |
19580.546 |
18577.904 |
|
|
|
|
|
|
|
|
|
PROFIT
BEFORE INTEREST, TAX, DEPRECIATION AND AMORTISATION |
127.468 |
240.106 |
215.071 |
|
|
|
|
|
|
|
|
|
Less |
FINANCIAL
EXPENSES |
34.929 |
106.831 |
72.659 |
|
|
|
|
|
|
|
|
|
|
PROFIT/
(LOSS) BEFORE TAX, DEPRECIATION AND AMORTISATION |
92.539 |
133.275 |
142.412 |
|
|
|
|
|
|
|
|
|
Less/ Add |
DEPRECIATION/
AMORTISATION |
2.203 |
3.362 |
2.663 |
|
|
|
|
|
|
|
|
|
|
PROFIT/ (LOSS) BEFORE
TAX |
90.336 |
129.913 |
139.749 |
|
|
|
|
|
|
|
|
|
Less |
TAX |
33.175 |
44.005 |
47.323 |
|
|
|
|
|
|
|
|
|
|
PROFIT/ (LOSS) AFTER
TAX |
57.161 |
85.908 |
92.426 |
|
|
|
|
|
|
|
|
|
|
EARNINGS IN
FOREIGN CURRENCY |
|
|
|
|
|
|
|
Export realization and advances received against sales |
9994.388 |
16133.874 |
NA |
|
|
TOTAL EARNINGS |
9994.388 |
16133.874 |
NA |
|
|
|
|
|
|
|
|
|
|
Earnings/ (Loss)
Per Share (INR) |
20.03 |
30.10 |
32.38 |
|
CURRENT MATURITIES OF LONG TERM DEBT DETAILS
|
PARTICULARS |
31.03.2017 |
31.03.2016 |
31.03.2015 |
|
Current Maturities of Long term debt |
NA |
NA |
NA |
|
|
|
|
|
|
Cash generated from Operating Activities |
(3818.870) |
1791.585 |
1201.706 |
|
|
|
|
|
|
Net Cash generated from Operating Activities |
(3800.482) |
1747.013 |
1153.974 |
KEY
RATIOS
EFFICIENCY RATIOS
|
PARTICULARS |
31.03.2017 |
31.03.2016 |
31.03.2015 |
|
Average Collection Days (Sundry
Debtors / Income * 365 Days) |
83.64 |
38.14 |
55.11 |
|
|
|
|
|
|
Account Receivables Turnover (Income / Sundry Debtors) |
4.36 |
9.57 |
6.62 |
|
|
|
|
|
|
Average Payment Days (Sundry Creditors / Purchases * 365 Days) |
237.60 |
189.26 |
187.69 |
|
|
|
|
|
|
Inventory Turnover (Operating Income / Inventories) |
52.07 |
74.73 |
22.87 |
|
|
|
|
|
|
Asset Turnover (Operating Income / Net Fixed Assets) |
27.69 |
33.70 |
20.54 |
LEVERAGE RATIOS
|
PARTICULARS |
31.03.2017 |
31.03.2016 |
31.03.2015 |
|
Debt Ratio ((Borrowing
+ Current Liabilities) / Total Assets) |
0.96 |
0.98 |
0.98 |
|
|
|
|
|
|
Debt Equity Ratio (Total Liability / Networth) |
0.00 |
0.02 |
0.30 |
|
|
|
|
|
|
Current Liabilities to Networth (Current Liabilities / Net Worth) |
23.94 |
39.22 |
48.45 |
|
|
|
|
|
|
Fixed Assets to Networth (Net Fixed Assets / Networth) |
0.01 |
0.02 |
0.05 |
|
|
|
|
|
|
Interest Coverage Ratio (PBIT / Financial Charges) |
3.65 |
2.25 |
2.96 |
PROFITABILITY RATIOS
|
PARTICULARS |
|
31.03.2017 |
31.03.2016 |
31.03.2015 |
|
Net Profit Margin ((PAT / Sales) * 100) |
% |
0.47 |
0.43 |
0.49 |
|
|
|
|
|
|
|
Return on Total Assets ((PAT / Total Assets) * 100) |
% |
0.63 |
0.69 |
0.84 |
|
|
|
|
|
|
|
Return on Investment (ROI) ((PAT / Networth) * 100) |
% |
15.61 |
27.80 |
41.42 |
SOLVENCY RATIOS
|
PARTICULARS |
31.03.2017 |
31.03.2016 |
31.03.2015 |
|
Current Ratio (Current
Assets / Current Liabilities) |
1.04 |
1.02 |
1.02 |
|
|
|
|
|
|
Quick Ratio ((Current Assets – Inventories) / Current
Liabilities) |
1.04 |
1.02 |
1.02 |
|
|
|
|
|
|
G-Score Ratio Financial (Networth / Total Assets) |
0.04 |
0.02 |
0.02 |
|
|
|
|
|
|
G-Score Ratio Debt (Debts / Equity Capital) |
0.00 |
0.21 |
2.31 |
|
|
|
|
|
|
G-Score Ratio Liquidity (Total Current Assets / Total Current Liabilities) |
1.04 |
1.02 |
1.02 |
Total
Liability = Short-term Debt + Long-term Debt + Current Maturities of Long-term
debts
STOCK
PRICES
|
Face Value |
INR 10.00/- |
|
|
|
|
Market Value |
INR 127.85/- |
FINANCIAL ANALYSIS
[all figures are in
INR Million]
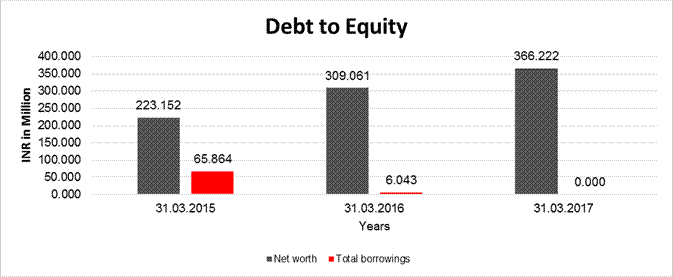
DEBT EQUITY RATIO
|
Particular |
31.03.2015 |
31.03.2016 |
31.03.2017 |
|
|
INR
In Million |
INR
In Million |
INR
In Million |
|
Share Capital |
28.540 |
28.540 |
28.540 |
|
Reserves & Surplus |
194.612 |
280.521 |
337.682 |
|
Money received against share
warrants |
0.000 |
0.000 |
0.000 |
|
Share Application money
pending allotment |
0.000 |
0.000 |
0.000 |
|
Net
worth |
223.152 |
309.061 |
366.222 |
|
|
|
|
|
|
long-term borrowings |
0.000 |
0.000 |
0.000 |
|
Short term borrowings |
65.864 |
6.043 |
0.000 |
|
Total
borrowings |
65.864 |
6.043 |
0.000 |
|
Debt/Equity
ratio |
0.295 |
0.020 |
0.000 |
YEAR-ON-YEAR GROWTH
|
Year
on Year Growth |
31.03.2015 |
31.03.2016 |
31.03.2017 |
|
|
INR
In Million |
INR
In Million |
INR
In Million |
|
Sales |
18778.841 |
19764.045 |
12110.768 |
|
|
|
5.246 |
-38.723 |
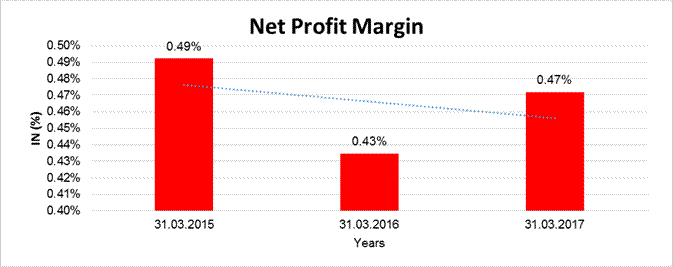
NET PROFIT MARGIN
|
Net
Profit Margin |
31.03.2015 |
31.03.2016 |
31.03.2017 |
|
|
INR
In Million |
INR
In Million |
INR
In Million |
|
Sales |
18778.841 |
19764.045 |
12110.768 |
|
Profit |
92.426 |
85.908 |
57.161 |
|
|
0.49% |
0.43% |
0.47% |
LOCAL AGENCY FURTHER INFORMATION
|
Sr. No. |
Check list by
info agents |
Available in
Report (Yes/No) |
|
1 |
Year of establishment |
Yes |
|
2 |
Constitution of the entity -Incorporation
details |
Yes |
|
3 |
Locality of the entity |
Yes |
|
4 |
Premises details |
No |
|
5 |
Buyer visit details |
-- |
|
6 |
Contact numbers |
Yes |
|
7 |
Name of the person contacted |
Yes |
|
8 |
Designation of contact person |
Yes |
|
9 |
Promoter’s background |
Yes |
|
10 |
Date of Birth of Proprietor / Partners /
Directors |
Yes |
|
11 |
Pan Card No. of Proprietor / Partners |
No |
|
12 |
Voter Id Card No. of Proprietor / Partners |
No |
|
13 |
Type of business |
Yes |
|
14 |
Line of Business |
Yes |
|
15 |
Export/import details (if applicable) |
No |
|
16 |
No. of employees |
No |
|
17 |
Details of sister concerns |
Yes |
|
18 |
Major suppliers |
No |
|
19 |
Major customers |
No |
|
20 |
Banking Details |
Yes |
|
21 |
Banking facility details |
Yes |
|
22 |
Conduct of the banking account |
-- |
|
23 |
Financials, if provided |
Yes |
|
24 |
Capital in the business |
Yes |
|
25 |
Last accounts filed at ROC, if applicable |
Yes |
|
26 |
Turnover of firm for last three years |
Yes |
|
27 |
Reasons for variation <> 20% |
-- |
|
28 |
Estimation for coming financial year |
No |
|
29 |
Profitability for last three years |
Yes |
|
30 |
Major shareholders, if available |
Yes |
|
31 |
External Agency Rating, if available |
No |
|
32 |
Litigations that the firm/promoter
involved in |
-- |
|
33 |
Market information |
-- |
|
34 |
Payments terms |
No |
|
35 |
Negative Reporting by Auditors in the
Annual Report |
No |
INDEX OF CHARGES
|
SNO |
SRN |
CHARGE ID |
CHARGE HOLDER NAME |
DATE OF CREATION |
DATE OF MODIFICATION |
DATE OF SATISFACTION |
AMOUNT |
ADDRESS |
|
1 |
G17929324 |
100056670 |
Indian Overseas Bank |
06/10/2016 |
- |
- |
2350000000.0 |
GARG NARONHA COMPLEX17/9THE MALLKANPURUP208001IN |
|
2 |
B93580132 |
10415817 |
Oriental Bank Of Commerce |
13/03/2013 |
24/12/2013 |
- |
2500000000.0 |
Large corporate branchE-Block, Harsha Bhawan, Connaught placeNew DelhiDL110001IN |
|
3 |
Y10345449 |
90237812 |
THE UNITED WESTERN BANK LTD |
06/05/1980 |
- |
- |
2000000.0 |
HEAD OFFICE 172/4; RAVIWAR PETHJALGAONMHIN |
COMPANY OVERVIEW:
Olympic Oil Industries
Limited (‘OOIL’ or ‘The Company’) is a BSE listed, public limited company
incorporated and domiciled in India and has its registered office at Mumbai,
Maharashtra, India.
The company is engaged in
trading of Agri-Commodities, Mineral & Metals, Paper, Aluminum Foil,
Laptops, Computers, Invertors, Polymers and Coal etc.
STATE
OF COMPANY’S AFFAIRS
During the year the
Company’s sales is INR 11809.132 Million as against to INR 19093.507 Million in
the previous financial year 2015-2016 showing a decrease of 38.15%. The
Company, however looks forward to further strengthen its operations by
consistently focusing on embarking its profit for the coming years.
• Revenue of Business
segments is as follows:
Ø Sale of Equipments has
decreased by 33.47% from INR 12828.923 Million in Financial Year 2015-16 to INR
8533.883 Million in Financial Year 2016-17.
Ø Sale of Agri Products has
decreased by 2.85% from INR 3129.514 Million in Financial Year 2015-16 to INR 3040.274
Million in Financial Year 2016-17.
Ø Sale of Minerals &
Metals has decreased by 92.91 % from INR 3128.979 Million in Financial Year
2015-16 to
INR 221.903 Million akhs in
Financial Year 2016-17.
Ø Sale of paper products
has increased by 443.57 % from INR 2.947 Million in Financial Year 2015-16 to INR
13.072 Million in Financial Year 2016-17.
• Profit before interest,
depreciation, extra ordinary items and tax in 2016-17 has decreased by 40.61%
to INR 93.233 Million from INR 157.008 Million as compared with the previous
financial year 2015-2016.
• After providing for
interest of INR 0.695 Million (INR 23.726 Million in previous fiscal year) and
depreciation of INR 2.202 Million (INR 3.362 Million in previous fiscal year),
the profit after tax of the Company has decreased by 33.46% from INR 85.908
Million in FY 2015-16 to INR 57.161 Million in FY 2016-17.
MANAGEMENT
DISCUSSION AND ANALYSIS
ECONOMIC REVIEW
India has emerged as the
fastest growing major economy in the world as per the Central Statistics Organisation
(CSO) and International Monetary Fund (IMF). According to IMF, India’s growth
is expected to rebound to 7.2 percent in 2017-18 and further to 7.7 percent in 2018-19
after the ‘’temporary disruption ‘’ caused by cash shortages accompanying the
Currency exchange initiative are expected to gradually dissipate in 2017 as
cash shortages ease.Such disruptions would also be offset by tailwind from
favorable monsoon season and continued progress in resolving supply-side
bottleneck.According to IMF the investment recovery is expected to remain
modest and uneven across sector as de-leveraging take place and industrial
capacity utilisation pick up.While Central Statistics Organisation (CSO) has
estimated India’s growth at 7.1 percent this fiscal, IMF are predicted it to
decelerate to 6.8 percent due to demonetization.
INDUSTRY STRUCTURE AND
DEVELOPMENT
AGRICULTURE INDUSTRY
Agriculture plays a vital
role in India’s economy. Over 58 per cent of the rural households depend on
agriculture as their principal means of livelihood. Agriculture, along with
fisheries and forestry, is one of the largest contributors to the Gross
Domestic Product (GDP). Indian agriculture is benefitting huge from rising
external demand and the sector’s wider participation in the global economy.
As per estimates by the
Central Statistics Office (CSO), the share of agriculture and allied sectors
(including agriculture, livestock, forestry and fishery) is expected to be 17.3
per cent of the Gross Value Added (GVA) during 2016 -17 at 2011–12 prices.
India is the largest
producer, consumer and exporter of spices and spice products. India’s fruit
production has grown faster than vegetables making it the second largest fruit
producer in the world. India’s horticulture output, comprising fruits,
vegetables and spices,has reached to a record high of 287.3 million tonnes (MT)
in 2016-17. It ranks third in farm and agriculture outputs. Agricultural export
constitutes 10 per cent of the country’s exports and is the fourth-largest exported
principal commodity. The agro industry in India is divided into several sub
segments such as canned, dairy, processed, frozen food to fisheries, meat,
poultry, and food grains.
MARKET SIZE
Over the recent past,
multiple factors have worked together to facilitate growth in the agriculture
sector in India. These includes growth in household income and consumption,
expansion in the food processing sector and increase in agricultural exports.
Rising private participation in Indian agriculture, growing organic farming and
use of information technology are some of the key trends in the agriculture
industry.
India’s GDP is expected to
grow at 7.1 percent in financial 2016-17, led by growth in private consumption,
while Agriculture GDP is expected to grow above-trend at 4.1 percent to INR 1.11
trillion$ (US$ 1,640 billion). India’s food grain production is expected to be 271.98
MT in 2016-17. Production of pluses is estimated at 22.14 MT.India Export of
basmati rice may rise to INR 22,000-22,500 crore (US$ 3.42-3.49 billion) with
volume to around 4.09 MT in 2017-18.Wheat production in India is expected to
touch all time high of 96.6 MT during financial year 2016-17.Groundnut export
from India is expected to cross 700,000 tones during FY 2016-17 as compared to 537,888
tones in FY 2015-16, owing to expected 70 percent increase in crop size due to
good monsoon and higher demand due to competitor such Chile shifting focus on
US Market.Spices export from India grew by 9 per cent in volume and 5 per cent
in value yearon- year to 660,975tones.
INVESTMENTS
Several players have
invested in the agricultural sector in India, mainly driven by the government’s
initiatives and schemes.According to the Department of Industrial Policy and
Promotion (DIPP), the Indian agricultural services and agricultural machinery
sectors have cumulatively attracted Foreign Direct Investment (FDI) equity
inflow of about US$ 2,315.33 million from April 2000 to December 2016.
ROAD AHEAD
The agriculture sector in
India is expected to generate better momentum in the next few years due to
increased investments in agricultural infrastructure such as irrigation
facilities, warehousing and cold storage. Factors such as reduced transaction
costs and time, improved port gate management and better fiscal incentives
would contribute to the sector’s growth. Furthermore, the growing use of
genetically modified crops will likely improve the yield for Indian farmers.
National Institution for
Transforming India Aayog (NITI Aayog), has proposed various reform in India’s
agriculture sector, Including liberal Contract farming, direct purchase from
farmer by private player direct sale by farmer to consumer, and single trader
license, among other measure, in order to double rural income in next five
year.The Maharashtra State Agriculture Marketing Board(MSAMB) has
operationalized 31 farmers to consumer market in the state, and plan to open
100 more such market in the futurewhichwould facilitate better financial
remunerations for the farmers by allowing them to directly sell their produce
in open markets.India is expected to be self-sufficient in pulses in the coming
few years due to concerted efforts of scientists to get early-maturing
varieties of pulses and the increase in minimum support price.
OUTLOOK
The Indian economy followed
a path of recovery registering growth in the first three quarter of the year
2016. The prospect for economic growth become buoyant with the agrarian and
rural economy benefiting from a good monsoon after two successive raindeficient
years. The growth was affected in last two month of the year by impact of
demonetization scheme. The calendar year is expected to end with GDP growth
estimated at around 7.0% 2016 closed as a momentous year for the country marked
by two landmark economic scenario was in different. The First is the Goods and
Service Tax (GST) a single tax intended to replace the existing central and
state indirect taxes, which wascame in force w.e.f. 01st July, 2017.
The second reform was the
rollout of the demonetization scheme in early November. In the long run, this
reform aim to usher in greater transparency in financial transactions and
transition toward cash less economy. The public debate on demonetization has
raised three question. first broader aspect of management, as reflected in
design and implementation of the initiative. Second its economic impact in
short and long run. And third its implication.
STANDALONE
UNAUDITED FINANCIAL RESULTS FOR THE QUARTER AND NINE MONTHS ENDED 31.12.2017
(INR. IN MILLION)
|
Particulars |
Quarter ended |
Nine months ended |
|
|
|
31.12.2017 |
30.09.2017 |
31.12.2017 |
|
|
Unaudited |
Unaudited |
Unaudited |
|
Income
|
|
|
|
|
a)
Net Sales/Income from Operations |
4030.951 |
2504.433 |
10109.450 |
|
b)
Other Income |
3.081 |
0.872 |
3.992 |
|
Total income |
4034.032 |
2505.305 |
10113.442 |
|
|
|
|
|
|
Expenses |
|
|
|
|
a)
Cost of materials consumed |
--- |
--- |
---- |
|
b)
Purchase of traded goods |
3987.767 |
2478.863 |
9996.380 |
|
c)
Changes in inventories |
--- |
1.683 |
2.448 |
|
d)
Employee benefits expense |
2.105 |
1.793 |
5.580 |
|
e)
Finance Costs |
29.379 |
10.149 |
51.019 |
|
f)
Depreciation and amortisation expense |
0.550 |
0.470 |
1.652 |
|
g)
Other expenses |
6.613 |
0.934 |
11.243 |
|
Total Expenses |
4026.414 |
2493.892 |
10068.322 |
|
|
|
|
|
|
Profit from operations
but before exceptional Items |
7.618 |
11.413 |
45.120 |
|
Exceptional
Items |
--- |
--- |
---- |
|
Profit from ordinary
activities before tax |
7.618 |
11.413 |
45.120 |
|
Tax
expense (including Current tax, Deferred tax and Earlier year adjustments) |
2.525 |
3.775 |
14.900 |
|
Net Profit/ (Loss) after
tax |
5.093 |
7.638 |
30.220 |
|
Paid - up Equity Share Capital (Face value of INR 10/- per share) |
28.540 |
28.540 |
28.540 |
|
Reserves excluding Revaluation Reserves |
--- |
--- |
---- |
|
Earnings Per Share (EPS) (not
annualised) |
|
|
|
|
a) Basic |
1.78 |
2.68 |
10.59 |
|
b) Diluted |
1.78 |
2.68 |
10.59 |
Notes:
1. The above Financial Results for the quarter and Nine months ended December 31, 2017 have been reviewed by the Audit Committee and approved and taken on record by the Board of Directors at its meeting held on February 14, 2017. The Financial results are in accordance with the Indian Accounting Standards (IND AS) as prescribed under Section 133 of the Companies Act, 2013 read with rule 3 of the Companies (Indian Accounting Standards) Rules, 2015 and Companies (Indian Accounting Standards) (Amendment Rules) 2016.
2. The Statement does not include AS Compliant Results for the Previous year
ended on March 31, 2017 as the same are not mandatory as per SEBl's circular
dated July 5, 2016.
3. As the Company has only one business segment, disclosure under IND AS 108 on
“Operating Segment" is not applicable.
4. The effect of foreign exchange fluctuation (IND AS - 21) has not been
recognised as at 31.12.2017 and shall be recognised as at the year ending on
31.03.2018.
5. Reconciliation of Net Profit reported under IGAAP to IND AS is as follow:
|
Particulars |
Quarter ended |
Nine months ended |
|
|
31.12.2016 |
31.12.2016 |
|
|
Unaudited |
Unaudited |
|
Profit after tax as per previous IGAAP |
3.900 |
55.349 |
|
Net Profit as per IND AS |
3.900 |
55.349 |
|
Total Comprehensive Income as per IND AS |
--- |
--- |
6. Figures of the previous period have been Re-classified/re-arranged/regrouped
wherever necessary to make them comparable with figures of the Current period
ended December 31, 2017.
FIXED ASSETS:
Tangible Assets
· Computer
· Office Equipment
· Furniture and Fixtures
· Vehicle
· Two Wheelers
CMT REPORT (Corruption, Money Laundering & Terrorism]
The Public Notice information has been collected from various sources
including but not limited to: The Courts, India Prisons Service,
Interpol, etc.
1] INFORMATION ON
DESIGNATED PARTY
No records exist designating subject or any of its beneficial owners,
controlling shareholders or senior officers as terrorist or terrorist
organization or whom notice had been received that all financial transactions
involving their assets have been blocked or convicted, found guilty or against
whom a judgement or order had been entered in a proceedings for violating
money-laundering, anti-corruption or bribery or international economic or
anti-terrorism sanction laws or whose assets were seized, blocked, frozen or
ordered forfeited for violation of money laundering or international
anti-terrorism laws.
2] Court Declaration :
No records exist to suggest that subject is
or was the subject of any formal or informal allegations, prosecutions or other
official proceeding for making any prohibited payments or other improper
payments to government officials for engaging in prohibited transactions or
with designated parties.
3] Asset Declaration :
No records exist to suggest that the property or assets of the subject
are derived from criminal conduct or a prohibited transaction.
4] Record on Financial
Crime :
Charges or conviction
registered against subject: None
5] Records on Violation of
Anti-Corruption Laws :
Charges or
investigation registered against subject: None
6] Records on Int’l
Anti-Money Laundering Laws/Standards :
Charges or
investigation registered against subject: None
7] Criminal Records
No
available information exist that suggest that subject or any of its principals
have been formally charged or convicted by a competent governmental authority
for any financial crime or under any formal investigation by a competent
government authority for any violation of anti-corruption laws or international
anti-money laundering laws or standard.
8] Affiliation with
Government :
No record
exists to suggest that any director or indirect owners, controlling
shareholders, director, officer or employee of the company is a government
official or a family member or close business associate of a Government
official.
9] Compensation Package :
Our market
survey revealed that the amount of compensation sought by the subject is fair
and reasonable and comparable to compensation paid to others for similar
services.
10] Press Report :
No press reports / filings exists on
the subject.
CORPORATE GOVERNANCE
MIRA INFORM as part of its Due Diligence do provide comments on
Corporate Governance to identify management and governance. These factors often
have been predictive and in some cases have created vulnerabilities to credit
deterioration.
Our Governance Assessment focuses principally on the interactions
between a company’s management, its Board of Directors, Shareholders and other
financial stakeholders.
CONTRAVENTION
Subject is not known to have contravened any existing local laws,
regulations or policies that prohibit, restrict or otherwise affect the terms
and conditions that could be included in the agreement with the subject.
FOREIGN EXCHANGE RATES
|
Currency |
Unit
|
INR |
|
US Dollar |
1 |
INR 67.96 |
|
UK Pound |
1 |
INR 91.88 |
|
Euro |
1 |
INR 80.28 |
INFORMATION DETAILS
|
Information
Gathered by : |
SHR |
|
|
|
|
Analysis Done by
: |
VIV |
|
|
|
|
Report Prepared
by : |
IND |
SCORE FACTORS
|
DEMERIT POINTS |
|
|
|
--BANK CHARGES |
YES/NO |
YES |
|
--LITIGATION |
YES/NO |
NO |
|
--OTHER ADVERSE INFORMATION |
YES/NO |
NO |
|
MERIT POINTS |
|
|
|
--SOLE DISTRIBUTORSHIP |
YES/NO |
NO |
|
--EXPORT ACTIVITIES |
YES/NO |
NO |
|
--AFFILIATION |
YES/NO |
YES |
|
--LISTED |
YES/NO |
YES |
|
--OTHER MERIT FACTORS |
YES/NO |
YES |
RATING EXPLANATIONS
|
Credit Rating |
Explanation |
Rating Comments |
|
A++ |
Minimum Risk |
Business dealings permissible with minimum
risk of default |
|
A+ |
Low Risk |
Business dealings permissible with low
risk of default |
|
A |
Acceptable Risk |
Business dealings permissible with
moderate risk of default |
|
B |
Medium Risk |
Business dealings permissible on a regular
monitoring basis |
|
C |
Medium High Risk |
Business dealings permissible preferably
on secured basis |
|
D |
High Risk |
Business dealing not recommended or on
secured terms only |
|
NB |
New Business |
No recommendation can be done due to
business in infancy stage |
|
NT |
No Trace |
No recommendation can be done as the
business is not traceable |
NB is stated where there is insufficient information to facilitate rating. However, it is not to be considered as unfavourable.
This score serves as a reference to assess
SC’s credit risk and to set the amount of credit to be extended. It is
calculated from a composite of weighted scores obtained from each of the major
sections of this report. The assessed factors are as follows:
·
Financial
condition covering various ratios
·
Company
background and operations size
·
Promoters
/ Management background
·
Payment
record
·
Litigation
against the subject
·
Industry
scenario / competitor analysis
·
Supplier
/ Customer / Banker review (wherever available)
This report is issued at
your request without any risk and responsibility on the part of MIRA INFORM
PRIVATE LIMITED (MIPL) or its officials.