|
|
|


MIRA INFORM REPORT
|
Report No. : |
509739 |
|
Report Date : |
19.05.2018 |
IDENTIFICATION DETAILS
|
Name : |
SETCO AUTOMOTIVE LIMITED (w.e.f.14.02.2006) |
|
|
|
|
Formerly Known
As : |
GUJARAT SETCO CLUTCH LIMITED |
|
|
|
|
Registered
Office : |
Baroda Godhra Highway, Kalol, Panchmahal - 389330, Gujarat |
|
Tel. No.: |
91-2676-305600 |
|
|
|
|
Country : |
India |
|
|
|
|
Financials (as
on) : |
31.03.2017 |
|
|
|
|
Date of
Incorporation : |
05.05.1982 |
|
|
|
|
Com. Reg. No.: |
04-005203 |
|
|
|
|
Capital
Investment / Paid-up Capital : |
INR 267.193
Million |
|
|
|
|
CIN No.: [Company Identification
No.] |
L35999GJ1982PLC005203 |
|
|
|
|
IEC No.: |
0395008492 |
|
|
|
|
GSTN : [Goods & Service Tax
Registration No.] |
Not Divulged |
|
|
|
|
TIN No.: |
Not Divulged |
|
|
|
|
TAN No.: [Tax Deduction &
Collection Account No.] |
Not Available |
|
|
|
|
PAN No.: [Permanent Account No.] |
AAACG7777K |
|
|
|
|
Legal Form : |
A Public Limited Liability Company. The Company’s Shares are Listed on
the Stock Exchanges. |
|
|
|
|
Line of Business
: |
Manufacturer
of Clutches Products and Systems for Medium and Heavy Commercial Vehicles.
[Registered Activity] |
|
|
|
|
No. of Employees
: |
1200 (Approximately) |
RATING & COMMENTS
(Mira Inform has adopted New Rating mechanism w.e.f. 23rd
January 2017)
|
MIRA’s Rating : |
A+ |
|
Credit Rating |
Explanation |
Rating Comments |
|
A+ |
Low Risk |
Business dealings permissible with low
risk of default |
|
Status : |
Good |
|
|
|
|
Payment Behaviour : |
Regular |
|
|
|
|
Litigation : |
Clear |
|
|
|
|
Comments : |
Subject was incorporated in the year 1982. It is a manufacturer and exporter of clutch products for the automotive and hydraulic products. For the quarterly results of December 2017, the company has achieved sales turnover of INR 1456.5 million along with fair net profit margin. As per the financial records of 2017, the company has earned 1.12% growth in its sales turnover as compared to the previous year revenue and has reported an average net profit margin of 3.76%. The company possesses healthy financial position marked by above average net worth base along with low debt balance sheet profile and acceptable liquidity position. The company has its share price trading at around INR 52.65 on BSE as on May 16, 2018 as against the Face Value (FV) of INR 10. Business is active. Payments are reported to be regular. In view of aforesaid, the company can be considered for business dealings at usual trade terms and condition. |
NOTES :
Any query related to this report can be made
on e-mail : infodept@mirainform.com
while quoting report number, name and date.
EXTERNAL AGENCY RATING
|
Rating Agency Name |
CARE |
|
Rating |
Long Term Loans=BBB- |
|
Rating Explanation |
Moderate degree of safety and moderate credit risk |
|
Date |
18.10.2017 |
|
Rating Agency Name |
CARE |
|
Rating |
Short Term Loans=A3 |
|
Rating Explanation |
Moderate degree of safety and higher credit risk |
|
Date |
18.10.2017 |
RBI DEFAULTERS’ LIST STATUS
Subject’s name is not enlisted as a defaulter in
the publicly available RBI Defaulters’ list.
EPF (Employee Provident Fund) DEFAULTERS’ LIST STATUS
Subject’s name is not enlisted as a defaulter
in the publicly available EPF (Employee Provident Fund) Defaulters’ list as of
31-03-2018.
BIFR (Board for Industrial & Financial Reconstruction) LISTING
STATUS
Subject’s name is not listed as a Sick Unit in
the publicly available BIFR (Board for Industrial & Financial
Reconstruction) list as of 19.05.2018.
IBBI (Insolvency and Bankruptcy Board of India) LISTING STATUS
Subject’s name is not listed in the publicly
available IBBI (Insolvency and Bankruptcy Board of India) list as of report
date.
INFORMATION DECLINED
MANAGEMENT NON-COOPERATIVE
(Contact No: 91-22-40755555)
Given number [91-2676-235629] is continuously ringing
LOCATIONS
|
Registered Office/ Factory 1 : |
Baroda Godhra Highway, Kalol, Panchmahal - 389330,
Gujarat, India |
|
Tel. No.: |
91-2676-305600 |
|
Fax No.: |
91-2676-235524 |
|
E-Mail : |
|
|
Website : |
|
|
|
|
|
Corporate Office : |
2A, Film Centre Building, Ground Floor, 68, Tardeo Road, Mumbai - 400034, Maharashtra, India |
|
Tel. No.: |
91-22-40755555 |
|
Fax No.: |
91-22-23520754 |
|
|
|
|
Factory 2 : |
Sitarganj, District Udham Singh Nagar - 262405, Uttaranchal, India |
DIRECTORS
AS ON: 31.03.2017
|
Name : |
Mr. Shvetal Shatrughna Vakil |
|
Designation : |
Wholetime Director |
|
Address : |
17, Darya Mahal, Napean Sea Road, Malabar Hills, Mumbai-400006, Maharashtra, India |
|
Date of Birth/Age : |
31.03.1951 |
|
Qualification : |
Bachelor’s Degree from Mumbai University and Advance Management Programmed in from IIM, Ahmedabad. |
|
Date of Appointment : |
01.07.2010 |
|
DIN No.: |
00140956 |
|
|
|
|
Name : |
Mr. Ashok Kumar Jha |
|
Designation : |
Director |
|
Address : |
Late Mr. A L Jha, D-6/24, S/F Road Of D Block, Vasant Vihar, Opposite MCD P Ark, New Delhi-110057, India |
|
Date of Appointment : |
22.01.2010 |
|
DIN No.: |
00170745 |
|
|
|
|
Name : |
Mr. Arun Arora |
|
Designation : |
Director |
|
Address : |
Flat No 3a, Somerset Place 61-D, Bhulabhai Desai Road, Mumbai-400026, Maharashtra, India |
|
Date of Appointment : |
28.03.2007 |
|
DIN No.: |
00172044 |
|
|
|
|
Name : |
Mr. Udit Harish Sheth |
|
Designation : |
Managing Director |
|
Address : |
ILA Kunj 32 Nepean Sea Road, Mumbai-400036, Maharashtra, India |
|
Date of Birth/Age : |
10.01.1979 |
|
Qualification : |
Bachelor ’s Degree in Science with a specialization in Finance & MIS from Purdue University and has completed as Executive Education program from MIT, Cambridge –Boston, USA. |
|
Date of Appointment : |
30.06.2008 |
|
DIN No.: |
00187221 |
|
|
|
|
Name : |
Mrs. Suhasini Somesh Sathe |
|
Designation : |
Director |
|
Address : |
15, Laxmi Mahal, B. Petit Road, Mumbai-400026, Maharashtra, India |
|
Date of Appointment : |
12.02.2014 |
|
DIN No.: |
00205174 |
|
|
|
|
Name : |
Mr. Harish Kiritbhai Sheth |
|
Designation : |
Managing Director |
|
Address : |
2nd Floor, ILA Kunj 32, Nepean Sea Road, Mumbai-400036, Maharashtra, India |
|
Date of Birth/Age : |
11.09.1947 |
|
Qualification : |
Bachelor’s degree in Mechanical Engineering from the University of Michigan, Ann Arbor and an MBA (Finance) from the Columbia University, New York. |
|
Date of Appointment : |
05.05.1982 |
|
DIN No.: |
01434459 |
|
|
|
|
Name : |
Mr. Bhalchandra Lalan Naik |
|
Designation : |
Director |
|
Address : |
291, 301 Jyoti Avenue Shere Punjab, Andheri (East), Mumbai-400093, Maharashtra, India |
|
Date of Appointment : |
24.12.2008 |
|
DIN No.: |
02490022 |
|
|
|
|
Name : |
Mr. Urja Harshal Shah |
|
Designation : |
Wholetime Director |
|
Address : |
13/5 Jayant Mahal D Road, Marine Drive Near Wankhede Stadium, Mumbai-400020, Maharashtra, India |
|
Date of Birth/Age : |
11.11.1975 |
|
Qualification : |
Bachelors in Environmental Science and Masters in Environmental Policy from Duke University, USA; Certificate in International Development Studies from Duke University; and Certificate in Financial Accounting and Marketing from Boston University, USA. |
|
Date of Appointment : |
28.09.2015 |
|
DIN No.: |
02675341 |
KEY EXECUTIVES
|
Name : |
Mr. Bhautesh Ashwin Shah |
|
Designation : |
Company Secretary |
|
Address : |
232 Edulaie Corporate Housing Society, 13th Khetwadi, 2nd Floor, Mumbai-400004, Maharashtra, India |
|
Date of Appointment : |
06.01.2016 |
|
PAN No.: |
BFZPS7833E |
|
|
|
|
Name : |
Mr. Vinay Vasant Shahane |
|
Designation : |
Chief Financial Officer (KMP) |
|
Address : |
A-801, Krishna Towers, Shital Nagar, Kandivali (East), Mumbai-400101, Maharashtra, India |
|
Date of Appointment : |
05.08.2014 |
|
PAN No.: |
AHCPS3108E |
|
|
|
|
Name : |
Mr. Jatinder Bir Singh Balbir Singh Gujral |
|
Designation : |
Chief Executive Officer (KMP) |
|
Address : |
25/1202, Sea Woods Estate, Nri Complex, Palm Beach Road, Sec 54/56/58, Nerul, Navi Mumbai-400706, Maharashtra, India |
|
Date of Appointment : |
01.07.2017 |
|
PAN No.: |
ADZPG1795L |
MAJOR SHAREHOLDERS / SHAREHOLDING PATTERN
AS ON 31.03.2018
|
Category of Shareholder |
Total No. of Shares |
As a % |
|
(A) Promoter and Promoter Group |
84886725 |
63.54 |
|
(B) Public |
48709950 |
36.46 |
|
|
|
|
|
Grand Total |
133596675 |
100.00 |

Statement showing
shareholding pattern of the Promoter and Promoter Group
|
Category of
shareholder |
No. of fully paid
up equity shares held |
Shareholding as a %
of total no. of shares (calculated as per SCRR, 1957)As a % of (A+B+C2) |
|
|
A1) Indian |
0.00 |
|
|
|
Individuals/Hindu undivided Family |
1,71,22,880 |
12.82 |
|
|
Harish Kiritbhai Sheth |
87,61,575 |
6.56 |
|
|
Udit Harish Sheth |
72,67,000 |
5.44 |
|
|
Sneha Harish Sheth |
10,32,500 |
0.77 |
|
|
Harish Kiritbhai Sheth - HUF |
61,080 |
0.05 |
|
|
Urja Harish Sheth |
725 |
0.00 |
|
|
Any Other (specify) |
6,77,63,845 |
50.72 |
|
|
Setco Engineering Private Limited |
6,61,13,845 |
49.49 |
|
|
Urdit Investments Private Limited |
16,50,000 |
1.24 |
|
|
Sub Total A1 |
8,48,86,725 |
63.54 |
|
|
A2) Foreign |
0.00 |
|
|
|
A=A1+A2 |
8,48,86,725 |
63.54 |
|
Statement showing
shareholding pattern of the Public shareholder
|
Category & Name
of the Shareholders |
No. of fully paid
up equity shares held |
Shareholding %
calculated as per SCRR, 1957 As a % of (A+B+C2) |
|
|
|||
|
|||
|
|||
|
B1) Institutions |
0 |
0.00 |
|
|
Foreign Portfolio Investors |
100000 |
0.07 |
|
|
Financial Institutions/ Banks |
454618 |
0.34 |
|
|
Sub Total B1 |
554618 |
0.42 |
|
|
B2) Central Government/ State
Government(s)/ President of India |
0 |
0.00 |
|
|
B3) Non-Institutions |
0 |
0.00 |
|
|
Individual share capital upto INR 0.200
Million |
29036263 |
21.73 |
|
|
Individual share capital in excess of INR
0.200 Million |
3761683 |
2.82 |
|
|
Any Other (specify) |
15357386 |
11.50 |
|
|
IEPF |
406580 |
0.30 |
|
|
Trusts |
750 |
0.00 |
|
|
HUF |
1606586 |
1.20 |
|
|
New Vernon Private Equity Limited |
2383831 |
1.78 |
|
|
Non-Resident Indian (NRI) |
1025755 |
0.77 |
|
|
Non-Resident Indian (NRI) |
651631 |
0.49 |
|
|
Director or Director's Relatives |
288750 |
0.22 |
|
|
Clearing Members |
1853438 |
1.39 |
|
|
Barclays Wealth Trustees India Private
Limited |
2300000 |
1.72 |
|
|
Bodies Corporate |
4840065 |
3.62 |
|
|
Sub Total B3 |
48155332 |
36.05 |
|
|
B=B1+B2+B3 |
48709950 |
36.46 |
|
BUSINESS DETAILS
|
Line of Business : |
Manufacturer
of Clutches Products and Systems for Medium and Heavy Commercial Vehicles.
[Registered Activity] |
|
|
|
|
Brand Names : |
‘’SETCO’’ |
|
|
|
|
Agencies Held : |
Not Available |
|
|
|
|
Exports : |
Not Divulged |
|
|
|
|
Imports : |
Not Divulged |
|
|
|
|
Terms : |
|
|
Selling : |
Not Divulged |
|
|
|
|
Purchasing : |
Not Divulged |
PRODUCTION STATUS: (NOT AVAILABLE)
GENERAL INFORMATION
|
Suppliers : |
|
|||||||||||||||||||||||||||||||||||||||
|
|
|
|||||||||||||||||||||||||||||||||||||||
|
Customers : |
· Ashok Leyland · Tata · VE Commercial Vehicles · Man · Mahindra Trucks and Busses · AMW |
|||||||||||||||||||||||||||||||||||||||
|
|
|
|||||||||||||||||||||||||||||||||||||||
|
No. of Employees : |
1200 (Approximately) |
|||||||||||||||||||||||||||||||||||||||
|
|
|
|||||||||||||||||||||||||||||||||||||||
|
Bankers : |
· Bank of Baroda · ICICI Bank Limited ·
HDFC Bank Limited |
|||||||||||||||||||||||||||||||||||||||
|
|
|
|||||||||||||||||||||||||||||||||||||||
|
Facilities : |
|
|
|
|
|
Auditors : |
|
|
Name : |
Manesh Mehta and Associates Chartered Accountants |
|
Address : |
611, Centre Point, R. C. Dutt Road, Alkapuri, Vadodara, Gujarat, India |
|
Tel. No.: |
91-265-3052544 |
|
E-Mail : |
|
|
|
|
|
Solicitors : |
|
|
Name : |
Wadia Ghandy and Company |
|
Address : |
Mumbai, Maharashtra, India |
|
|
|
|
Memberships : |
Not Available |
|
|
|
|
Collaborators : |
Not Available |
|
|
|
|
Holding Company : |
Setco Engineering Private Limited |
|
|
|
|
Wholly Owned Ultimate Foreign Subsidiary Companies : |
· Setco Automotive (UK) Limited UK · Setco Automotive N.A. Inc. (USA) · WEW Holdings Limited, Mauritius · Setco MEA DMCC |
|
|
|
|
Subsidiary Company : |
Lava Cast Private Limited |
|
|
|
|
Relatives of Key
Managerial Personnel : |
Hrehan Venture Advisors Private Limited |
|
|
|
|
Enterprises over which Key Managerial Personnel are able to exercise
significant influence : |
· Western Engineering Works · SE Transstadia Private Limited · White River Entertainment Pvt. Ltd. · Transstadia Technologies Private Limited · Transstadia Play sport Private Limited · Transstadia Sport Sciences Private Limited · Transstadia Capital Private Limited · Transstadia Boxing India Private Limited · Transstadia Holdings Private Limited · Setco Holdings Private Limited · Transstadia hospitality Private Limited · Urdit Exports · Setco Foundation |
CAPITAL STRUCTURE
AS ON: 31.03.2017
Authorised Capital :
|
No. of Shares |
Type |
Value |
Amount |
|
|
|
|
|
|
250000000 |
Equity Shares |
INR 2/- each |
INR 500.000 Million |
|
|
|
|
|
Issued, Subscribed & Paid-up Capital :
|
No. of Shares |
Type |
Value |
Amount |
|
|
|
|
|
|
133596675 |
Equity Shares |
INR 2/- each |
INR 267.193
Million |
|
|
|
|
|
a. Pursuant to the approval of members in the Annual General Meeting held on 28th September, 2015 the equity shares of face value of Rs.10/- each have been subdivided into equity shares of face value of INR 2/- each with effect from 17th December, 2015. As a result, the number of equity shares has increased from 2,67,19,335 to 13,35,96,675 shares. Accordingly the number of shares has been adjusted for all the periods presented.
b. The company has only one class of equity shares having a par value of INR 2 per share. Each shareholder of equity share is entitled to one vote per share.
c. The company declares and pays dividends in Indian rupees. The board of directors in their meeting held on 30th May, 2017 have proposed dividend of Rs. 0.65 per share for financial year ended 31st March, 2017. The proposed dividend is subject to the approval of the share holders at the ensuing Annual General Meeting. The total dividend appropriation would amount to approximately INR 10,45,15,980 including corporate dividend tax of
INR 1,76,78,141/-.
d. In the event of liquidation of the company, the holders of equity shares will be entitled to receive remaining assets of the company after distribution of all preferential amounts, in proportion to their shareholding.
Reconciliation of
the number of shares outstanding at the beginning and at the end of the reporting
period
|
Equity Shares |
31 March 2017 |
|
|
Number
of Shares |
INR
In Million |
|
|
As at the beginning of the year |
133596675 |
267.193 |
|
Add : Share issued on exercise of employee stock options |
-- |
-- |
|
|
133596675 |
267.193 |
|
Less : Changes, if any during the year |
-- |
-- |
|
Outstanding at the end of the year |
133596675 |
267.193 |
Details of
Shareholders holding more than 5% shares in the company
|
Name of
Shareholders |
Number
of Equity Shares |
% Holding |
|
Equity Shares of INR
2/- each fully paid |
|
|
|
Setco Engineering
Private Limited (Promoter Group) |
67713845 |
50.69 |
|
Harishbhai K. Sheth |
7161575 |
5.36 |
Shares in respect of each class in the company held by Holding Company
|
Particulars |
31ST March 2017 |
|
|
|
Number of Equity shares |
INR In Million |
|
Equity Shares of INR
2/- each fully paid |
|
|
|
Setco Engineering Private
Limited (Promoter Group)* |
67713845 |
135.428 |
* with the acquisition of further shares of the company by Setco Engineering Private Limited (Promoter Group Company), the Company has become subsidiary of Setco Engineering Private Limited w.e.f. 27th August, 2014.
FINANCIAL DATA
[all figures are
in INR Million]
ABRIDGED
BALANCE SHEET [STANDALONE]
|
SOURCES OF FUNDS |
31.03.2017 |
31.03.2016 |
31.03.2015 |
|
I.
EQUITY AND LIABILITIES |
|
|
|
|
(1)Shareholders' Funds |
|
|
|
|
(a) Share Capital |
267.193 |
267.193 |
267.193 |
|
(b) Reserves & Surplus |
2141.986 |
1946.289 |
1740.730 |
|
(c) Money received against share warrants |
0.000 |
0.000 |
0.000 |
|
|
|
|
|
|
(2) Share
Application money pending allotment |
0.000 |
0.000 |
0.000 |
|
Total
Shareholders’ Funds (1) + (2) |
2409.179 |
2213.482 |
2007.923 |
|
|
|
|
|
|
(3)
Non-Current Liabilities |
|
|
|
|
(a) Long-term borrowings |
560.916 |
635.076 |
792.389 |
|
(b) Deferred tax liabilities (Net) |
108.717 |
98.005 |
89.670 |
|
(c)
Other long term liabilities |
0.000 |
0.000 |
0.000 |
|
(d)
long-term provisions |
11.599 |
9.518 |
10.912 |
|
Total
Non-current Liabilities (3) |
681.232 |
742.599 |
892.971 |
|
|
|
|
|
|
(4) Current Liabilities |
|
|
|
|
(a)
Short term borrowings |
1710.897 |
1426.666 |
1207.733 |
|
(b)
Trade payables |
829.949 |
866.625 |
433.519 |
|
(c)
Other current liabilities |
408.325 |
365.085 |
203.500 |
|
(d)
Short-term provisions |
25.732 |
171.048 |
59.348 |
|
Total
Current Liabilities (4) |
2974.903 |
2829.424 |
1904.100 |
|
|
|
|
|
|
TOTAL |
6065.314 |
5785.505 |
4804.994 |
|
|
|
|
|
|
II.
ASSETS |
|
|
|
|
(1) Non-current assets |
|
|
|
|
(a)
Fixed Assets |
|
|
|
|
(i)
Tangible assets |
1295.862 |
1316.490 |
1247.796 |
|
(ii)
Intangible Assets |
146.337 |
130.793 |
101.323 |
|
(iii)
Capital work-in-progress |
1.097 |
7.983 |
4.561 |
|
(iv) Intangible assets under development |
171.255 |
126.512 |
82.863 |
|
(b) Non-current
Investments |
1251.494 |
1112.150 |
819.650 |
|
(c) Deferred tax assets
(net) |
0.000 |
0.000 |
0.000 |
|
(d) Long-term Loan
and Advances |
374.639 |
395.270 |
440.396 |
|
(e)
Other Non-current assets |
0.000 |
0.000 |
0.000 |
|
Total
Non-Current Assets |
3240.684 |
3089.198 |
2696.589 |
|
|
|
|
|
|
(2) Current assets |
|
|
|
|
(a)
Current investments |
0.000 |
0.000 |
0.000 |
|
(b)
Inventories |
807.305 |
784.978 |
727.499 |
|
(c)
Trade receivables |
1286.934 |
1255.472 |
879.138 |
|
(d)
Cash and cash equivalents |
71.485 |
12.180 |
60.995 |
|
(e)
Short-term loans and advances |
658.906 |
643.677 |
440.773 |
|
(f)
Other current assets |
0.000 |
0.000 |
0.000 |
|
Total
Current Assets |
2824.630 |
2696.307 |
2108.405 |
|
|
|
|
|
|
TOTAL |
6065.314 |
5785.505 |
4804.994 |
PROFIT
& LOSS ACCOUNT
|
|
PARTICULARS |
31.03.2017 |
31.03.2016 |
31.03.2015 |
|
|
|
SALES |
|
|
|
|
|
|
|
Revenue from Operations |
5108.197 |
5051.489 |
4581.348 |
|
|
|
Other Income |
77.313 |
130.205 |
90.742 |
|
|
|
TOTAL |
5185.510 |
5181.694 |
4672.090 |
|
|
|
|
|
|
|
|
Less |
EXPENSES |
|
|
|
|
|
|
|
Cost of Materials Consumed |
2925.823 |
2853.173 |
2741.421 |
|
|
|
Changes in inventories of finished goods, work-in-progress
and Stock-in-Trade |
(2.178) |
29.342 |
(26.006) |
|
|
|
Employees benefits expense |
460.865 |
449.333 |
397.448 |
|
|
|
Other expenses |
1058.603 |
986.174 |
910.268 |
|
|
|
TOTAL |
4443.113 |
4318.022 |
4023.131 |
|
|
|
|
|
|
|
|
|
PROFIT
BEFORE INTEREST, TAX, DEPRECIATION AND AMORTISATION |
742.397 |
863.672 |
648.959 |
|
|
|
|
|
|
|
|
|
Less |
FINANCIAL
EXPENSES |
323.545 |
307.555 |
234.338 |
|
|
|
|
|
|
|
|
|
|
PROFIT/
(LOSS) BEFORE TAX, DEPRECIATION AND AMORTISATION |
418.852 |
556.117 |
414.621 |
|
|
|
|
|
|
|
|
|
Less/ Add |
DEPRECIATION/
AMORTISATION |
166.116 |
147.177 |
132.405 |
|
|
|
|
|
|
|
|
|
|
PROFIT/ (LOSS)
BEFORE TAX |
252.736 |
408.940 |
282.216 |
|
|
|
|
|
|
|
|
|
Less |
TAX |
60.733 |
74.746 |
47.088 |
|
|
|
|
|
|
|
|
|
|
PROFIT/ (LOSS)
AFTER TAX |
192.003 |
334.194 |
235.128 |
|
|
|
|
|
|
|
|
|
|
EARNINGS IN
FOREIGN CURRENCY |
|
|
|
|
|
|
|
Exports of Goods at FOB value |
185.973 |
238.431 |
321.316 |
|
|
|
Interest from wholly owned ultimate foreign subsidiaries |
72.677 |
60.770 |
49.137 |
|
|
|
Other income from wholly owned ultimate foreign subsidiaries |
3.414 |
3.615 |
3.864 |
|
|
TOTAL EARNINGS |
262.064 |
302.816 |
374.317 |
|
|
|
|
|
|
|
|
|
|
IMPORTS |
|
|
|
|
|
|
|
Raw Materials, Components & Spares Parts |
562.498 |
678.636 |
714.109 |
|
|
|
Capital Goods |
0.000 |
25.352 |
0.000 |
|
|
TOTAL IMPORTS |
562.498 |
703.988 |
714.109 |
|
|
|
|
|
|
|
|
|
|
Earnings/ (Loss)
Per Share (INR) |
1.44 |
2.50 |
1.76 |
|
CURRENT MATURITIES OF LONG TERM DEBT DETAILS
|
PARTICULARS |
31.03.2017 |
31.03.2016 |
31.03.2015 |
|
Current Maturities of Long term Loans |
332.795 |
266.305 |
129.250 |
|
|
|
|
|
|
Cash Flow Generated from Operations |
368.904 |
668.289 |
101.460 |
|
|
|
|
|
|
Net Cash Flow from Operating Activities |
367.111 |
665.166 |
100.447 |
KEY
RATIOS
EFFICIENCY RATIOS
|
PARTICULARS |
31.03.2017 |
31.03.2016 |
31.03.2015 |
|
Average Collection Days (Sundry
Debtors / Income * 365 Days) |
91.96 |
90.72 |
70.04 |
|
|
|
|
|
|
Account Receivables Turnover (Income / Sundry Debtors) |
3.97 |
4.02 |
5.21 |
|
|
|
|
|
|
Average Payment Days (Sundry Creditors / Purchases * 365 Days) |
103.54 |
110.87 |
57.72 |
|
|
|
|
|
|
Inventory Turnover (Operating Income / Inventories) |
0.92 |
1.10 |
0.89 |
|
|
|
|
|
|
Asset Turnover (Operating Income / Net Fixed Assets) |
0.46 |
0.55 |
0.45 |
LEVERAGE RATIOS
|
PARTICULARS |
31.03.2017 |
31.03.2016 |
31.03.2015 |
|
Debt Ratio ((Borrowing
+ Current Liabilities) / Total Assets) |
0.64 |
0.64 |
0.59 |
|
|
|
|
|
|
Debt Equity Ratio (Total Liability / Networth) |
1.08 |
1.05 |
1.06 |
|
|
|
|
|
|
Current Liabilities to Networth (Current Liabilities / Net Worth) |
1.23 |
1.28 |
0.95 |
|
|
|
|
|
|
Fixed Assets to Networth (Net Fixed Assets / Networth) |
0.67 |
0.71 |
0.72 |
|
|
|
|
|
|
Interest Coverage Ratio (PBIT / Financial Charges) |
2.29 |
2.81 |
2.77 |
PROFITABILITY RATIOS
|
PARTICULARS |
|
31.03.2017 |
31.03.2016 |
31.03.2015 |
|
Net Profit Margin ((PAT / Sales) * 100) |
% |
3.76 |
6.62 |
5.13 |
|
|
|
|
|
|
|
Return on Total Assets ((PAT / Total Assets) * 100) |
% |
3.17 |
5.78 |
4.89 |
|
|
|
|
|
|
|
Return on Investment (ROI) ((PAT / Networth) * 100) |
% |
7.97 |
15.10 |
11.71 |
SOLVENCY RATIOS
|
PARTICULARS |
31.03.2017 |
31.03.2016 |
31.03.2015 |
|
Current Ratio (Current
Assets / Current Liabilities) |
0.95 |
0.95 |
1.11 |
|
|
|
|
|
|
Quick Ratio ((Current Assets – Inventories) / Current
Liabilities) |
0.68 |
0.68 |
0.73 |
|
|
|
|
|
|
G-Score Ratio Financial (Networth / Total Assets) |
0.40 |
0.38 |
0.42 |
|
|
|
|
|
|
G-Score Ratio Debt (Debts / Equity Capital) |
9.75 |
8.71 |
7.97 |
|
|
|
|
|
|
G-Score Ratio Liquidity (Total Current Assets / Total Current Liabilities) |
0.95 |
0.95 |
1.11 |
Total
Liability = Short-term Debt + Long-term Debt + Current Maturities of Long-term
debts
STOCK
PRICES
|
Face Value |
INR 2.00/- |
|
|
|
|
Market Value |
INR 52.65/- |
FINANCIAL ANALYSIS
[all figures are
in INR Million]
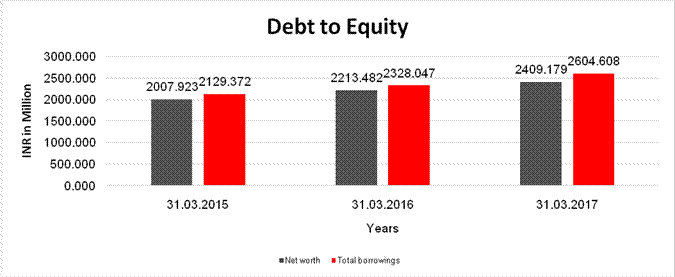
DEBT EQUITY RATIO
|
Particular |
31.03.2015 |
31.03.2016 |
31.03.2017 |
|
|
INR
In Million |
INR
In Million |
INR
In Million |
|
Share Capital |
267.193 |
267.193 |
267.193 |
|
Reserves & Surplus |
1740.730 |
1946.289 |
2141.986 |
|
Share Application money
pending allotment |
0.000 |
0.000 |
0.000 |
|
Net
worth |
2007.923 |
2213.482 |
2409.179 |
|
|
|
|
|
|
long-term borrowings |
792.389 |
635.076 |
560.916 |
|
Short term borrowings |
1207.733 |
1426.666 |
1710.897 |
|
Current Maturities of Long
term Loans |
129.250 |
266.305 |
332.795 |
|
Total
borrowings |
2129.372 |
2328.047 |
2604.608 |
|
Debt/Equity
ratio |
1.060 |
1.052 |
1.081 |
YEAR-ON-YEAR GROWTH
|
Year
on Year Growth |
31.03.2015 |
31.03.2016 |
31.03.2017 |
|
|
INR
In Million |
INR
In Million |
INR
In Million |
|
Sales |
4581.348 |
5051.489 |
5108.197 |
|
|
|
10.262 |
1.123 |

NET PROFIT MARGIN
|
Net
Profit Margin |
31.03.2015 |
31.03.2016 |
31.03.2017 |
|
|
INR
In Million |
INR
In Million |
INR
In Million |
|
Sales |
4581.348 |
5051.489 |
5108.197 |
|
Profit/ (Loss) |
235.128 |
334.194 |
192.003 |
|
|
5.13% |
6.62% |
3.76% |
ABRIDGED
BALANCE SHEET [CONSOLIDATED]
|
SOURCES OF FUNDS |
|
31.03.2017 |
31.03.2016 |
|
I.
EQUITY AND LIABILITIES |
|
|
|
|
(1)Shareholders' Funds |
|
267.193 |
267.193 |
|
(a) Share Capital |
|
1778.804 |
1874.790 |
|
(b) Reserves & Surplus |
|
0.000 |
0.000 |
|
(c) Money received against share warrants |
|
|
|
|
|
|
|
|
|
(2) Share
Application money pending allotment |
|
0.000 |
0.000 |
|
Minority Interest |
|
81.665 |
89.838 |
|
Total
Shareholders’ Funds (1) + (2) |
|
2127.662 |
2231.821 |
|
|
|
|
|
|
(3)
Non-Current Liabilities |
|
|
|
|
(a) Long-term borrowings |
|
1748.942 |
1908.230 |
|
(b) Deferred tax liabilities (Net) |
|
0.000 |
76.665 |
|
(c)
Other long term liabilities |
|
0.000 |
0.000 |
|
(d)
long-term provisions |
|
12.368 |
10.187 |
|
Total
Non-current Liabilities (3) |
|
1761.310 |
1995.082 |
|
|
|
|
|
|
(4) Current Liabilities |
|
|
|
|
(a)
Short term borrowings |
|
2065.988 |
1795.414 |
|
(b)
Trade payables |
|
862.027 |
785.744 |
|
(c)
Other current liabilities |
|
558.071 |
422.655 |
|
(d)
Short-term provisions |
|
25.782 |
171.084 |
|
Total
Current Liabilities (4) |
|
3511.868 |
3174.897 |
|
|
|
|
|
|
TOTAL |
|
7400.840 |
7401.800 |
|
|
|
|
|
|
II.
ASSETS |
|
|
|
|
(1) Non-current assets |
|
|
|
|
(a)
Fixed Assets |
|
|
|
|
(i)
Tangible assets |
|
2974.011 |
1664.275 |
|
(ii)
Intangible Assets |
|
325.621 |
331.973 |
|
(iii)
Capital work-in-progress |
|
1.097 |
1241.025 |
|
(iv) Intangible assets under development |
|
171.255 |
126.512 |
|
Pre-Operative Expenses |
|
0.000 |
168.918 |
|
(b) Non-current
Investments |
|
500.000 |
580.000 |
|
(c) Deferred tax assets
(net) |
|
51.423 |
0.000 |
|
(d) Long-term Loan
and Advances |
|
249.387 |
266.949 |
|
(e)
Other Non-current assets |
|
17.968 |
3.793 |
|
Total
Non-Current Assets |
|
4290.762 |
4383.445 |
|
|
|
|
|
|
(2) Current assets |
|
|
|
|
(a)
Current investments |
|
0.000 |
0.000 |
|
(b)
Inventories |
|
1376.863 |
1446.126 |
|
(c)
Trade receivables |
|
1235.727 |
1114.066 |
|
(d)
Cash and cash equivalents |
|
93.510 |
47.454 |
|
(e)
Short-term loans and advances |
|
403.978 |
410.709 |
|
(f)
Other current assets |
|
0.000 |
0.000 |
|
Total
Current Assets |
|
3110.078 |
3018.355 |
|
|
|
|
|
|
TOTAL |
|
7400.840 |
7401.800 |
PROFIT
& LOSS ACCOUNT
|
|
PARTICULARS |
|
31.03.2017 |
31.03.2016 |
|
|
|
SALES |
|
|
|
|
|
|
|
Revenue from Operations |
|
5696.432 |
5636.792 |
|
|
|
Other Income |
|
8.338 |
63.667 |
|
|
|
TOTAL |
|
5704.770 |
5700.459 |
|
|
|
|
|
|
|
|
Less |
EXPENSES |
|
|
|
|
|
|
|
Cost of Materials Consumed |
|
2847.870 |
3048.090 |
|
|
|
Changes in inventories of finished goods, work-in-progress
and Stock-in-Trade |
|
(8.365) |
29.342 |
|
|
|
Employees benefits expense |
|
778.712 |
665.325 |
|
|
|
Other expenses |
|
1469.702 |
1152.593 |
|
|
|
TOTAL |
|
5087.919 |
4895.350 |
|
|
|
|
|
|
|
|
|
PROFIT
BEFORE INTEREST, TAX, DEPRECIATION AND AMORTISATION |
|
616.851 |
805.109 |
|
|
|
|
|
|
|
|
|
Less |
FINANCIAL
EXPENSES |
|
521.678 |
333.865 |
|
|
|
|
|
|
|
|
|
|
PROFIT/
(LOSS) BEFORE TAX, DEPRECIATION AND AMORTISATION |
|
95.173 |
471.244 |
|
|
|
|
|
|
|
|
|
Less/ Add |
DEPRECIATION/
AMORTISATION |
|
302.234 |
187.046 |
|
|
|
|
|
|
|
|
|
|
PROFIT/ (LOSS)
BEFORE TAX |
|
(207.061) |
284.198 |
|
|
|
|
|
|
|
|
|
Less |
TAX |
|
(79.211) |
55.181 |
|
|
|
|
|
|
|
|
|
|
PROFIT/ (LOSS) FOR THE YEAR BEFORE ADJUSTMENT FOR MINORITY
INTERESTS |
|
(127.850) |
229.017 |
|
|
|
|
|
|
|
|
|
Less |
SHARE OF PROFIT / (LOSS) TRANSFERRED TO MINORITY INTERESTS |
|
(49.409) |
(3.006) |
|
|
|
|
|
|
|
|
|
|
PROFIT/ (LOSS)
FOR THE YEAR AFTER ADJUSTMENT FOR MINORITY INTERESTS |
|
(78.441) |
232.023 |
|
|
|
|
|
|
|
|
|
|
Earnings/ (Loss)
Per Share (INR) |
|
(0.59) |
1.74 |
|
LOCAL AGENCY FURTHER INFORMATION
|
Sr. No. |
Check list by
info agents |
Available in
Report (Yes/No) |
|
1 |
Year of establishment |
Yes |
|
2 |
Constitution of the entity -Incorporation
details |
Yes |
|
3 |
Locality of the entity |
Yes |
|
4 |
Premises details |
No |
|
5 |
Buyer visit details |
-- |
|
6 |
Contact numbers |
Yes |
|
7 |
Name of the person contacted |
No |
|
8 |
Designation of contact person |
No |
|
9 |
Promoter’s background |
Yes |
|
10 |
Date of Birth of Proprietor / Partners /
Directors |
Yes |
|
11 |
Pan Card No. of Proprietor / Partners |
No |
|
12 |
Voter Id Card No. of Proprietor / Partners |
No |
|
13 |
Type of business |
Yes |
|
14 |
Line of Business |
Yes |
|
15 |
Export/import details (if applicable) |
No |
|
16 |
No. of employees |
No |
|
17 |
Details of sister concerns |
Yes |
|
18 |
Major suppliers |
No |
|
19 |
Major customers |
No |
|
20 |
Banking Details |
Yes |
|
21 |
Banking facility details |
Yes |
|
22 |
Conduct of the banking account |
-- |
|
23 |
Financials, if provided |
Yes |
|
24 |
Capital in the business |
Yes |
|
25 |
Last accounts filed at ROC, if applicable |
Yes |
|
26 |
Turnover of firm for last three years |
Yes |
|
27 |
Reasons for variation <> 20% |
-- |
|
28 |
Estimation for coming financial year |
No |
|
29 |
Profitability for last three years |
Yes |
|
30 |
Major shareholders, if available |
Yes |
|
31 |
External Agency Rating, if available |
Yes |
|
32 |
Litigations that the firm/promoter
involved in |
-- |
|
33 |
Market information |
-- |
|
34 |
Payments terms |
No |
|
35 |
Negative Reporting by Auditors in the Annual
Report |
No |
INDEX OF CHARGES
|
SNO |
SRN |
CHARGE ID |
CHARGE HOLDER NAME |
DATE OF CREATION |
DATE OF MODIFICATION |
DATE OF SATISFACTION |
AMOUNT |
ADDRESS |
|
1 |
G25003310 |
100062310 |
IDBI Bank Ltd |
28/10/2016 |
- |
- |
395000000.0 |
IDBI Tower, WTC ComplexCuffe ParadeMumbaiMH400005IN |
|
2 |
G45606753 |
10426892 |
BANK OF BARODA |
25/04/2013 |
27/12/2016 |
- |
2601400000.0 |
KALOLPANCHMAHALSVADODARAGJ389330IN |
|
3 |
G45615275 |
10426210 |
BANK OF BARODA |
25/04/2013 |
27/12/2016 |
- |
2601400000.0 |
KALOLPANCHMAHALSVADODARAGJ389330IN |
|
4 |
G45902103 |
10426213 |
BANK OF BARODA |
25/04/2013 |
30/03/2017 |
- |
2996400000.0 |
KALOLPANCHMAHALSVADODARAGJ389330IN |
|
5 |
A57268955 |
10060665 |
Bank of Baroda |
11/07/2007 |
06/02/2009 |
- |
375169000.0 |
Kalol (Panchmahal)Kalol (Panchmahal)BarodaGJ389330IN |
|
6 |
B35471119 |
10060667 |
Bank of Baroda |
11/07/2007 |
29/02/2012 |
- |
474600000.0 |
Kalol,Dist. Panchmahal,PanchmahalGJ389330IN |
|
7 |
B35469063 |
10060663 |
Bank of Baroda |
11/07/2007 |
29/02/2012 |
- |
950000000.0 |
KalolDist. PanchmahalPanchmahalGJ389330IN |
|
8 |
B35378090 |
10071316 |
Bank of Baroda |
11/07/2007 |
29/02/2012 |
- |
1424600000.0 |
Kalol,Dist. Panchmahal,PanchmahalGJ389330IN |
|
9 |
A01764679 |
10007546 |
BANK OF BARODA |
27/06/2006 |
- |
- |
436444000.0 |
KALOL 389330KALOLGJ389330IN |
|
10 |
A02394930 |
10009835 |
THE BANK OF BARODA |
27/06/2006 |
- |
- |
3600000.0 |
KALOL-389330KALOLGJ389330IN |
UNSECURED LOANS
|
PARTICULARS |
31.03.2017 (INR
In Million) |
31.03.2016 (INR
In Million) |
|
LONG-TERM BORROWINGS |
|
|
|
From other parties |
92.000 |
0.000 |
|
|
|
|
|
SHORT TERM BORROWINGS |
|
|
|
Loans repayable on
demand: |
|
|
|
Working Capital Loan from Banks |
0.000 |
100.000 |
|
From other parties |
46.000 |
0.000 |
|
|
|
|
|
Total |
138.000 |
100.00 |
MANAGEMENT DISCUSSION AND ANALYSIS
ECONOMIC OUTLOOK
Post the global
financial crisis of 2008, most developed nations have reported subdued economic
recovery. Current policy trends and national referendums in some advanced
nations point to a policy shift towards economic protectionism. This can impact
collaborative trade policies and practices, which drove the growth in the past.
The changing geopolitical environment resulted in global economy registering
almost flat growth of 3.1%. Expectation of stable growth in China and USA as
well as optimism about Eurozone growth prospects have resulted in rebound in
commodity cycle. According to International Monetary Fund (IMF) estimates
global economic growth is likely to pick up to 3.4% and 3.6% in FY 18 and FY 19
respectively.
In contrast to
global scenario, Indian economy registered a robust GDP growth of around 7.4%
in the first half of
the year. However,
demonetization and uncertainty about GST implementation impacted overall
economic activity resulting in annual GDP growth dropping to 7.1% for 2017.
However, even at this level, India retains the tag of one of the fastest
growing economies in the world. Though industrial sector witnessed a slowdown,
it was offset by a strong growth in agriculture sector, on the back of good
monsoon after two years of drought.
Government's
efforts to integrate its various flagship schemes like Make In India, Skill India,
Start Up India, Digital India and others is likely to result in increased job
opportunities and higher economic growth. Government's focus on infrastructure
spends and project 'BharatNet' which aims to connect rural areas with
high-speed internet connectivity would unleash the untapped potential of
business opportunities in years to come. Likely reforms in banking sector to
address assets quality issues would also unlock huge capital. Normal monsoon,
moderate medium term inflation at around 4%, stable and lower interest rates
and upswing in consumer demand is expected to boost private sector investments.
These factors is likely to ensure India retains its tag of fastest growing
economy in FY 18 also. IMF estimates Indian economy to grow 7.2% in 2017 and
7.7% in 2018. Economic Survey 2016-17 also predicts real GDP growth towards
lower end of the range between 6.75 - 7.50% in
FY 2017-18.
AUTOMOBILE INDUSTRY
Automobile
industry plays a significant role in India's GDP with a share of around 7.1%.
It also contributes significantly to employment creation and FDI inflows.
Increase in demand from rural markets and in infrastructure spending are the
key factors driving the growth of the automobile sector in recent years.
Current year was eventful for the industry with major challenges in the form of
demonetization and ban on production and sales of BS III vehicles from April
2017, forcing the companies to review and revise their strategies and policies.
Commercial
vehicles segment, led by Light Commercial Vehicles (LCV) grew by around 4.2% in
FY2017 over previous year. Compared to growth of over 20% each in earlier two
years, Medium and Heavy Commercial Vehicles (MHCV) segment registered a
negligible growth of around 0.04% while LCVs registered a growth of 7.41% over
previous year. Pick up in industrial activity, good monsoon and likely price
increase in case of BS IV compliant vehicles was expected to drive the growth
further. However, industry faced major challenges in the form of uncertainty
about GST implementation, demonetization and uncertainty on production and
sales of BS III vehicles from April 2017. Lower economic activity in
construction and housing and impact of demonetization resulting in cash crunch
in the third and fourth quarter forced the companies to review and revise their
strategies and policies.
With effect of
implementation of BS IV norms and GST behind, Indian economy is expected to
return to the growth trajectory driven by good monsoon, increased government
spend on infrastructure and improvement in manufacturing and service sector
driven by increased demand. As per ICRA report, MHCV production is expected to
register a growth of around 6-8%. Industry also awaits policy reforms about use
of old vehicles and restrictions on overloading, which will be an additional
boost to MHCV production.
Proposed move
of pollution norms from BS-IV to BS-VI or EURO-VI by the year 2020 would make
automotive companies to go for light weight fuel efficient model which may lead
to higher vibration. Clutch is a critical part which also performs additional
and key function to dampen the vibrations coming from engine and propagate it
in transmission system and the proposed shift would necessitate up-gradation in
clutch design. Besides focusing on up-gradation, measuring Noise Vibration
Harmonics (NVH) is a key aspect for clutch manufacturer. Company has recently
acquired PROSIG NVH system which would enable it to carry out the NVH field
testing and measure the vibration to optimise the clutch dampening system. Company
is working with all its OEM customers to suit the clutch system complying with
BSVI norms to transfer the high power and torque for better driver comfort and
enhanced durability.
STANDALONE UNAUDITED FINANCIAL RESULTS FOR THE QUARTER AND NINE
MONTHS ENDED 31.12.2017
(INR. IN MILLION)
|
Particulars |
Quarter ended |
Nine months ended |
|
|
|
31.12.2017 |
30.09.2017 |
31.12.2017 |
|
|
Unaudited |
Unaudited |
Unaudited |
|
Income
|
|
|
|
|
a)
Net Sales/Income from Operations |
1456.500 |
1346.500 |
3534.600 |
|
b)
Other Income |
29.100 |
70.000 |
131.800 |
|
Total income |
1485.600 |
1416.500 |
3666.400 |
|
|
|
|
|
|
Expenses |
|
|
|
|
a)
Cost of materials consumed |
857.300 |
714.800 |
2059.500 |
|
b)
Purchase of traded goods |
--- |
--- |
---- |
|
c)
Changes in inventories of finished goods, work-in-progress and traded goods |
(10.400) |
93.000 |
(13.800) |
|
d)
Excise Duty |
--- |
--- |
45.000 |
|
e)
Employee benefits expense |
134.700 |
115.000 |
357.000 |
|
f)
Finance Costs |
79.900 |
73.100 |
228.000 |
|
g)
Depreciation and amortisation expense |
44.100 |
43.600 |
130.700 |
|
h)
Other expenses |
257.200 |
235.900 |
715.500 |
|
Total Expenses |
1362.800 |
1275.400 |
3521.900 |
|
|
|
|
|
|
Profit before exceptional
Items and tax |
122.800 |
141.100 |
144.500 |
|
Exceptional
Items |
--- |
--- |
--- |
|
Profit before tax |
122.800 |
141.100 |
144.500 |
|
Tax
expense |
|
|
|
|
Current
Tax |
24.700 |
0.500 |
25.200 |
|
Deferred
Tax |
(14.600) |
3.000 |
(12.100) |
|
Profit/ (Loss) for the
Period |
112.700 |
137.600 |
131.400 |
|
Other Comprehensive Income |
|
|
|
|
A. Items that will not be reclassified to profit or loss |
--- |
--- |
--- |
|
Income tax relating to items that will be reclassified to profit or loss |
--- |
--- |
--- |
|
B. Items that will be reclassified to profit or loss |
--- |
--- |
--- |
|
Income tax relating to items that will be reclassified to profit or loss |
--- |
--- |
--- |
|
Total Comprehensive Income (Net of Tax) |
--- |
--- |
--- |
|
Total Other Comprehensive Income for the
period |
112.700 |
137.600 |
131.400 |
|
Paid - up Equity Share Capital (Face value of INR 2/- per share) |
267.200 |
267.200 |
267.200 |
|
Earnings Per Share (EPS) (Face
value of INR 2/- per share) (not annualised) |
|
|
|
|
a) Basic |
0.84 |
1.03 |
0.98 |
|
b) Diluted |
0.84 |
1.03 |
0.98 |
Notes:
1. The company has adopted Indian Accounting Standards (IND AS) notified by the Ministry of Corporate Affairs with effect from 1st April 2017 with a transition date of 1st April 2016. Accordingly the financial results for the Quarter Ended on 31st Dec 2017 have been prepared in accordance with the recognition and measurement principle laid down in the IND-AS-34, interim financial reporting prescribed under section 133 of the Companies Act, 2013 read with the Companies (Indian Accounting Standards) Rules 2015 (IND-AS) and other accounting principles generally accepted in India. Accordingly figures for previous periods are re-casted / regrouped as per new requirements, wherever necessary.
2. Statement of Reconciliation of net profit after tax under IND-AS and net
profit after tax reported under previous Indian GAAP for the Quarter and Nine
Months ended on 31st December, 2016 is as under.
3. Revenue from operations for the quarter ended on 30th September 2017 &
31st December 2017 are net off Goods and Service Tax whereas for the other
periods presented, it is gross of excise duty (which has been presented
separately under total expenses). Accordingly, revenue from operations for the
quarter and nine months ended on 31st December 2017 is not comparable with
previous periods.
4. Revenue from operations for nine months ended 31.12.2017 includes other
operating revenue of INR 52.800 Million (net of GST credit) (For Dec'17 Qtr INR
41.300 Million and For Sept'17 Qtr INR 11.500 Million) by way of eligible
reimbursement of which CGST/ IGST is of INR 19.100 Million & SGST is of INR
22.200 Million for the quarter. Company has recognised the eligible reimbursement
of INR 19.100 Million based on notification no. F.No.10 (1)/2017-DBA-II/NER
dated 05th October, 2017 and INR 22.200 Million of SGST pending notification
for prescribed procedures for formal claim. The claim for CGST/IGST of INR
11.500 Million is submitted to the authority & balance of INR 19.100
Million for the current quarter is to be submitted.
5. The other income for nine months ended 31.12.17 includes INR 72.300 Million
(For Dec'17 Qtr INR 16.000 Million, For Sept’17 Qtr INR 45.200 Million) under
the head finance income. This amount is reversal of loss {on redemption)
recognised in opening equity on the date of transition on investment held by
the company in preference shares of its holding company. The Other income,
interalia, also includes interest charged to subsidiaries INR 41.000 Million
(For Dec'17 Qtr Rs. 150 lakhs For Sept'17 Qtr INR 11.800 Million, For Dec'16
Qtr INR 16.100 Million) and foreign exchange fluctuation gain of INR 12.900
Million (For Dec'17 Qtr Rs. -64 lakhs, For Sept'17 Qtr INR 12.700 Million, For
Dec'16 Qtr INR Nil).
6. The company has changed accounting policy of certain expenses
retrospectively. The impact of said change in accounting policy has been
recognised in opening equity on the date of transition and consequential impact
related to quarterly financial results presented above has been duly reflected
in said financial results.
7. The financial results for the quarter ended on 31st December 2017 have been
reviewed by the statutory auditors. The comparative IND-As compliant figures
for the quarter ended 31*' December 2016 and Nine months ended on 31st December
2016 have neither been audited nor reviewed by the statutory auditors and are
compiled by the management after exercising necessary due diligence to ensure
that such financial results provide a true and fair view of the Company's
affairs.
8. The Company operates in one segment viz Auto Components and accordingly
there are no separate reportable segments.
9. The above financial results were reviewed and recommended by the Audit
Committee at its meeting held on 14th February 2018 and subsequently approved
by the Board of Directors at its meeting held on 14th February 2018.
10. The figures for the previous periods have been regrouped/re-classified
wherever necessary to correspond with the figure of the current period.
CONTINGENT
LIABILITIES: (As on 31.03.2017)
i) Guarantees given by the bank on behalf of the Company INR 11.492 Million (INR 11.232 Million).
ii) Guarantee given for £ 1.40 million (£ 1.40 million) to ICICI Bank Limited, U.K. for Wholly Owned Ultimate Foreign Subsidiary’s credit facilities INR 114.030 Million (INR 133.798 Million).
iii) Guarantee given for $ 4.00 million ($ 4.00 million) to Bank of Baroda, New York, USA for Wholly Owned Ultimate Foreign Subsidiary’s credit facilities INR 260.760 Million (INR 266.400 Million).
iv) Guarantee given for INR 1832.600 Million (INR 1832.600 Million) to Bank of Baroda, Mumbai, India, for subsidiary’s credit facilities.
v) Warranty Claims raised by Customer but not acknowledged as debt INR Nil (INR 11.899 Million).
FIXED ASSETS:
Tangible Assets
- Freehold Land
- Lease Hold Land
- Buildings
- Plant and Machinery
- Furniture’s and Fixtures
- Office Equipments
- Pollution Equipments
- Computers
- Electric Fittings
- Vehicles
Intangible Assets
- Goodwill
- Product Development
- Technical Know how
- Computer Software
- Web Site Development
CMT REPORT (Corruption, Money Laundering & Terrorism]
The Public Notice information has been collected from various sources
including but not limited to: The Courts, India Prisons Service,
Interpol, etc.
1] INFORMATION ON
DESIGNATED PARTY
No records exist designating subject or any of its beneficial owners,
controlling shareholders or senior officers as terrorist or terrorist
organization or whom notice had been received that all financial transactions
involving their assets have been blocked or convicted, found guilty or against
whom a judgement or order had been entered in a proceedings for violating
money-laundering, anti-corruption or bribery or international economic or
anti-terrorism sanction laws or whose assets were seized, blocked, frozen or
ordered forfeited for violation of money laundering or international
anti-terrorism laws.
2] Court Declaration :
No records exist to suggest that subject is
or was the subject of any formal or informal allegations, prosecutions or other
official proceeding for making any prohibited payments or other improper
payments to government officials for engaging in prohibited transactions or
with designated parties.
3] Asset Declaration :
No records exist to suggest that the property or assets of the subject
are derived from criminal conduct or a prohibited transaction.
4] Record on Financial
Crime :
Charges or conviction
registered against subject: None
5] Records on Violation of
Anti-Corruption Laws :
Charges or
investigation registered against subject: None
6] Records on Int’l
Anti-Money Laundering Laws/Standards :
Charges or
investigation registered against subject: None
7] Criminal Records
No
available information exist that suggest that subject or any of its principals
have been formally charged or convicted by a competent governmental authority
for any financial crime or under any formal investigation by a competent government
authority for any violation of anti-corruption laws or international anti-money
laundering laws or standard.
8] Affiliation with
Government :
No record
exists to suggest that any director or indirect owners, controlling
shareholders, director, officer or employee of the company is a government
official or a family member or close business associate of a Government
official.
9] Compensation Package :
Our market
survey revealed that the amount of compensation sought by the subject is fair
and reasonable and comparable to compensation paid to others for similar
services.
10] Press Report :
No press reports / filings exists on
the subject.
CORPORATE GOVERNANCE
MIRA INFORM as part of its Due Diligence do provide comments on
Corporate Governance to identify management and governance. These factors often
have been predictive and in some cases have created vulnerabilities to credit
deterioration.
Our Governance Assessment focuses principally on the interactions
between a company’s management, its Board of Directors, Shareholders and other
financial stakeholders.
CONTRAVENTION
Subject is not known to have contravened any existing local laws,
regulations or policies that prohibit, restrict or otherwise affect the terms
and conditions that could be included in the agreement with the subject.
FOREIGN EXCHANGE RATES
|
Currency |
Unit
|
INR |
|
US Dollar |
1 |
INR 67.96 |
|
UK Pound |
1 |
INR 91.88 |
|
Euro |
1 |
INR 80.28 |
INFORMATION DETAILS
|
Information
Gathered by : |
SUP |
|
|
|
|
Analysis Done by
: |
NIY |
|
|
|
|
Report Prepared
by : |
IND |
SCORE FACTORS
|
DEMERIT POINTS |
|
|
|
--BANK CHARGES |
YES/NO |
YES |
|
--LITIGATION |
YES/NO |
NO |
|
--OTHER ADVERSE INFORMATION |
YES/NO |
NO |
|
MERIT POINTS |
|
|
|
--SOLE DISTRIBUTORSHIP |
YES/NO |
NO |
|
--EXPORT ACTIVITIES |
YES/NO |
NO |
|
--AFFILIATION |
YES/NO |
YES |
|
--LISTED |
YES/NO |
YES |
|
--OTHER MERIT FACTORS |
YES/NO |
YES |
RATING EXPLANATIONS
|
Credit Rating |
Explanation |
Rating Comments |
|
A++ |
Minimum Risk |
Business dealings permissible with minimum
risk of default |
|
A+ |
Low Risk |
Business dealings permissible with low
risk of default |
|
A |
Acceptable Risk |
Business dealings permissible with
moderate risk of default |
|
B |
Medium Risk |
Business dealings permissible on a regular
monitoring basis |
|
C |
Medium High Risk |
Business dealings permissible preferably
on secured basis |
|
D |
High Risk |
Business dealing not recommended or on
secured terms only |
|
NB |
New Business |
No recommendation can be done due to
business in infancy stage |
|
NT |
No Trace |
No recommendation can be done as the
business is not traceable |
NB is stated where there is insufficient information to facilitate rating. However, it is not to be considered as unfavourable.
This score serves as a reference to assess
SC’s credit risk and to set the amount of credit to be extended. It is
calculated from a composite of weighted scores obtained from each of the major
sections of this report. The assessed factors are as follows:
·
Financial
condition covering various ratios
·
Company
background and operations size
·
Promoters
/ Management background
·
Payment
record
·
Litigation
against the subject
·
Industry
scenario / competitor analysis
·
Supplier
/ Customer / Banker review (wherever available)
This report is issued at
your request without any risk and responsibility on the part of MIRA INFORM
PRIVATE LIMITED (MIPL) or its officials.