|
|
|


MIRA INFORM REPORT
|
Report No. : |
509887 |
|
Report Date : |
24.05.2018 |
IDENTIFICATION DETAILS
|
Name : |
PRINTFA SL |
|
|
|
|
Registered Office : |
C/ Can Milans, 14. - Montcada I Reixac - 08110 - Barcelona |
|
|
|
|
Country : |
Spain |
|
|
|
|
Financials (as on) : |
2016 |
|
|
|
|
Date of Incorporation : |
17.02.2012 |
|
|
|
|
Legal Form : |
Private Company |
|
|
|
|
Line of Business : |
Manufacture of plastic packing goods |
|
|
|
|
No. of Employees : |
24 |
RATING & COMMENTS
(Mira Inform has adopted New Rating mechanism w.e.f. 23rd
January 2017)
|
MIRA’s Rating : |
B |
|
Credit Rating |
Explanation |
Rating Comments |
|
B |
Medium Risk |
Business dealings permissible on a regular
monitoring basis |
|
Maximum Credit Limit : |
Euro 310.000 |
|
|
|
|
Status : |
Moderate |
|
|
|
|
Payment Behaviour : |
Slow but Correct |
|
|
|
|
Litigation : |
Clear |
NOTES :
Any query related to this report can be made
on e-mail : infodept@mirainform.com
while quoting report number, name and date.
ECGC Country Risk Classification List
|
Country Name |
Previous Rating (30.09.2017) |
Current Rating (31.12.2017) |
|
Spain |
A1 |
A1 |
|
Risk Category |
ECGC
Classification |
|
Insignificant |
A1 |
|
Low Risk |
A2 |
|
Moderately Low Risk |
B1 |
|
Moderate Risk |
B2 |
|
Moderately High Risk |
C1 |
|
High Risk |
C2 |
|
Very High Risk |
D |
SPAIN - ECONOMIC OVERVIEW
After a prolonged recession that began in 2008 in the wake of the global financial crisis, Spain marked the fourth full year of positive economic growth in 2017, with economic activity surpassing its pre-crisis peak, largely because of increased private consumption. The financial crisis of 2008 broke 16 consecutive years of economic growth for Spain, leading to an economic contraction that lasted until late 2013. In that year, the government successfully shored up its struggling banking sector - heavily exposed to the collapse of Spain’s real estate boom - with the help of an EU-funded restructuring and recapitalization program.
Until 2014, contraction in bank lending, fiscal austerity, and high unemployment constrained domestic consumption and investment. The unemployment rate rose from a low of about 8% in 2007 to more than 26% in 2013, but labor reforms prompted a modest reduction to 16.4% in 2017. High unemployment strained Spain's public finances, as spending on social benefits increased while tax revenues fell. Spain’s budget deficit peaked at 11.4% of GDP in 2010, but Spain gradually reduced the deficit to about 3.3% of GDP in 2017. Public debt has increased substantially – from 60.1% of GDP in 2010 to nearly 96.7% in 2017.
Strong export growth helped bring Spain's current account into surplus in 2013 for the first time since 1986 and sustain Spain’s economic growth. Increasing labor productivity and an internal devaluation resulting from moderating labor costs and lower inflation have improved Spain’s export competitiveness and generated foreign investor interest in the economy, restoring FDI flows.
In 2017, the Spanish Government’s minority status constrained its ability to implement controversial labor, pension, health care, tax, and education reforms. The European Commission expects the government to meet its 2017 budget deficit target and anticipates that expected economic growth in 2018 will help the government meet its deficit target. Spain’s borrowing costs are dramatically lower since their peak in mid-2012, and increased economic activity has generated a modest level of inflation, at 2% in 2017.
|
Source
: CIA |
EXECUTIVE
SUMMARY
|
|
|
|
|
|
Name: |
PRINTFA SL |
|
NIF / Fiscal code: |
B65740714 |
|
Trade Name |
PRINTFA SL |
|
Status: |
ACTIVE |
|
Incorporation Date: |
17/02/2012 |
|
Register Data |
Register Section 8 Sheet 420966 |
|
Last Publication in
BORME: |
12/05/2016 [Increase of Capital] |
|
Last Published Account Deposit: |
2016 |
|
Share Capital: |
803.006 |
|
|
|
|
Localization: |
C/ CAN MILANS, 14. - MONTCADA I REIXAC - 08110 - BARCELONA |
|
Telephone - Fax - Email - Website: |
Telephone. 933 803 535 Email. info@printfa.net Website. www.printfa.net |
|
|
|
|
Activity: |
|
|
NACE: |
2222 - Manufacture of plastic packing goods |
|
Registered Trademarks: |
|
|
Audited / Opinion: |
No |
|
Tenders and Awards: |
|
|
Subsidies: |
0 for a total cost of 0 |
|
Quality Certificate: |
No |
|
|
|
|
Maximum recommended commercial credit: |
310.000 |
|
Payment Behaviour: |
Slow
but Correct |
|
Prospects: |
Consolidation |
|
Industry situation: |
Maturity |
|
|
|
|
Defaults, Legal
Claims and Insolvency Proceedings : |
|
|
|
|
|
|
|
Number |
Amount (€) |
Most Recent Entry |
|
Insolvency Proceedings, Bankruptcy and Suspension of Payments |
|
Unpublished |
--- |
--- |
|
Defaults on debt with Financial Institutions and Large Companies |
|
None |
--- |
--- |
|
Judicial Claims (Notices, Executive Proceedings, Attachments,
Auctions, Bad Debt) |
|
None |
0 |
--- |
|
Proceedings heard by the Civil Court |
|
Unpublished |
0 |
--- |
|
Proceedings heard by the Labour Court |
|
Unpublished |
0 |
--- |
|
|
|
Partners: |
|
|
|
LIONEL CHARLES TIXIER |
|
|
|
Shares: |
0 |
|
|
Other Links: |
0 |
|
|
No. of Active Corporate Bodies: |
SINGLE ADMINISTRATOR 1 |
|
|
Ratios |
2016 |
2015 |
Change |
|
|
Nº of employees: |
24 |
|
|
|
|
|
|
|
Guarantees: |
|
|
Properties Registered: |
Company NO, Administrator NO |
|
Financing / Guarantee Sources : |
Sources YES, Guarantees NO |
|
|
|
|
|
|
|
INVESTIGATION SUMMARY |
|
|
The company was incorporated in February 2002, with a shareholder
equity that amounted to Euro 80,3006. It is engaged in the manufacture of
containers. |
|
|
Interviewed Person: |
|
|
Enquiry
Details
|
|
|
|
|
Social Denomination: |
PRINTFA SL |
|
Trade Name: |
PRINTFA SL |
|
NIF / Fiscal code: |
B65740714 |
|
Corporate Status: |
ACTIVE |
|
Start of activity: |
17/02/2012 |
|
Registered Office: |
C/ CAN MILANS,
14. |
|
Locality: |
MONTCADA I
REIXAC |
|
Province: |
BARCELONA |
|
Postal Code: |
08110 |
|
Telephone: |
933 803 535 |
|
Fax: |
933 803 552 |
|
Website: |
www.printfa.net |
|
Email: |
info@printfa.net |
|
Interviewed Person: |
Administration |
|
Branch Offices |
|
|
|
|
|
Activity
|
|
|
NACE: |
2222 |
|
Corporate Purpose: |
The company is
engaged in the import, manufacture, manipulation and printing of packaging
products for a subsequent marketing and distribution, printing of texts and
images by any system or procedure. |
|
Additional Information: |
The subject is
also engaged in the aluminium engraved hole printing for the pharmaceutical
firms, manufacture and supply of flexible materials for the pharmaceutical
industry. |
|
Additional Address: |
The Registered
Office, manufacturing plant and offices are located at the heading address,
with 3200 m2 of surface. |
|
Franchise: |
No |
|
Import / export: |
DOES NOT
IMPORT / SI EXPORT |
|
Future Perspective: |
Consolidation |
|
Industry situation: |
Maturity |
|
Number
of Employees
|
|
|
|
|
|
|
Year |
No. of employees |
Established |
Incidentals |
|
|
|
2016 |
24 |
|
|
|
|
|
2017 |
43 |
|
|
|
The data of
employees is from the latest available financial statements in. Failing that, are
estimates data calculated by statistical methods
|
Chronological
Summary
|
|||
|
|
|
|
|
|
|
Year |
Act |
|
|
|
2012 |
Appointments/ Re-elections (1) Company Formation (1) |
|
|
|
2013 |
Accounts deposit (year 2012) |
|
|
|
2014 |
Accounts deposit (year 2013) Appointments/ Re-elections
(1) Change of Social Purpose (1) Change of Social address (1) Increase of
Capital (1) Statutory Modifications (1) |
|
|
|
2015 |
Accounts deposit (year 2014) |
|
|
|
2016 |
Accounts deposit (year 2015) Increase of Capital (1) |
|
|
|
2017 |
Accounts deposit (year 2016) |
|
Main
Historic Changes
|
|||
|
|
|
|
|
|
Concept |
Publication |
Act |
Date |
|
Corporate Purpose Changes: |
LA IMPORTACION,FABRICACION,MANIPULACION,E IMPRESION DE
ARTICULOS DE EMBALAJE PARA SU POSTERIOR COMERCIALIZACION Y DISTRIBUCION |
Company Formation |
28/03/2012 |
|
Breakdown
of Owners' Equity
|
|
|
Registered Capital: |
803.006 |
|
Paid up capital: |
803.006 |
|
Updated
Evolution of the Subscribed and Paid-in Capital
|
|||||
|
|
|
|
|
|
|
|
|
|||||
|
|
|
|
|
|
|
|
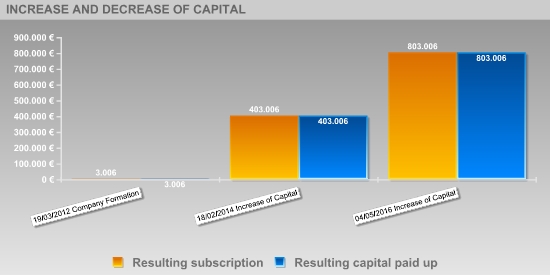
Publishing Date |
Registration Type |
Capital Subscribed |
Paid up capital |
Underwritten result |
Disbursed Result |
|
19/03/2012 |
Company Formation |
3.006 |
3.006 |
3.006 |
3.006 |
|
18/02/2014 |
Increase of Capital |
400.000 |
400.000 |
403.006 |
403.006 |
|
04/05/2016 |
Increase of Capital |
400.000 |
400.000 |
803.006 |
803.006 |
Founding
Partners
|
|
|
|
|
|
|
Partner Name |
NIF |
% Shareholding stake |
|
|
|
LIONEL CHARLES TIXIER |
|
|
|
|
|
LAURENT OILIVIER TIXIER |
|
|
|
|
Active
Social Bodies
|
|
|
|
|
|
Post published |
Social Body's Name |
Appointment Date |
Other Positions in this Company |
|
SINGLE ADMINISTRATOR |
LIONEL CHARLES TIXIER |
19/03/2012 |
1 |
|
JOINT ATTORNEY |
LAURENT OLIVIER TIXIER |
28/08/2014 |
1 |
|
Historical
Social Bodies
|
|
|
|
|
|
Social Body's Name |
Post published |
End Date |
Other Positions in this Company |
|
|
| //c\\ |
|
|
|
Executive
board
|
||
|
|
|
|
|
Post |
NIF |
Name |
|
ADMINISTRATOR UNICO |
|
LIONEL CHARLES TIXIER |
|
APODERADO |
|
LAURENT OLIVIER TIXIER |
Defaults,
Legal Claims and Insolvency Proceedings
|
|
|
|
|
Section enabling assessment of the degree of compliance of the
company queried with its payment obligations. It provides information on the
existence and nature of all stages of Insolvency and Legal Proceedings
published with reference to the Company in the country's various Official
Bulletins and national newspapers, as well Defaults Registered in the main
national credit bureaus (ASNEF Industrial and RAI ).
> Summary
Chronological summary
|
|
|
Number of Publications |
Amount (€) |
Start date |
End date |
|
Insolvency Proceedings, Bankruptcy and Suspension of Payments |
|
Unpublished |
--- |
--- |
--- |
|
Request/Declaration |
|
0 |
--- |
date |
|
|
Proceedings |
|
--- |
--- |
|
--- |
|
Resolution |
|
--- |
--- |
|
--- |
|
Defaults on debt with Financial Institutions and Large Companies |
Bank and Commercial Delinquency |
None |
0 |
|
|
|
Status: Friendly |
|
--- |
|
|
|
|
Status: Pre-Litigation |
|
--- |
|
|
|
|
Status: Litigation |
|
--- |
|
|
|
|
Status: Non-performing |
|
--- |
|
|
|
|
Status: insolvency proceedings, bankruptcy and suspension of payments |
|
--- |
|
|
|
|
Other status |
|
--- |
|
|
|
|
Legal and Administrative Proceedings |
|
Unpublished |
--- |
|
|
|
Notices of defaults and enforcement |
|
--- |
--- |
|
--- |
|
Seizures |
|
--- |
--- |
|
--- |
|
Auctions |
|
--- |
--- |
|
--- |
|
Declarations of insolvency and bad debt |
|
--- |
--- |
|
--- |
|
Proceedings heard by the Civil Court |
|
Unpublished |
--- |
|
|
|
Proceedings heard by the Labour Court |
|
Unpublished |
--- |
|
|
> Details
> Basis for scoring
|
Positive Factors |
Adverse Factors |
|
No judicial claims have been detected in the Official Gazettes, regarding any Entity's outstanding debts with the Tax Bureau or Social Security administrations, as submitted by Courts of the various court jurisdictions. No irregular payment performance has been detected based on information obtained from credit bureaus. PRINTFA SL obtains economic profitability from the necessary investments in the development of its activity in comparison with its assets. High financial profitability. Net return from the company's main activity performed using its own equity is high. This income return has decreased in comparison with the previous financial year. Positive Working CapitalThe Company's Working Capital quality is significant, i.e. much of the Company financing comes from its equity. A structure is considered optimal if its liquidity level is slightly above its debt volume as a result of low idleness levels of its financial resources involved. |
PRINTFA SL has a tight level of Financial Autonomy. The Internal Funds of the entity represent the 13.63% of the total amount of funding sources. The current debt represents a 56.71 % of the financial structure. In principle, a decrease in this ratio would indicate an improvement in the short-term financial situation. Reduced cash level and other liquid assets equivalent in relation to the volume of operations held. In principle, a decrease in this ratio would indicate a worsening in the Company's financial situation. No Company's subsidiaries or branches are known. Although it is in a new stage of Consolidationit is part of a group distinguished by a downturn in the market. |
Probability
of default
|
> Estimated Probability of Default for the next 12 months: 5.395 %
|
Sector in which comparison is carried out: 222 Manufacture of plastics products |
|
|
Relative Position:
|
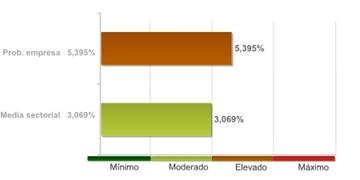
The company's comparative analysis with the rest of the companies that comprise the sector, shows the company holds a worse position with regard to the probability of non-compliance.
The 27.00% of the companies of the sector PRINTFA SL belongs to shows a lower probability of non-compliance.
The probability of the company's non-compliance with its payment obligations within deadlines estimated by our qualifications models is 5,395%.
In the event they fail to comply with the payment, the seriousness of the loss will depend on factors such as the promptness of the commencement of the charging management, the existence of executive documents which match the credit or the existence of guarantees and free debt assets under the name of the debtor. Therefore, the probability of non-compliance should not be solely interpreted as the total loss of the owed amount.
Recommended
commercial credit
|
|
|
|
|
Favourable until 310.000 € (Guideline value
of outstanding commercial balance that recommends be awarded to or maintained
with the company queried)
|
Result
of query submitted to the R.A.I. (Spanish Bad Debt Register) on
|
|
|
|
Summary of Judicial Claims |
|
|
|
|
|
|
|
|
||
|
|
|
Not published |
|
|
|
|
Not published |
|
|
|
|
||
|
|
|
Not published |
|
|
|
|
Not published |
|
|
|
|
Not published |
|
|
|
|
Not published |
|
|
|
|
||
|
|
|
Not published |
|
|
|
|
Not published |
|
|
|
|
||
|
|
|
Not published |
|
|
Guarantees
|
|
References |
|
|
|
|
|
|
Suppliers |
|
|
|
Name |
NIF |
Telephone |
|
|
|
AMCOR SA |
|
|
|
|
|
HIDRO SL |
|
|
|
Link List
|
|
|
|
|
|
SHAREHOLDERS: |
1 Entities |
>
Shareholders
|
Relationship |
Entity |
Province |
Shareholding
stake |
|
SHAREHOLDERS |
LIONEL CHARLES
TIXIER |
|
|
|
Turnover
|
|
|
Total Sales 2016 |
7.186.727,03 |
The sales data is
from the latest available financial statements in. Failing that, are estimates
data calculated by statistical methods.
Estimated
Balance
|
|
This is a low-level company, whose volumen of business for the 2016 fiscal year increased by 63%; closing in positive, after years of losses. The Balance Sheet shows a very tight financial status, as evidenced by the ratios of Long-term Confidence (1/1), Liquidity (1.2/1), Treasury (0.8/1) and Total Solvency (1.1/1). |
Financial
Accounts and Balance Sheets
|
|
Ejercicio |
Tipo de Cuentas Anuales |
Fecha Presentacion |
|
2016 |
Normales |
May 2017 |
|
2015 |
Normales |
October 2016 |
|
2014 |
Normales |
September 2015 |
|
2013 |
Normales |
August 2014 |
|
2012 |
Normales |
October 2013 |
The data in the report
regarding the last Company Accounts submitted by the company is taken from the
TRADE REGISTER serving the region in which the company's address is located 31/12/2016
> Balance en formato Pyme de acuerdo al Nuevo Plan
General Contable 2007
Information
corresponding to the fiscal year
2016 2015 2014 2013 2012 is taken from information
submitted to the TRADE REGISTER. Data corresponding to fiscal years before
2016 2015 2014 2013 2012 has been compiled based on
the equivalence criteria stipulated in Act JUS/206/2009. Where the provisions
of the Act did not establish relevant equivalence criteria. To view details on
the methodology.
|
|
ORIGINAL |
ORIGINAL |
ORIGINAL |
ORIGINAL |
ORIGINAL |
|
|
Assets |
2016 |
2015 |
2014 |
2013 |
2012 |
|
|
A) NON-CURRENT ASSETS: 11000 |
1.793.527,00 |
1.836.117,00 |
1.530.702,00 |
0,00 |
0,00 |
|
|
I. Intangible fixed assets : 11100 |
40.558,00 |
29.787,00 |
5.296,00 |
0,00 |
0,00 |
|
|
II. Tangible fixed assets : 11200 |
1.735.074,00 |
1.780.964,00 |
1.500.040,00 |
0,00 |
0,00 |
|
|
III. Real estate investment: 11300 |
0,00 |
0,00 |
0,00 |
0,00 |
0,00 |
|
|
IV. Long-term investments in Group
companies and associates : 11400 |
0,00 |
0,00 |
0,00 |
0,00 |
0,00 |
|
|
V. Long-term financial investments:
11500 |
17.895,00 |
25.366,00 |
25.366,00 |
0,00 |
0,00 |
|
|
VI. Assets for deferred tax : 11600 |
0,00 |
0,00 |
0,00 |
0,00 |
0,00 |
|
|
VII. Non-current trade debtors :
11700 |
0,00 |
0,00 |
0,00 |
0,00 |
0,00 |
|
|
B) CURRENT ASSETS: 12000 |
4.210.922,00 |
2.518.966,00 |
1.688.264,00 |
3.728,00 |
3.049,00 |
|
|
I. Stocks : 12200 |
1.444.780,00 |
771.319,00 |
329.947,00 |
0,00 |
0,00 |
|
|
II. Trade debtors and others receivable
accounts : 12300 |
2.660.783,00 |
1.724.683,00 |
1.197.316,00 |
122,00 |
43,00 |
|
|
1. Trade debtors /
accounts receivable: 12380 |
2.655.161,00 |
1.669.243,00 |
797.290,00 |
0,00 |
0,00 |
|
|
a) Long-term receivables from sales and services supplied : 12381 |
0,00 |
0,00 |
0,00 |
0,00 |
0,00 |
|
|
b) Customers for sales and provisions of services : 12382 |
2.655.161,00 |
1.669.243,00 |
797.290,00 |
0,00 |
0,00 |
|
|
2. Called up share
capital: 12370 |
0,00 |
0,00 |
0,00 |
0,00 |
0,00 |
|
|
3. Other accounts
receivable : 12390 |
5.622,00 |
55.439,00 |
400.026,00 |
122,00 |
43,00 |
|
|
III. Short-term investment in Group
companies and associates: 12400 |
0,00 |
0,00 |
0,00 |
0,00 |
0,00 |
|
|
IV. Short-term financial investments :
12500 |
0,00 |
0,00 |
0,00 |
0,00 |
0,00 |
|
|
V. Short-term accruals : 12600 |
0,00 |
1.206,00 |
0,00 |
0,00 |
0,00 |
|
|
VI. Cash and other equivalent liquid assets
: 12700 |
105.360,00 |
21.758,00 |
161.001,00 |
3.606,00 |
3.006,00 |
|
|
TOTAL ASSETS (A + B) : 10000 |
6.004.449,00 |
4.355.083,00 |
3.218.967,00 |
3.728,00 |
3.049,00 |
|
|
|
ORIGINAL |
ORIGINAL |
ORIGINAL |
ORIGINAL |
ORIGINAL |
|
|
Liabilities and Net Worth |
2016 |
2015 |
2014 |
2013 |
2012 |
|
|
A) NET WORTH: 20000 |
818.495,00 |
204.036,00 |
357.440,00 |
2.404,00 |
2.781,00 |
|
|
A-1) Shareholders' equity: 21000 |
818.495,00 |
204.036,00 |
357.440,00 |
2.404,00 |
2.781,00 |
|
|
I. Capital: 21100 |
803.006,00 |
403.006,00 |
403.006,00 |
3.006,00 |
3.006,00 |
|
|
1. Registered capital
: 21110 |
803.006,00 |
403.006,00 |
403.006,00 |
3.006,00 |
3.006,00 |
|
|
2. (Uncalled capital):
21120 |
0,00 |
0,00 |
0,00 |
0,00 |
0,00 |
|
|
II. Share premium: 21200 |
0,00 |
0,00 |
0,00 |
0,00 |
0,00 |
|
|
III. Reserves: 21300 |
0,00 |
0,00 |
0,00 |
0,00 |
0,00 |
|
|
1. Capitalisation
Reserves: 21350 |
0,00 |
0,00 |
0,00 |
0,00 |
0,00 |
|
|
2. Otras Reservas:
21360 |
0,00 |
0,00 |
0,00 |
0,00 |
0,00 |
|
|
IV. (Common stock equity): 21400 |
0,00 |
0,00 |
0,00 |
0,00 |
0,00 |
|
|
V. Profit or loss brought forward:
21500 |
-198.970,00 |
-45.566,00 |
-602,00 |
-225,00 |
0,00 |
|
|
VI. Other shareholders'
contributions: 21600 |
0,00 |
0,00 |
0,00 |
0,00 |
0,00 |
|
|
VII. Result of the period: 21700 |
214.459,00 |
-153.405,00 |
-44.964,00 |
-377,00 |
-225,00 |
|
|
VIII. (Interim dividend): 21800 |
0,00 |
0,00 |
0,00 |
0,00 |
0,00 |
|
|
A-2) Changes in net worth : 22000 |
0,00 |
0,00 |
0,00 |
0,00 |
0,00 |
|
|
A-3) Received subsidies, donations and legacies: 23000 |
0,00 |
0,00 |
0,00 |
0,00 |
0,00 |
|
|
B) NON-CURRENT LIABILITIES: 31000 |
1.775.406,00 |
1.307.092,00 |
1.442.484,00 |
0,00 |
0,00 |
|
|
I. Long-term provisions: 31100 |
0,00 |
0,00 |
0,00 |
0,00 |
0,00 |
|
|
II. Long-term creditors : 31200 |
1.244.106,00 |
1.307.092,00 |
1.442.484,00 |
0,00 |
0,00 |
|
|
1. Amounts owed to
credit institutions: 31220 |
1.244.106,00 |
990.145,00 |
1.277.603,00 |
0,00 |
0,00 |
|
|
2. Creditors from
financial leasing : 31230 |
0,00 |
116.947,00 |
164.880,00 |
0,00 |
0,00 |
|
|
3. Other long-term
creditors : 31290 |
0,00 |
200.000,00 |
0,00 |
0,00 |
0,00 |
|
|
III. Long-term debts with Group companies
and associates: 31300 |
531.300,00 |
0,00 |
0,00 |
0,00 |
0,00 |
|
|
IV. Liabilities for deferred tax:
31400 |
0,00 |
0,00 |
0,00 |
0,00 |
0,00 |
|
|
V. Long-term accruals: 31500 |
0,00 |
0,00 |
0,00 |
0,00 |
0,00 |
|
|
VI. Non-current trade creditors :
31600 |
0,00 |
0,00 |
0,00 |
0,00 |
0,00 |
|
|
VII. Special long-term debts : 31700 |
0,00 |
0,00 |
0,00 |
0,00 |
0,00 |
|
|
C) CURRENT LIABILITIES : 32000 |
3.405.386,00 |
2.843.956,00 |
1.419.042,00 |
1.324,00 |
268,00 |
|
|
I. Short-term provisions: 32200 |
0,00 |
0,00 |
0,00 |
0,00 |
0,00 |
|
|
II. Short-term creditors : 32300 |
1.076.743,00 |
1.006.593,00 |
455.250,00 |
600,00 |
0,00 |
|
|
1. Amounts owed to
credit institutions: 32320 |
1.076.743,00 |
941.629,00 |
149.635,00 |
0,00 |
0,00 |
|
|
2. Creditors from
financial leasing : 32330 |
0,00 |
47.913,00 |
38.120,00 |
0,00 |
0,00 |
|
|
3. Other short-term
creditors : 32390 |
0,00 |
17.051,00 |
267.495,00 |
600,00 |
0,00 |
|
|
III. Short-term amounts owed to group and
associated companies: 32400 |
0,00 |
321.000,00 |
0,00 |
0,00 |
0,00 |
|
|
IV. Trade creditors and other accounts
payable: 32500 |
2.328.643,00 |
1.516.363,00 |
963.792,00 |
724,00 |
268,00 |
|
|
1. Suppliers:
32580 |
1.775.060,00 |
931.390,00 |
600.290,00 |
0,00 |
0,00 |
|
|
a)
Long-term debts : 32581 |
0,00 |
0,00 |
0,00 |
0,00 |
0,00 |
|
|
b) Short-term debts : 32582 |
1.775.060,00 |
931.390,00 |
600.290,00 |
0,00 |
0,00 |
|
|
2. Other creditors:
32590 |
553.583,00 |
584.973,00 |
363.503,00 |
724,00 |
268,00 |
|
|
V. Short-term accruals : 32600 |
0,00 |
0,00 |
0,00 |
0,00 |
0,00 |
|
|
VI. Special short-term debts : 32700 |
0,00 |
0,00 |
0,00 |
0,00 |
0,00 |
|
|
TOTAL NET WORTH AND LIABILITIES (A + B + C) : 30000 |
6.004.449,00 |
4.355.083,00 |
3.218.967,00 |
3.728,00 |
3.049,00 |
|
|
|
ORIGINAL |
ORIGINAL |
ORIGINAL |
ORIGINAL |
ORIGINAL |
|
|
Profit and Loss |
2016 |
2015 |
2014 |
2013 |
2012 |
|
|
1. Net turnover: 40100 |
7.186.727,00 |
4.403.058,00 |
2.378.999,00 |
0,00 |
0,00 |
|
|
2. Changes in stocks of finished goods and
work in progress: 40200 |
0,00 |
0,00 |
0,00 |
0,00 |
0,00 |
|
|
3. Works carried out by the company for its
assets: 40300 |
0,00 |
25.698,00 |
0,00 |
0,00 |
0,00 |
|
|
4. Supplies : 40400 |
-4.851.061,00 |
-2.772.137,00 |
-1.425.887,00 |
0,00 |
0,00 |
|
|
5. Other operating income: 40500 |
5.808,00 |
8.208,00 |
0,00 |
0,00 |
0,00 |
|
|
6. Personnel costs: 40600 |
-779.815,00 |
-626.684,00 |
-223.285,00 |
0,00 |
0,00 |
|
|
7. Other operating costs: 40700 |
-951.254,00 |
-879.904,00 |
-654.299,00 |
-377,00 |
-225,00 |
|
|
8. Amortisation of fixed assets:
40800 |
-257.653,00 |
-194.359,00 |
-61.928,00 |
0,00 |
0,00 |
|
|
9. Allocation of subsidies of non-financial
fixed assets and other: 40900 |
0,00 |
0,00 |
0,00 |
0,00 |
0,00 |
|
|
10. Excess provisions : 41000 |
0,00 |
0,00 |
0,00 |
0,00 |
0,00 |
|
|
11. Impairment and result of transfers of
fixed assets: 41100 |
0,00 |
0,00 |
0,00 |
0,00 |
0,00 |
|
|
12. Other results : 41300 |
2.566,00 |
2.479,00 |
0,00 |
0,00 |
0,00 |
|
|
A) OPERATING INCOME (1 + 2 + 3 + 4 + 5 + 6 + 7 + 8 + 9 + 10 + 11
+ 12) : 49100 |
355.317,00 |
-33.640,00 |
13.599,00 |
-377,00 |
-225,00 |
|
|
13. Financial income : 41400 |
8,00 |
336,00 |
14,00 |
0,00 |
0,00 |
|
|
a) Allocation of
financial subsidies, donations and legacies: 41430 |
0,00 |
0,00 |
0,00 |
0,00 |
0,00 |
|
|
b) Other financial
income: 41490 |
8,00 |
336,00 |
14,00 |
0,00 |
0,00 |
|
|
14. Financial expenditure : 41500 |
-135.704,00 |
-120.101,00 |
-57.832,00 |
0,00 |
0,00 |
|
|
15. Changes in fair value of financial
instruments : 41600 |
0,00 |
0,00 |
0,00 |
0,00 |
0,00 |
|
|
16. Exchange rate differences: 41700 |
0,00 |
0,00 |
-745,00 |
0,00 |
0,00 |
|
|
17. Impairment and result for transfers of
financial instruments : 41800 |
0,00 |
0,00 |
0,00 |
0,00 |
0,00 |
|
|
18. Other financial income and expenditure:
42100 |
0,00 |
0,00 |
0,00 |
0,00 |
0,00 |
|
|
a) Incorporation of
financial expenditure to assets: 42110 |
0,00 |
0,00 |
0,00 |
0,00 |
0,00 |
|
|
b) Financial income from
arrangement with creditors: 42120 |
0,00 |
0,00 |
0,00 |
0,00 |
0,00 |
|
|
c) Other income and
expenditure: 42130 |
0,00 |
0,00 |
0,00 |
0,00 |
0,00 |
|
|
B) FINANCIAL REVENUE ( 13 + 14 + 15 + 16 + 17 +18 ) :
49200 |
-135.695,00 |
-119.764,00 |
-58.563,00 |
0,00 |
0,00 |
|
|
C) NET RESULT BEFORE TAXES ( A + B ) : 49300 |
219.622,00 |
-153.405,00 |
-44.964,00 |
-377,00 |
-225,00 |
|
|
19. Income taxes : 41900 |
-5.163,00 |
0,00 |
0,00 |
0,00 |
0,00 |
|
|
D) RESULT OF THE PERIOD ( C + 19 ) : 49500 |
214.459,00 |
-153.405,00 |
-44.964,00 |
-377,00 |
-225,00 |
|
CASHFLOW
STATEMENT
|
Model: Normal
> Source of information: Data contained in this section is taken
from the information declared in the Annual Accounts submitted to the Trade
Register.
|
Net Rights Granted |
2016 |
2015 |
2014 |
2013 |
2012 |
|
|
1. Fiscal year result before taxes.: 61100 |
219.622,00 |
-153.405,00 |
-44.964,00 |
-377,00 |
-225,00 |
|
|
2. Results adjustments.: 61200 |
393.348,00 |
314.123,00 |
119.746,00 |
0,00 |
0,00 |
|
|
a) Fixed Assets Amortization (+).:
61201 |
257.653,00 |
194.359,00 |
61.928,00 |
0,00 |
0,00 |
|
|
g) Financial income (-).: 61207 |
-8,00 |
-336,00 |
-14,00 |
0,00 |
0,00 |
|
|
h) Financial Expenses (+). : 61208 |
135.704,00 |
120.101,00 |
57.832,00 |
0,00 |
0,00 |
|
|
3. Changes in current capital equity.: 61300 |
-801.238,00 |
-417.374,00 |
-564.073,00 |
377,00 |
225,00 |
|
|
a) Stock (+/-).: 61301 |
-673.460,00 |
-441.372,00 |
-329.947,00 |
0,00 |
0,00 |
|
|
d) Debtors and other accounts receivable
(+/-). : 61302 |
-936.100,00 |
-527.367,00 |
-1.197.194,00 |
-79,00 |
-43,00 |
|
|
c) Other current assets (+/-). :
61303 |
1.206,00 |
-1.206,00 |
0,00 |
0,00 |
0,00 |
|
|
d) Creditors and other accounts payable
(+/-). : 61304 |
807.116,00 |
552.571,00 |
963.069,00 |
456,00 |
268,00 |
|
|
4. Cash Flows from Other Operating Activities: 61400 |
-135.695,00 |
-119.764,00 |
-57.818,00 |
0,00 |
0,00 |
|
|
a) Interest payments (-). : 61401 |
-135.704,00 |
-120.101,00 |
-57.832,00 |
0,00 |
0,00 |
|
|
c) Interest collection (+). : 61403 |
8,00 |
336,00 |
14,00 |
0,00 |
0,00 |
|
|
5. Cash Flows from Operating Activities (1 + 2 + 3 + 4) :
61500 |
-323.963,00 |
-376.420,00 |
-547.108,00 |
0,00 |
0,00 |
|
|
6. Payments for investment (-).: 62100 |
-10.771,00 |
-305.415,00 |
-1.530.702,00 |
0,00 |
0,00 |
|
|
b) Intangible fixed assets. : 62102 |
-10.771,00 |
-24.491,00 |
-5.296,00 |
0,00 |
0,00 |
|
|
c) Fixed assets. : 62103 |
0,00 |
-280.924,00 |
-1.500.040,00 |
0,00 |
0,00 |
|
|
e) Other financial assets. : 62105 |
0,00 |
0,00 |
-25.366,00 |
0,00 |
0,00 |
|
|
7. Divestment payment collection (+). : 62200 |
53.361,00 |
0,00 |
0,00 |
0,00 |
0,00 |
|
|
c) Fixed assets. : 62203 |
45.890,00 |
0,00 |
0,00 |
0,00 |
0,00 |
|
|
e) Other financial assets. : 62205 |
7.471,00 |
0,00 |
0,00 |
0,00 |
0,00 |
|
|
8. Cash Flow from Investing Activities (6+7) less Amortization:
62300 |
-215.062,00 |
-499.774,00 |
-1.592.631,00 |
0,00 |
0,00 |
|
|
9. Payment collection and payments for equity instruments. :
63100 |
400.000,00 |
0,00 |
400.000,00 |
0,00 |
3.006,00 |
|
|
a) Issuance of equity instruments (+). :
63101 |
400.000,00 |
0,00 |
400.000,00 |
0,00 |
3.006,00 |
|
|
10. Payment collection and payments for financial liabilities
instruments.: 63200 |
217.465,00 |
736.950,00 |
1.897.134,00 |
600,00 |
0,00 |
|
|
a) Issuance : 63201 |
920.375,00 |
1.322.787,00 |
1.897.134,00 |
600,00 |
0,00 |
|
|
2. Debts incurred with credit institutions
(+). : 63203 |
389.075,00 |
791.994,00 |
1.427.238,00 |
0,00 |
0,00 |
|
|
3. Debts incurred with companies of the
group and affiliates (+).: 63204 |
531.300,00 |
321.000,00 |
0,00 |
0,00 |
0,00 |
|
|
4. Special characteristic debts (+). :
63205 |
0,00 |
9.794,00 |
203.000,00 |
0,00 |
0,00 |
|
|
5. Other debts (+). : 63206 |
0,00 |
200.000,00 |
266.895,00 |
600,00 |
0,00 |
|
|
b) Repayment and amortization of :
63207 |
-702.910,00 |
-585.837,00 |
0,00 |
0,00 |
0,00 |
|
|
2. Debts incurred with credit institutions
(-).: 63209 |
0,00 |
-287.458,00 |
0,00 |
0,00 |
0,00 |
|
|
3. Debts incurred with companies of the
group and affiliates (-). : 63210 |
-321.000,00 |
0,00 |
0,00 |
0,00 |
0,00 |
|
|
4. Special characteristic debts (-). :
63211 |
-164.860,00 |
-47.934,00 |
0,00 |
0,00 |
0,00 |
|
|
5. Other debts (-). : 63212 |
-217.051,00 |
-250.445,00 |
0,00 |
0,00 |
0,00 |
|
|
11. Payments from dividends and remunerations from other assets
instruments. : 63300 |
0,00 |
0,00 |
0,00 |
0,00 |
0,00 |
|
|
12. Cash Flows from Financing Activities (9+10+11): 63400 |
617.465,00 |
736.950,00 |
2.297.134,00 |
600,00 |
3.006,00 |
|
|
D) EFFECT OF EXCHANGE RATE CHANGES: 64000 |
0,00 |
0,00 |
0,00 |
0,00 |
0,00 |
|
|
E) NET INCREASE/DECREASE OF CASH OR EQUIVALENT ASSETS
(+/-5+/-8+/12+/-D) : 65000 |
78.439,00 |
-139.244,00 |
157.395,00 |
600,00 |
3.006,00 |
|
|
Cash or equivalent assets as of beginning
of the fiscal year.: 65100 |
21.758,00 |
161.001,00 |
3.606,00 |
3.006,00 |
0,00 |
|
|
Cash or equivalent assets as of end of the
fiscal year.: 65200 |
105.360,00 |
21.758,00 |
161.001,00 |
3.606,00 |
3.006,00 |
|
|
FINANCIAL
DIAGNOSIS
|
> Economic-Financial Comparative Analysis
Data used in the following ratios and indicators is
taken from the Annual Accounts submitted by the company to the TRADE REGISTER.
> Comparison within the Sector
|
Cash Flow |
2016 |
2015 |
Variación 2016 - 2015 |
|
|||
|
|
Empresa |
Sector |
Empresa |
Sector |
Empresa |
Sector |
|
|
Cash Flow over Sales: |
0,01 % |
0,01 % |
-0,03 % |
0,01 % |
136,79 % |
10,77 % |
|
|
Net Financial Debt: |
3,63 |
1,83 |
14,48 |
2,16 |
-74,94 |
-15,49 |
|
|
Cash Flow Yield: |
0,01 % |
0,01 % |
-0,03 % |
0,01 % |
143,55 % |
7,71 % |
|
|
EBITDA over Sales: |
8,49 % |
6,68 % |
3,59 % |
6,39 % |
136,33 % |
4,53 % |
|
|
Profitability |
2016 |
2015 |
Variación 2016 - 2015 |
|
|||
|
|
Empresa |
Sector |
Empresa |
Sector |
Empresa |
Sector |
|
|
Operating economic profitability: |
5,89 % |
4,39 % |
-0,83 % |
3,92 % |
806,35 % |
12,05 % |
|
|
Total economic profitability: |
5,92 % |
4,44 % |
-0,76 % |
3,96 % |
873,84 % |
12,28 % |
|
|
Financial profitability: |
26,20 % |
5,55 % |
-75,19 % |
4,60 % |
134,85 % |
20,73 % |
|
|
Margin: |
4,90 % |
4,45 % |
-0,81 % |
3,94 % |
702,47 % |
13,07 % |
|
|
Mark-up: |
3,02 % |
4,49 % |
-3,51 % |
3,56 % |
185,90 % |
25,95 % |
|
|
Solvency |
2016 |
2015 |
Variación 2016 - 2015 |
|
|||
|
|
Empresa |
Sector |
Empresa |
Sector |
Empresa |
Sector |
|
|
Liquidity: |
0,03 |
0,38 |
0,01 |
0,34 |
304,43 |
12,46 |
|
|
Acid Test: |
0,81 |
1,19 |
0,61 |
1,17 |
32,28 |
1,72 |
|
|
Working Capital / Investment: |
0,13 |
0,23 |
-0,07 |
0,21 |
279,78 |
10,07 |
|
|
Solvency: |
1,24 |
1,88 |
0,89 |
1,78 |
39,61 |
5,68 |
|
|
Indebtedness |
2016 |
2015 |
Variación 2016 - 2015 |
|
|||
|
|
Empresa |
Sector |
Empresa |
Sector |
Empresa |
Sector |
|
|
Indebtedness level: |
6,33 |
0,85 |
20,34 |
0,92 |
-68,89 |
-6,69 |
|
|
Borrowing Composition: |
0,52 |
0,66 |
0,46 |
0,67 |
13,44 |
-1,40 |
|
|
Repayment Ability: |
8,49 |
8,98 |
26,23 |
9,47 |
-67,65 |
-5,15 |
|
|
Warranty: |
1,16 |
2,17 |
1,05 |
2,09 |
10,47 |
3,73 |
|
|
Generated resources / Total creditors: |
0,09 |
0,10 |
0,01 |
0,09 |
823,65 |
9,42 |
|
|
Efficiency |
2016 |
2015 |
Variación 2016 - 2015 |
|
|||
|
|
Empresa |
Sector |
Empresa |
Sector |
Empresa |
Sector |
|
|
Productivity: |
1,78 |
1,30 |
1,25 |
1,30 |
42,34 |
0,16 |
|
|
Turnover of Collection Rights : |
2,70 |
4,85 |
2,57 |
4,74 |
5,07 |
2,31 |
|
|
Turnover of Payment Entitlements: |
2,49 |
3,12 |
2,41 |
3,16 |
3,46 |
-1,19 |
|
|
Stock rotation: |
4,73 |
4,30 |
5,80 |
4,91 |
-18,37 |
-12,59 |
|
|
Assets turnover: |
1,20 |
0,99 |
1,02 |
0,99 |
17,24 |
-0,90 |
|
|
Borrowing Cost: |
2,62 |
1,53 |
2,89 |
1,77 |
-9,47 |
-13,42 |
|
> Trend of indicators under the General Accounting Plan of 2007
(2016, 2015, 2014, 2013, 2012)
|
Cash Flow |
2016 |
2015 |
2014 |
2013 |
2012 |
|
|
Cash Flow over Sales: |
0,01 % |
-0,03 % |
0,07 % |
|
|
|
|
Net Financial Debt: |
3,63 |
14,48 |
22,99 |
7,98 |
13,36 |
|
|
Cash Flow Yield: |
0,01 % |
-0,03 % |
0,05 % |
0,16 % |
0,99 % |
|
|
EBITDA over Sales: |
8,49 % |
3,59 % |
3,17 % |
|
|
|
|
Profitability |
2016 |
2015 |
2014 |
2013 |
2012 |
|
|
Operating economic profitability: |
5,89 % |
-0,83 % |
0,43 % |
-10,11 % |
-7,38 % |
|
|
Total economic profitability: |
5,92 % |
-0,76 % |
0,40 % |
-10,11 % |
-7,38 % |
|
|
Financial profitability: |
26,20 % |
-75,19 % |
-12,58 % |
-15,68 % |
-8,09 % |
|
|
Margin: |
4,90 % |
-0,81 % |
0,57 % |
|
|
|
|
Mark-up: |
3,02 % |
-3,51 % |
-1,89 % |
|
|
|
|
Solvency |
2016 |
2015 |
2014 |
2013 |
2012 |
|
|
Liquidity: |
0,03 |
0,01 |
0,11 |
2,72 |
11,23 |
|
|
Acid Test: |
0,81 |
0,61 |
0,96 |
2,82 |
11,39 |
|
|
Working Capital / Investment: |
0,13 |
-0,07 |
0,08 |
0,64 |
0,91 |
|
|
Solvency: |
1,24 |
0,89 |
1,19 |
2,82 |
11,39 |
|
|
Indebtedness |
2016 |
2015 |
2014 |
2013 |
2012 |
|
|
Indebtedness level: |
6,33 |
20,34 |
8,01 |
0,55 |
0,10 |
|
|
Borrowing Composition: |
0,52 |
0,46 |
1,02 |
0,00 |
0,00 |
|
|
Repayment Ability: |
8,49 |
26,23 |
37,89 |
-3,51 |
-1,19 |
|
|
Warranty: |
1,16 |
1,05 |
1,12 |
2,82 |
11,39 |
|
|
Generated resources / Total creditors: |
0,09 |
0,01 |
0,01 |
-0,28 |
-0,84 |
|
|
Efficiency |
2016 |
2015 |
2014 |
2013 |
2012 |
|
|
Productivity: |
1,78 |
1,25 |
1,34 |
|
|
|
|
Turnover of Collection Rights : |
2,70 |
2,57 |
1,99 |
0,00 |
0,00 |
|
|
Turnover of Payment Entitlements: |
2,49 |
2,41 |
2,16 |
0,52 |
0,84 |
|
|
Stock rotation: |
4,73 |
5,80 |
7,17 |
|
|
|
|
Assets turnover: |
1,20 |
1,02 |
0,74 |
0,00 |
0,00 |
|
|
Borrowing Cost: |
2,62 |
2,89 |
2,02 |
0,00 |
0,00 |
|
COMPARATIVE SECTORIAL BALANCE
|
Sector-based Comparison
under the rules of the New General Accounting Plan.
|
Net Rights Granted |
Variación - |
|
|
|
Empresa |
Sector |
|
Net Rights Granted |
Variación - |
|
|
|
Empresa |
Sector |
|
Net Rights Granted |
Variación - |
|
|
|
Empresa |
Sector |
|
News
|
--
Public
Tenders and Works Won
|
No Public Tenders
assigned to the name of the company.
|
Research
Summary
|
|
The company was incorporated in February 2002, with a shareholder
equity that amounted to Euro 80,3006. It is engaged in the manufacture of
containers. |
|
Answer
to additional question
|
|
Manufacturer of blister packs with aluminium foil, bags and
envelopes, strip for suppositories, all for the pharmaceutical industry.
Exports mainly to Algeria. |
|
Sources
|
|
Registry of Commerce's Official Gazette. Own and external
data bases Company References |
FOREIGN EXCHANGE RATES
|
Currency |
Unit
|
Indian Rupees |
|
US Dollar |
1 |
INR 68.02 |
|
|
1 |
INR 91.25 |
|
Euro |
1 |
INR 80.07 |
|
Euro |
1 |
INR 80.15 |
Note :
Above are approximate rates obtained from sources believed to be correct
INFORMATION DETAILS
|
Analysis Done by
: |
PRI |
|
|
|
|
Report Prepared
by : |
KET |
RATING EXPLANATIONS
|
Credit Rating |
Explanation |
Rating Comments |
|
A++ |
Minimum Risk |
Business dealings permissible with minimum
risk of default |
|
A+ |
Low Risk |
Business dealings permissible with low
risk of default |
|
A |
Acceptable Risk |
Business dealings permissible with
moderate risk of default |
|
B |
Medium Risk |
Business dealings permissible on a regular
monitoring basis |
|
C |
Medium High Risk |
Business dealings permissible preferably
on secured basis |
|
D |
High Risk |
Business dealing not recommended or on
secured terms only |
|
NB |
New Business |
No recommendation can be done due to
business in infancy stage |
|
NT |
No Trace |
No recommendation can be done as the
business is not traceable |
NB is stated where there is insufficient information to facilitate rating. However, it is not to be considered as unfavourable.
This score serves as a reference to assess
SC’s credit risk and to set the amount of credit to be extended. It is
calculated from a composite of weighted scores obtained from each of the major
sections of this report. The assessed factors are as follows:
·
Financial
condition covering various ratios
·
Company
background and operations size
·
Promoters
/ Management background
·
Payment
record
·
Litigation
against the subject
·
Industry
scenario / competitor analysis
·
Supplier
/ Customer / Banker review (wherever available)
This report is issued at
your request without any risk and responsibility on the part of MIRA INFORM
PRIVATE LIMITED (MIPL) or its officials.