|
|
|

MIRA INFORM REPORT
|
Report No. : |
511319 |
|
Report Date : |
25.05.2018 |
IDENTIFICATION DETAILS
|
Name : |
FIEM INDUSTRIES LIMITED (w.e.f. 30.11.1993) |
|
|
|
|
Formerly Known
As : |
FIEM INDUSTRIES PRIVATE LIMITED (w.e.f. 07.05.1992) RAHUL AUTO PRIVATE LIMITED |
|
|
|
|
Registered
Office : |
D-34, DSIDC Packaging Complex, Kirti Nagar, Delhi – 110015 |
|
Tel. No.: |
91-11-25927820, 25927919 |
|
|
|
|
Country : |
|
|
|
|
|
Financials (as
on) : |
31.03.2017 |
|
|
|
|
Date of Incorporation
: |
06.02.1989 |
|
|
|
|
Com. Reg. No.: |
55-034928 |
|
|
|
|
Capital
Investment / Paid-up Capital : |
INR 131.598 Million |
|
|
|
|
CIN No.: [Company Identification
No.] |
L36999DL1989PLC034928 |
|
|
|
|
IEC No.: [Import-Export Code No.] |
Not Divulged |
|
|
|
|
GSTN : [Goods & Service Tax
Registration No.] |
Not Divulged |
|
|
|
|
TAN No.: [Tax Deduction &
Collection Account No.] |
Not Available |
|
|
|
|
PAN No.: [Permanent Account No.] |
Not Available |
|
|
|
|
Legal Form : |
A Public Limited Liability Company. The Company’s Shares are Listed on
the Stock Exchanges. |
|
|
|
|
Line of Business
: |
Manufacturing
of automotive lighting and signaling equipments, rear view mirror, plastic
moulded parts and other auto components. Company also manufactures LED
luminaries / LED products for general lighting applications and led
integrated passenger information system for buses and railways etc. [Registered Activity] |
|
|
|
|
No. of Employees
: |
1854 (Approximately) |
|
MIRA’s Rating : |
A++ |
|
Credit Rating |
Explanation |
Rating Comments |
|
A++ |
Minimum Risk |
Business dealings permissible with minimum
risk of default |
|
Maximum Credit Limit : |
USD 12100000 |
|
|
|
|
Status : |
Excellent |
|
|
|
|
Payment Behaviour : |
Regular |
|
|
|
|
Litigation : |
Clear |
|
|
|
|
Comments : |
Subject was incorporated in the year 1989. It is a manufacturer and supplier of auto components comprising of automotive lighting and signaling equipments. As per the financial record of 2017, the company has achieved 3.08% growth in its revenue along with average profit margin of 3.23%. The sound financial profile of the company is marked by healthy networth base along with negligible debt level. Rating takes into consideration equity infused by its promoters. The rating takes into consideration the subject’s long established track record of the business operations along with extensive experience of its promoters. The company has its share price trading at around INR 837 against the Face Value (FV) of INR 10 on BSE as on 24th May, 2018. As per the unaudited quarterly financials of December 2017, the company has achieved revenue of INR 2859.193 million and has reported profit margin of 4.40%. Business is active. Payment seems to be regular. In
view of aforesaid, the company can be considered good for normal business
dealings at usual trade terms and conditions. |
NOTES:
Any query related to this report can be made
on e-mail: infodept@mirainform.com
while quoting report number, name and date.
ECGC Country Risk Classification List
|
Country Name |
Previous Rating (30.09.2017) |
Current Rating (31.12.2017) |
|
India |
A1 |
A1 |
|
Risk Category |
ECGC
Classification |
|
Insignificant |
A1 |
|
Low Risk |
A2 |
|
Moderately Low Risk |
B1 |
|
Moderate Risk |
B2 |
|
Moderately High Risk |
C1 |
|
High Risk |
C2 |
|
Very High Risk |
D |
EXTERNAL AGENCY RATING
NOT AVAILABLE
RBI DEFAULTERS’ LIST STATUS
Subject’s name is not enlisted as a defaulter
in the publicly available RBI Defaulters’ list.
EPF (Employee Provident Fund) DEFAULTERS’ LIST STATUS
Subject’s name is not enlisted as a defaulter
in the publicly available EPF (Employee Provident Fund) Defaulters’ list as of
31-03-2018.
BIFR (Board for Industrial & Financial Reconstruction) LISTING
STATUS
Subject’s name is not listed as a Sick Unit in
the publicly available BIFR (Board for Industrial & Financial
Reconstruction) list as of 25.05.2018
IBBI (Insolvency and Bankruptcy Board of India) LISTING STATUS
Subject’s name is not listed in the publicly
available IBBI (Insolvency and Bankruptcy Board of India) list as of report
date.
INFORMATION DENIED
Management Non-Cooperative (91-11-25927820)
LOCATIONS
|
Registered Office : |
D-34, DSIDC Packaging Complex, Kirti Nagar, Delhi – 110015, India |
|
Tel. No.: |
91-11-25927820 / 25927919 |
|
Fax No.: |
91-11-25927740 |
|
E-Mail : |
|
|
Website : |
|
|
|
|
|
Corporate Office / Unit VII: |
Plot No.1915, Rai Industrial Estate, HSIIDC, Phase-V, District Sonepat
– 131029, Haryana, India |
|
Tel. No.: |
91-130-2367905 / 906 / 907 / 908 / 909 / 910 |
|
Fax No.: |
91-130-2367903 |
|
|
|
|
Marketing Head
Office : |
Commercial Towers – 1st Floor, JW Marriott Hotel, Delhi
Aerocity, New Delhi – 110037, India |
|
|
|
|
Unit I: |
32 Mile Stone, G. T. Road, Kundli, Sonepat, Haryana, India |
|
|
|
|
Unit II: |
219/2B, Thally Road, Kallukondapalli, Hosur, Tamilnadu, India |
|
|
|
|
Unit III: |
Kelamangalam, Achittapalli Post, Hosur, Tamilnadu, India |
|
|
|
|
Unit IV: |
S. No. 29, Madargali Village, Varuna Hobli, Mysore, Karnataka, India |
|
|
|
|
Unit V: |
Kelamangalam, Achittapalli Post, Hosur, Tamilnadu, India |
|
|
|
|
Unit VI: |
Village Bhatian, Tehsil -Nalagarh, Himachal Pradesh, India |
|
|
|
|
Unit VIII: |
Plot No. SP1-C, Industrial Area Tapukara, District Alwar, Rajasthan, India |
|
|
|
|
Unit IX: |
Survay No. 151-153, Village Karsanpur, Taluka Mandal, District Ahmedabad – 382123, Gujarat, India |
DIRECTORS
AS ON 31.03.2018
|
Name : |
Mr. Jagjeevan Kumar Jain |
|
Designation : |
Chairman and Managing Director |
|
Address : |
H. No. 16, Old No. 170-A Western Avenue, Sainik Farms, New Delhi –
110062, India |
|
Date of Birth/Age : |
09.05.1952 |
|
Date of Appointment : |
06.02.1989 |
|
DIN No.: |
00013356 |
|
|
|
|
Name : |
Ms. Aanchal Jain |
|
Designation : |
Whole-time Director |
|
Address : |
16 Old No. 170-A Western Avenue, Sainik Farms, New Delhi – 110062,
India |
|
Date of Birth/Age : |
01.12.1981 |
|
Date of Appointment : |
02.12.1999 |
|
DIN No.: |
00013350 |
|
|
|
|
Name : |
Mrs. Seema Jain |
|
Designation : |
Whole-time Director |
|
Address : |
16 Old No. 170-A Western Avenue, Sainik Farms, New Delhi – 110062,
India |
|
Date of Birth/Age : |
28.08.1954 |
|
Date of Appointment : |
06.02.1989 |
|
DIN No.: |
00013523 |
|
|
|
|
Name : |
Mr. Rahul Jain |
|
Designation : |
Whole-time Director |
|
Address : |
16 Old No. 170-A Western Avenue, Sainik Farms, New Delhi – 110062,
India |
|
Date of Birth/Age : |
14.11.1986 |
|
Date of Appointment : |
14.11.2004 |
|
DIN No.: |
00013566 |
|
|
|
|
Name : |
Mr. Iqbal Singh |
|
Designation : |
Director |
|
Address : |
59/7, New Rohtak Road, New Delhi -
110005, India |
|
Date of Appointment : |
05.10.2005 |
|
DIN No.: |
00014256 |
|
|
|
|
Name : |
Mr. Joga Shyam Sunder Rao |
|
Designation : |
Whole-time Director |
|
Address : |
Ground Floor-9, Block-I, South City-II, Gurugram - 122001, Haryana, India |
|
Date of Appointment : |
01.12.2005 |
|
DIN No.: |
00014320 |
|
|
|
|
Name : |
Mr. Subodh Kumar Jain |
|
Designation : |
Director |
|
Address : |
170, Western Avenue, Sainik Farm, New Delhi – 110062, India |
|
Date of Appointment : |
09.11.2012 |
|
DIN No.: |
00165755 |
|
|
|
|
Name : |
Mr. Mohan Bir Sahni |
|
Designation : |
Casual Vacancy Director |
|
Address : |
B 22, Ashoka Avenue, Sainik Farms, New Delhi – 110062, India |
|
Date of Appointment : |
12.02.2015 |
|
DIN No.: |
00906251 |
|
|
|
|
Name : |
Mr. Kashi Ram Yadav |
|
Designation : |
Whole-time Director |
|
Address : |
RZ-2/218, J Block, West Sagar Pur, New Delhi – 110046, India |
|
Date of Appointment : |
25.10.2008 |
|
DIN No.: |
02379958 |
|
|
|
|
Name : |
Mr. Vinod Kumar Malhotra |
|
Designation : |
Director |
|
Address : |
C-29, Kiram Garden, Uttam Nagar, New Delhi – 110059, India |
|
Date of Appointment : |
04.08.2011 |
|
DIN No.: |
03544095 |
|
|
|
|
Name : |
Mr. Ashok Kumar Sharma |
|
Designation : |
Casual Vacancy Director |
|
Address : |
256/ H-17 Sector-7, Rohini, Delhi -
110085, India |
|
Date of Appointment : |
10.09.2016 |
|
DIN No.: |
07610447 |
|
|
|
|
Name : |
Mr. Jawahar Thakur |
|
Designation : |
Casual Vacancy Director |
|
Address : |
C-I/17, Bapa Nagar, Dr. Zakir Husain Marg, Delhi – 110003, India |
|
Date of Appointment : |
12.11.2016 |
|
DIN No.: |
07650035 |
KEY EXECUTIVES
|
Name : |
Mr. Om Parkash Gupta |
|
Designation : |
Chief Finance Officer |
|
Address : |
103, Sandesh Vihar, Pitam Pura, New Delhi – 110034, India |
|
Date of Appointment : |
01.04.2014 |
|
PAN No.: |
ABQPG2866D |
|
|
|
|
Name : |
Mr. Arvind Kumar Chauhan |
|
Designation : |
Company Secretary and Compliance Officer |
|
Address : |
H. No. 62, Dhakka Kingsway Camp. New Delhi – 110009, India |
|
Date of Appointment : |
07.03.2006 |
|
PAN No.: |
AEQPC3107E |
|
|
|
|
Audit Committee : |
Ø Mr. S. K. Jain - Chairman Ø Mr. V. K. Malhotra - Member Ø Mr. Iqbal Singh - Member |
|
|
|
|
Nomination and
Remuneration Committee : |
Ø Mr. S. K. Jain - Chairman Ø Mr. Iqbal Singh - Member Ø Mr. V. K. Malhotra - Member |
|
|
|
|
Stakeholders
Relationship Committee : |
Ø Mr. V. K. Malhotra - Chairman Ø Mr. Rahul Jain - Member Ø Mr. Kashi Ram Yadav - Member |
|
|
|
|
Corporate Social
Responsibility (CSR) Committee : |
Ø Mr. Rahul Jain - Chairman Ø Mr. Kashi Ram Yadav - Member Ø Mr. V.K. Malhotra - Member |
|
|
|
|
Fund Raising
Committee (FRC) (Constituted w.e.f May 30, 2016) : |
Ø Mr. J.K. Jain - Chairman Ø Mr. Rahul Jain - Member Ø Mr. S. K. Jain - Member |
SHAREHOLDING PATTERN
AS ON March 2018
|
Category of
Shareholder |
No.
of Shares |
Percentage
of Holding |
|
(A) Promoter
& Promoter Group |
8368278 |
63.59 |
|
(B) Public |
4791552 |
36.41 |
|
Grand Total |
13159830 |
100.00 |

Statement showing shareholding pattern of the Promoter
and Promoter Group
|
Category of
Shareholder |
No.
of Shares |
Percentage
of Holding |
|
A1) Indian |
|
0.00 |
|
Individuals/Hindu
undivided Family |
8283878 |
62.95 |
|
Jagjeevan Kumar
Jain |
2960000 |
22.49 |
|
Seema Jain |
2960000 |
22.49 |
|
Rahul Jain |
1552340 |
11.80 |
|
Aanchal Jain |
800000 |
6.08 |
|
Jagjeevan Kumar
Jain (HUF) |
11538 |
0.09 |
|
Any Other (specify) |
84400 |
0.64 |
|
Fiem Auto Private
Limited |
84400 |
0.64 |
|
Sub Total A1 |
8368278 |
63.59 |
|
A2) Foreign |
|
0.00 |
|
A=A1+A2 |
8368278 |
63.59 |
Statement showing shareholding pattern of the Public
shareholder
|
Category of
Shareholder |
No. of
Shares |
Percentage
of Holding |
|
B1) Institutions |
0 |
0.00 |
|
Mutual Funds/ |
520440 |
3.95 |
|
Dsp Blackrock
Small Cap Fund |
520440 |
3.95 |
|
Alternate
Investment Funds |
64382 |
0.49 |
|
Foreign Portfolio
Investors |
1882431 |
14.30 |
|
Saif India V Fii
Holdings Limited |
962081 |
7.31 |
|
K India
Opportunities Fund Limited - Class G |
210005 |
1.60 |
|
Kitara India
Micro Cap Growth Fund |
199258 |
1.51 |
|
Blackrock India
Equities (Mauritius) Limited |
181103 |
1.38 |
|
Financial Institutions/
Banks |
4688 |
0.04 |
|
Insurance
Companies |
464876 |
3.53 |
|
Bajaj Allianz
Life Insurance Company Limited |
464876 |
3.53 |
|
Sub Total B1 |
2936817 |
22.32 |
|
B2) Central
Government/ State Government(s)/ President of India |
0 |
0.00 |
|
Central
Government/ State Government(s)/ President of India |
14 |
0.00 |
|
Sub Total B2 |
14 |
0.00 |
|
B3)
Non-Institutions |
0 |
0.00 |
|
Individual share
capital upto INR 0.200 million |
1273894 |
9.68 |
|
Individual share capital
in excess of INR 0.200 million |
44514 |
0.34 |
|
Any Other
(specify) |
536313 |
4.08 |
|
HUF |
68902 |
0.52 |
|
Overseas
Corporate Bodies |
104051 |
0.79 |
|
Non-Resident
Indian (NRI) |
172272 |
1.31 |
|
Clearing Members |
27859 |
0.21 |
|
Bodies Corporate |
163229 |
1.24 |
|
Sub Total B3 |
1854721 |
14.09 |
|
B=B1+B2+B3 |
4791552 |
36.41 |
BUSINESS DETAILS
|
Line of Business : |
Manufacturing
of automotive lighting and signaling equipments, rear view mirror, plastic moulded
parts and other auto components. Company also manufactures LED luminaries /
LED products for general lighting applications and led integrated passenger
information system for buses and railways etc. [Registered Activity] |
||||||||||||
|
|
|
||||||||||||
|
Products / Services
: |
|
||||||||||||
|
|
|
||||||||||||
|
Brand Names : |
Not Divulged |
||||||||||||
|
|
|
||||||||||||
|
Agencies Held : |
Not Divulged |
||||||||||||
|
|
|
||||||||||||
|
Exports : |
Not Divulged |
||||||||||||
|
|
|
||||||||||||
|
Imports : |
Not Divulged |
||||||||||||
|
|
|
||||||||||||
|
Terms : |
Not Divulged |
PRODUCTION STATUS – NOT AVAILABLE
GENERAL INFORMATION
|
Suppliers : |
|
||||||||||||||||||||||||||||||||||||||||||||||||||||
|
|
|
||||||||||||||||||||||||||||||||||||||||||||||||||||
|
Customers : |
|
||||||||||||||||||||||||||||||||||||||||||||||||||||
|
|
|
||||||||||||||||||||||||||||||||||||||||||||||||||||
|
No. of Employees : |
1854 (Approximately) |
||||||||||||||||||||||||||||||||||||||||||||||||||||
|
|
|
||||||||||||||||||||||||||||||||||||||||||||||||||||
|
Bankers : |
|
||||||||||||||||||||||||||||||||||||||||||||||||||||
|
|
|
||||||||||||||||||||||||||||||||||||||||||||||||||||
|
Facilities : |
NOTES: LONG TERM BORROWINGS INDIAN RUPEE TERM LOANS FROM BANKS INCLUDE a)
From Citibank:- Loan outstanding as at 31.03.17 INR NIL (Previous year
INR 9.733 million) had tenor of 5 years with 16 equal quarterly repayments
beginning from the end of 15 months from drawdown. Interest was payable on
monthly basis. The loan carried fixed interest rate of 12% p.a. and was
secured against exclusive charge on all movable assets procured out of the
term loan. This loan has been fully repaid during the year. b)
From State bank of Patiala:- Loan outstanding as on 31.03.17 INR NIL
(Previous Year INR 40.000 million). The loan was for 7 years with 24
quarterly repayment beginning from the end of 15 months from the drawdown.
Interest was monthly payable. The interest rate was 10.30% p.a. The Loan was
Secured against First Pari Passu charge alongwith Axis Bank and HSBC over
movable and Immovable fixed assets of Rai Unit (Present and future) including
equitable mortgage of Factory Land and Building at Rai, Sonepat and First
charge on movable fixed assets of Hosur Unit- III (Tamilnadu) and First
Charge on movable fixed assets of Mysore unit -IV Karnataka and First charge on
entire fixed assets of Unit- VI Nalagarh Unit. This loan has been fully
repaid during the year. c)
From Axis Bank:- Loan outstanding as on 31.03.17 INR 50.800 million
(Previous year INR 101.600 million):- The loan is for 7 years and has
quarterly repayment beginning after moratorium period of 12 months from the
drawdown. Interest is monthly payable. The
current interest rate is 10.10% p.a. The Loan is secured against First Pari
Passu charge with State Bank of Patiala and HSBC bank on the movable and
immovable fixed assets of Rai Unit including equitable mortgage of Factory
Land and Building of Rai Unit and secured against First Pari Passu Charge on
movable fixed assets of kundli unit and Unit -2 at Hosur with Citibank
FCNR-II term loan. d)
HSBC Bank:- Loan -1 Outstanding as on 31.03.17 INR 31.250 million
(Previous Year INR 56.250 million) The Loan is for 5 year and has quarterly
equal repayment beginning after moratorium period of 1 year. Interest is
monthly payable. The loan carries fixed interest rate of 10% p.a. The Loan is
secured against First Pari Passu charge with Axis Bank on the movable and
immovable fixed assets of Rai Unit including equitable mortgage of Factory
Land and Building of Rai Unit. e)
HSBC Bank:- Loan -2 Outstanding as on 31.03.17 INR 180.000 million
(Previous Year INR 200.000 million) The Loan is for 6 year and has 20
quarterly equal repayment beginning after moratorium period of 15 months .
Interest is monthly payable. The loan carries fixed interest rate of 9.50%
p.a. The Loan is Secured against First Pari-Passu charge with HSBC -Mauritius
and with CITIBANK FCNR TERM LOAN -3 by way of equitable mortgage on land and
building and hypothecation of Plant and machinery at project in Gujarat
(Survey no 151-153, village karsanpur, Taluka mandal, District Ahmedabad) and
secured against first pari passu charge by way of equitable mortgage on Land
and Building and hypothecation of Plant and Machinery at Tapukara Rajasthan
along with ,HSBC Mauritius, CITIBANK FCNR TERM LOAN -3 and STANDARD CHARTERD
BANK ECB-3 LOAN. FOREIGN CURRENCY TERM LOAN FROM BANKS INCLUDE a)
From Citibank :- FCNR Term Loan -1 outstanding as on 31.03.17 –INR
30.469 million (Previous Year INR 50.000 million) has tenor of 5 years with
16 equal quarterly repayments beginning from the end of 15 months from
drawdown. Interest is payable on monthly basis. The loan carries fully hedged
interest cost of 10.60% p.a. The Loan is secured against exclusive charge on
fixed assets financed out of the term loan and first charge of the movable
fixed assets of Unit-V situated at Hosur, Tamilnadu. b)
From Citibank :- FCNR Term Loan -2 outstanding as on 31.03.17- INR
144.261 million ( Previous Year INR 187.500 million) has tenor of 5 years
with 16 equal quarterly repayments beginning from the end of 12 months from
drawdown. Interest is payable on monthly basis. The loan carries fully hedged
interest cost of 10.25% p.a. The Loan is secured against exclusive charge on
fixed assets financed out of the term loan and is secured against First
pari-passu charge on the fixed assets of Kundli Unit-1 and Hosur Unit-2 with
working capital Lenders viz. Citibank, Standard Chartered Bank, HDFC bank and
IndusInd Bank Guarantee limit and term lender Axis Bank. The Loan is also
secured against exclusive charge on fixed assets financed out of the term
loan and first charge of the movable fixed assets of Unit-V situated at
Hosur, Tamilnadu. c)
From Citibank:- FCNR Term Loan -3 outstanding as on 31.03.17- INR
337.647 million ( Previous Year- INR NIL) has tenor of 6 years with 20 equal
quarterly repayments beginning from the end of 15 months from drawdown.
Interest is payable on monthly basis. The
loan carries fully hedged interest cost of 9% p.a. The Loan is secured
against First pari-passu charge on the fixed assets of the company including
land and building and plant and machinery at Rajasthan unit with other lender
viz. HSBC India, HSBC Mauritius and SCB 5.50 Million USD ECB LOAN and is
secured against first pari-passu charge on all the fixed assets including
land and building and plant and machinery of Gujarat unit shared with other
lenders viz. HSBC India, HSBC Mauritius. d)
From Standard Chartered Bank ECB -2:- Loan outstanding as on 31.03.17
- NIL (Previous year INR 27.619 million). The loan was for 5 years with 16
equal quarterly repayment beginning from the end of 15 months from the
drawdown. Interest was quarterly payable. The loan carried fully hedged
interest cost of 8.50% p.a. The Loan was secured against Equitable mortgage
on land and building and Pant and machinery at Tapukara, Rajasthan Unit with
HSBC India and HSBC Mauritius. This loan has been fully repaid during the
year e)
From Standard Chartered Bank ECB -3 for 5.50 Million USD:- Loan
outstanding as on 31.03.17 – INR 356.612 million (Previous year INR NIL). The
loan is for 6 years with 16 equal quarterly repayment beginning from the end
of 15 months from the drawdown. Interest is quarterly payable. The loan
carries fully hedged interest cost of 8.90% p.a. The Loan is secured on first
pari passu charge basis with HSBC INDIA, HSBC Mauritius and CITIBNK FCNR TERM
LOAN-3 on all assets of Tapukara plant ( Present and future). f)
From HSBC Mauritius ECB:- Loan outstanding as on 31.03.17- INR 445.765
million (Previous year INR 492.750 million). The loan is for 6 years with 20
equal quarterly repayment beginning from the end of 15 months from the
drawdown. Interest is quarterly payable. The loan carries fully hedged
interest cost of 8.99% p.a. The Loan is secured against Equitable Mortgage
with CITIBANK FCNR TERM LOAN-3 (1st Pari Passu with HSBC, India) on Land and
Building and Hypothecation of Plant and Machinery (1st pari- Passu with HSBC,
India) located at Ahmedabad, Gujarat and secured against equitable mortgage
on Land and Building with (1st pari- Passu with HSBC, India) and
hypothecation of Plant and Machinery (1st pari- Passu with HSBC, India) along
with CITIBANK FCNR TERM LOAN -3 AND STANDARD CHARTERED BANK ECB-3 at Tapukara
Rajasthan. VEHICLE LOANS FROM BANKS AND OTHERS Vehicle loan from banks
and others outstanding as on 31.03.17 are INR 34.003 million (Previous year
INR 51.856 million) secured against hypothecation of the respective vehicles
acquired out of proceeds thereof. The Loans carries interest rate between
9.50% to 11.00%.
SHORT TERM BORROWINGS Indian Rupee
Loan includes a) From Citibank NA :- Loan outstanding as at 31st March 2017 INR 222.021 million (Previous Year INR 10.443 million) Interest is payable with monthly rest on the last date of each month in each year or at such other rest as determined by the bank. The rate of interest is based on relevant circumstances, including market conditions which currently is 9.5% p.a. The loan is secured against First Pari Passu Charge on all present and future receivables, stocks/Inventories with Standard Chartered Bank Cash Credit Loan, HDFC Bank Cash Credit Loan, Indusind Bank Bank Guarantee Limit and secured against First Pari Passu charge on all the fixed assets of the company (excluding assets specifically purchased out of the term loans from Citibank and other term loan lenders) including equitable mortgage charge on first pari passu basis on Land and Building situated at 32nd Milestone, GT Road, Kundli, Haryana and 219/2B,Thally Road Hosur, Tamilnadu with Standard Chartered Bank, HDFC Bank, Indusind Bank and Citibank FCNR-2 Loan. b) From Standard Chartered Bank :- Loan outstanding as at 31st March 2017 is INR 271.780 million (Previous year INR 72.801 million) Interest is monthly payable. Interest is payable at base rate plus margin basis which may be agreed with bank from time to time which currently is 9.50% p.a. The loan is secured against First Pari Passu Charge on all present and future receivables, stocks/Inventories with Citibank Cash Credit Loan, HDFC Bank Cash Credit Loan, Indusind bank Bank Guarantee Limit and secured against First Pari Passu Charge on present and future moveable fixed assets of the company with Citibank, HDFC Bank, Indusind Bank (excluding assets specifically purchased out of term loan from term loan lenders) including equitable mortgage charge on first pari passu basis on Land and Building situated at 32nd Milestone, GT Road, Kundli, Haryana and 219/2B,Thally Road Hosur, Tamilnadu with Citibank , HDFC Bank, Indusind bank and Citibank FCNR-2 Loan. c) From HDFC BANK :- Loan outstanding as at 31st March 2017 is INR 147.716 million (Previous year INR 99.738V) Interest is monthly payable. Interest is payable at base rate plus margin basis which may be agreed with bank from time to time which currently is 9.00% p.a. The loan is secured against First Pari Passu charge on all present and future receivables, stocks/Inventories with Citibank Cash Credit Loan, Standard Chartered Bank Cash Credit Loan, Indusind bank Bank Guarantee Limit and secured against First Pari Passu Charge on all fixed assets of the company (excluding assets specifically purchased out of term loan from term loan lenders ) with Citibank, Standard Chartered Bank, Indusind Bank including equitable mortgage charge on first pari passu basis on Land and Building situated at 32nd Milestone, GT Road, Kundli, Haryana and 219/2B,Thally Road Hosur, Tamilnadu with Citibank, Standard Chartered Bank, Indusind Bank and Citibank FCNR-2 Loan. d) Indusind Bank Bank Guarantee Limit:- The loan is secured against First Pari Passu Charge on all present and future receivables, stocks/Inventories with Citibank Cash Credit Loan, Standard Chartered Bank Cash Credit Loan, HDFC bank Cash Credit Loan Limit and secured against First Pari Passu Charge on present and future moveable fixed assets of the company with Citibank, Standard Chartered Bank, HDFC bank (excluding assets specifically purchased out of term loan from term loan lenders) including equitable mortgage charge on first pari passu basis on Land and Building situated at 32nd Milestone, GT Road, Kundli, Haryana and 219/2B,Thally Road Hosur,Tamilnadu with Citibank, Standard Chartered Bank, HDFC bank and Citibank FCNR-2 Loan. Bank Guarantee charges is 0.60% p.a. plus applicable service tax. |
|
Auditors : |
|
|
Name : |
Anil S. Gupta and Associates Chartered Accountants |
|
Address : |
201, Vikram Tower, 16 Rajendra Place, New Delhi – 110008, Delhi, India |
|
Tel. No.: |
91-11-5826577 / 5728146 / 5728147 |
|
Fax No.: |
91-11-5728147 |
|
|
|
|
Memberships : |
Not Available |
|
|
|
|
Collaborators : |
Not Available |
|
|
|
|
100% Subsidiary
Company incorporated in Japan : |
· Fiem Industries Japan Co., Limited |
|
|
|
|
JV incorporated in
Italy, 50% ownership interest held by the company : |
· Centro Ricerche Fiem Horustech SRL |
|
|
|
|
Entity Controlled by
Key Management Personnel : |
· Fiem Auto Private Limited · Jagjeevan Kumar Jain (HUF) · Fiem Auto and Electrical Industries · Fiem Foundation |
CAPITAL STRUCTURE
AS ON 31.03.2017
Authorised Capital :
|
No. of Shares |
Type |
Value |
Amount |
|
|
|
|
|
|
30000000 |
Equity Shares |
INR 10/- each |
INR 300.000 Million |
|
|
|
|
|
Issued, Subscribed & Paid-up Capital :
|
No. of Shares |
Type |
Value |
Amount |
|
|
|
|
|
|
13159830 |
Equity Shares |
INR 10/- each |
INR 131.598 Million |
|
|
|
|
|
a) Terms/rights attached to equity shares
The company has only one class of shares referred to as
equity shares having a par value of H10 each. Each holder of equity shares is entitled to one vote per
share. The company declares and pays dividends in Indian rupees. The dividend
proposed by the Board of Directors
is subject to the approval of the shareholders in the ensuing Annual General
Meeting except in case of interim
dividend. In the event of liquidation of the company, the holders of equity
shares will be entitled to receive any of
the remaining assets of the company, after distribution of all preferential
amounts. However, no such preferential amount exist currently. The distribution will be in proportion to the
number of the equity shares held by the shareholders.
b) The Details of shareholder holding more
than 5% shares in the company (Equity share of INR 10 each fully paid up)
|
Name of the
Shareholder |
As at 31.03.2017 |
|
|
No of shares |
% held |
|
|
J.K. Jain |
2960000 |
22.49% |
|
Seema Jain |
2960000 |
22.49% |
|
Rahul Jain |
1552340 |
11.80% |
|
Aanchal Jain |
800000 |
6.08% |
c) Reconciliation of Number of Shares
|
Equity shares |
As at 31.03.2017 |
|
|
No of shares |
INR in Million |
|
|
Opening Balance |
11962226 |
119.622 |
|
Issued During the Year * |
1197604 |
11.976 |
|
Closing balance |
13159830 |
131.598 |
*The Company has issued and allotted 1197604 equity shares on private placement basis to Qualified Institutional Buyers on September 20, 2016.
LISTING DETAILS:
|
Subject Stock
Code : |
BSE : 532768 NSE : FIEMIND ISIN : INE737H01014 SECTOR : AUTO ANCILLARIES |
|
Stock Exchange Place : |
|
|
Listed Date : |
Not Available |
FINANCIAL DATA
[all figures are
INR Million]
ABRIDGED
BALANCE SHEET (STANDALONE)
|
SOURCES OF FUNDS |
31.03.2017 |
31.03.2016 |
31.03.2015 |
|
I.
EQUITY
AND LIABILITIES |
|
|
|
|
(1)Shareholders' Funds |
|
|
|
|
(a) Share Capital |
131.598 |
119.622 |
119.622 |
|
(b) Reserves & Surplus |
4101.847 |
2610.637 |
2153.719 |
|
(c) Money
received against share warrants |
0.000 |
0.000 |
0.000 |
|
|
|
|
|
|
(2) Share Application money pending
allotment |
0.000 |
0.000 |
0.000 |
|
Total
Shareholders’ Funds (1) + (2) |
4233.445 |
2730.259 |
2273.341 |
|
|
|
|
|
|
(3)
Non-Current Liabilities |
|
|
|
|
(a) long-term borrowings |
1194.702 |
908.522 |
514.672 |
|
(b) Deferred tax liabilities (Net) |
395.756 |
296.539 |
276.112 |
|
(c) Other long term
liabilities |
28.945 |
1.831 |
0.000 |
|
(d) long-term
provisions |
26.697 |
84.634 |
20.073 |
|
Total Non-current
Liabilities (3) |
1646.100 |
1291.526 |
810.857 |
|
|
|
|
|
|
(4)
Current Liabilities |
|
|
|
|
(a) Short
term borrowings |
641.516 |
182.982 |
343.405 |
|
(b) Trade
payables |
1504.143 |
1507.786 |
883.704 |
|
(c) Other
current liabilities |
835.584 |
789.793 |
579.617 |
|
(d) Short-term provisions |
37.901 |
82.383 |
122.250 |
|
Total Current
Liabilities (4) |
3019.144 |
2562.944 |
1928.976 |
|
|
|
|
|
|
TOTAL |
8898.689 |
6584.729 |
5013.174 |
|
|
|
|
|
|
II.
ASSETS |
|
|
|
|
(1)
Non-current assets |
|
|
|
|
(a) Fixed Assets |
|
|
|
|
(i)
Tangible assets |
4920.624 |
4153.102 |
3336.896 |
|
(ii)
Intangible Assets |
6.824 |
4.486 |
4.760 |
|
(iii)
Capital work-in-progress |
56.267 |
115.901 |
46.251 |
|
(iv)
Intangible assets under development |
0.000 |
0.000 |
0.000 |
|
(b) Non-current Investments |
6.564 |
6.564 |
3.777 |
|
(c) Deferred tax assets (net) |
0.000 |
0.000 |
0.000 |
|
(d) Long-term Loan and Advances |
249.411 |
116.272 |
78.620 |
|
(e) Other
Non-current assets |
125.488 |
86.873 |
1.491 |
|
Total Non-Current
Assets |
5365.178 |
4483.198 |
3471.795 |
|
|
|
|
|
|
(2)
Current assets |
|
|
|
|
(a)
Current investments |
833.271 |
0.000 |
0.000 |
|
(b)
Inventories |
1024.249 |
661.288 |
513.881 |
|
(c) Trade
receivables |
1188.165 |
1186.048 |
866.682 |
|
(d) Cash
and cash equivalents |
228.359 |
36.805 |
33.185 |
|
(e)
Short-term loans and advances |
225.050 |
207.785 |
123.155 |
|
(f) Other
current assets |
34.417 |
9.605 |
4.476 |
|
Total
Current Assets |
3533.511 |
2101.531 |
1541.379 |
|
|
|
|
|
|
TOTAL |
8898.689 |
6584.729 |
5013.174 |
PROFIT
& LOSS ACCOUNT (STANDALONE)
|
|
PARTICULARS |
31.03.2017 |
31.03.2016 |
31.03.2015 |
||
|
|
SALES |
|
|
|
||
|
|
|
Income |
10174.407 |
9869.790 |
8247.744 |
|
|
|
|
Other Income |
47.090 |
9.672 |
8.989 |
|
|
|
|
TOTAL |
10221.497 |
9879.462 |
8256.733 |
|
|
|
|
|
|
|
||
|
Less |
EXPENSES |
|
|
|
||
|
|
|
Cost of Raw Materials and Components Consumed |
5760.000 |
5533.541 |
4770.497 |
|
|
|
|
Purchase of Stock-in-trade |
311.442 |
254.918 |
240.720 |
|
|
|
|
Changes in Inventories of finished goods, work-in-progress and
stock-in-trade |
(204.315) |
(66.905) |
(32.633) |
|
|
|
|
Employee Benefits Expenses |
1455.999 |
1268.724 |
982.549 |
|
|
|
|
Exceptional Items |
141.886 |
0.000 |
0.000 |
|
|
|
|
Other expenses |
1676.842 |
1609.578 |
1262.250 |
|
|
|
|
TOTAL |
9141.854 |
8599.856 |
7223.383 |
|
|
|
|
|
|
|
||
|
|
PROFIT/(LOSS)
BEFORE INTEREST, TAX, DEPRECIATION AND AMORTISATION |
1079.643 |
1279.606 |
1033.350 |
||
|
|
|
|
|
|
||
|
Less |
FINANCIAL
EXPENSES |
232.417 |
157.684 |
120.408 |
||
|
|
|
|
|
|
||
|
|
PROFIT/(LOSS)
BEFORE TAX, DEPRECIATION AND AMORTISATION |
847.226 |
1121.922 |
912.942 |
||
|
|
|
|
|
|
||
|
Less |
DEPRECIATION/
AMORTISATION |
392.252 |
330.349 |
306.335 |
||
|
|
|
|
|
|
||
|
|
PROFIT/(LOSS)
BEFORE TAX |
454.974 |
791.573 |
606.607 |
||
|
|
|
|
|
|
||
|
Less |
TAX |
126.009 |
219.726 |
183.968 |
||
|
|
|
|
|
|
||
|
|
PROFIT/(LOSS)
AFTER TAX |
328.965 |
571.847 |
422.639 |
||
|
|
|
|
|
|
||
|
Add |
PREVIOUS
YEARS’ BALANCE BROUGHT FORWARD |
1721.307 |
1322.140 |
1062.141 |
||
|
|
|
|
|
|
||
|
Less |
APPROPRIATIONS |
|
|
|
||
|
|
|
Interim Dividend paid |
0.000 |
59.811 |
0.000 |
|
|
|
|
Corporate Dividend Tax Paid on Interim Dividend |
0.000 |
12.176 |
0.000 |
|
|
|
|
Proposed Final Dividend |
0.000 |
35.887 |
83.736 |
|
|
|
|
Corporate Dividend Tax on Final Dividend |
0.000 |
7.306 |
17.047 |
|
|
|
|
Transitional adjustments related to Fixed Assets as per
schedule II of the Act |
0.000 |
0.000 |
19.357 |
|
|
|
|
Transfer to General Reserve |
35.000 |
57.500 |
42.500 |
|
|
|
BALANCE CARRIED
TO THE B/S |
2015.272 |
1721.307 |
1322.140 |
||
|
|
|
|
|
|
||
|
|
EARNINGS IN
FOREIGN CURRENCY |
|
|
|
||
|
|
|
FOB Value of Exports |
187.714 |
172.445 |
164.638 |
|
|
|
|
Design/ Testing/ Modification Charges Received |
23.989 |
20.611 |
0.000 |
|
|
|
|
Sales of Moulds & Dies |
0.000 |
1.721 |
0.000 |
|
|
|
|
Others |
0.000 |
0.038 |
0.056 |
|
|
|
TOTAL EARNINGS |
211.703 |
194.815 |
164.694 |
||
|
|
|
|
|
|
||
|
|
IMPORTS |
|
|
|
||
|
|
|
Raw Materials |
404.950 |
565.612 |
172.466 |
|
|
|
|
Capital Goods |
196.453 |
175.069 |
154.920 |
|
|
|
|
Trading Goods |
246.431 |
188.227 |
189.821 |
|
|
|
|
Components & Spare parts |
8.884 |
4.028 |
4.833 |
|
|
|
|
Consumable Store |
0.890 |
1.189 |
1.894 |
|
|
|
TOTAL IMPORTS |
857.608 |
934.125 |
523.934 |
||
|
|
|
|
|
|
||
|
|
Earnings /
(Loss) Per Share (INR) |
26.12 |
47.80 |
35.33 |
||
CURRENT MATURITIES OF LONG TERM DEBT DETAILS
|
Particulars |
31.03.2017 |
31.03.2016 |
31.03.2015 |
|
Current Maturities of Long term debt |
413.585 |
308.785 |
313.117 |
|
Cash generated from operating activities |
532.388 |
1407.790 |
962.053 |
|
Net cash from operating activities |
382.299 |
1215.228 |
820.760 |
QUARTERLY
RESULTS
|
Particulars |
30.06.2017 (Unaudited) |
30.09.2017 (Unaudited) |
31.12.2017 (Unaudited) |
|
|
1st
Quarter |
2nd
Quarter |
3rd
Quarter |
|
Net sales |
3255.280 |
3265.300 |
2859.190 |
|
Total Expenditure |
2947.210 |
2889.940 |
2500.830 |
|
PBIDT (Excluding Other Income) |
308.070 |
375.360 |
358.360 |
|
Other income |
18.060 |
12.840 |
6.230 |
|
Operating Profit |
326.130 |
388.200 |
364.590 |
|
Interest |
60.130 |
59.400 |
57.350 |
|
Exceptional Items |
NA |
NA |
NA |
|
PBDT |
266.000 |
328.790 |
307.240 |
|
Depreciation |
107.410 |
111.130 |
112.970 |
|
Profit Before Tax |
158.590 |
217.660 |
194.270 |
|
Tax |
55.160 |
74.410 |
68.350 |
|
Provisions and
contingencies |
NA |
NA |
NA |
|
Profit after tax |
103.430 |
143.250 |
125.920 |
|
Extraordinary Items |
NA |
NA |
NA |
|
Prior Period Expenses |
NA |
NA |
NA |
|
Other Adjustments |
NA |
NA |
NA |
|
Net Profit |
103.430 |
143.250 |
125.920 |
KEY
RATIOS
EFFICIENCY RATIOS
|
PARTICULARS |
31.03.2017 |
31.03.2016 |
31.03.2015 |
|
Average Collection Days (Sundry
Debtors / Income * 365 Days) |
42.62 |
43.86 |
38.35 |
|
|
|
|
|
|
Account Receivables Turnover (Income / Sundry Debtors) |
8.56 |
8.32 |
9.52 |
|
|
|
|
|
|
Average Payment Days (Sundry Creditors / Purchases * 365 Days) |
90.43 |
95.08 |
64.37 |
|
|
|
|
|
|
Inventory Turnover (Operating Income / Inventories) |
1.05 |
1.94 |
2.01 |
|
|
|
|
|
|
Asset Turnover (Operating Income / Net Fixed Assets) |
0.22 |
0.30 |
0.31 |
LEVERAGE RATIOS
|
PARTICULARS |
31.03.2017 |
31.03.2016 |
31.03.2015 |
|
Debt Ratio ((Borrowing
+ Current Liabilities) / Total Assets) |
0.52 |
0.57 |
0.55 |
|
|
|
|
|
|
Debt Equity Ratio (Total Liability / Networth) |
0.53 |
0.51 |
0.52 |
|
|
|
|
|
|
Current Liabilities to Networth (Current Liabilities / Net Worth) |
0.71 |
0.94 |
0.85 |
|
|
|
|
|
|
Fixed Assets to Networth (Net Fixed Assets / Networth) |
1.18 |
1.57 |
1.49 |
|
|
|
|
|
|
Interest Coverage Ratio (PBIT / Financial Charges) |
4.65 |
8.12 |
8.58 |
PROFITABILITY RATIOS
|
PARTICULARS |
|
31.03.2017 |
31.03.2016 |
31.03.2015 |
|
PAT to Sales ((PAT
/ Sales) * 100) |
% |
3.23 |
5.79 |
5.12 |
|
|
|
|
|
|
|
Return on Total Assets ((PAT / Total Assets) * 100) |
% |
3.70 |
8.68 |
8.43 |
|
|
|
|
|
|
|
Return on Investment (ROI) ((PAT / Networth) * 100) |
% |
7.77 |
20.94 |
18.59 |
SOLVENCY RATIOS
|
PARTICULARS |
31.03.2017 |
31.03.2016 |
31.03.2015 |
|
Current Ratio (Current
Assets / Current Liabilities) |
1.17 |
0.82 |
0.80 |
|
|
|
|
|
|
Quick Ratio ((Current Assets – Inventories) / Current
Liabilities) |
0.83 |
0.56 |
0.53 |
|
|
|
|
|
|
G-Score Ratio Financial (Networth / Total Assets) |
0.48 |
0.41 |
0.45 |
|
|
|
|
|
|
G-Score Ratio Debt (Debts / Equity Capital) |
17.10 |
11.71 |
9.79 |
|
|
|
|
|
|
G-Score Ratio Liquidity (Total Current Assets / Total Current Liabilities) |
1.17 |
0.82 |
0.80 |
Total
Liability = Short-term Debt + Long-term Debt + Current Maturities of Long-term
debts
STOCK
PRICES
|
Face Value |
INR 10.00/- |
|
Market Value |
INR 837.00/- |
FINANCIAL ANALYSIS
[all figures are
INR Million]
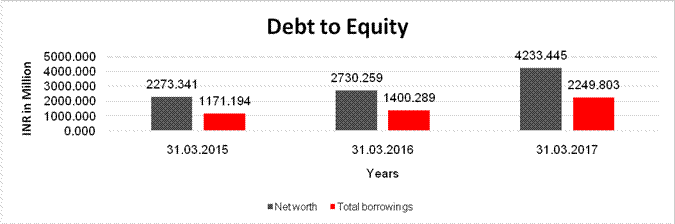
DEBT EQUITY RATIO
|
Particular |
31.03.2015 |
31.03.2016 |
31.03.2017 |
|
|
INR
In Million |
INR
In Million |
INR
In Million |
|
Share Capital |
119.622 |
119.622 |
131.598 |
|
Reserves & Surplus |
2153.719 |
2610.637 |
4101.847 |
|
Share Application money pending
allotment |
0.000 |
0.000 |
0.000 |
|
Net
worth |
2273.341 |
2730.259 |
4233.445 |
|
|
|
|
|
|
Long-Term Borrowings |
514.672 |
908.522 |
1194.702 |
|
Short Term Borrowings |
343.405 |
182.982 |
641.516 |
|
Current Maturities of Long term debt |
313.117 |
308.785 |
413.585 |
|
Total
borrowings |
1171.194 |
1400.289 |
2249.803 |
|
Debt/Equity
ratio |
0.515 |
0.513 |
0.531 |
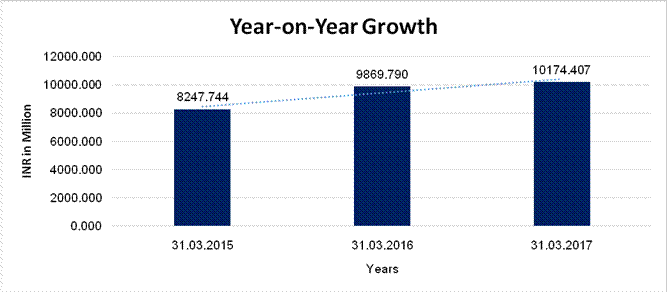
YEAR-ON-YEAR GROWTH
|
Year
on Year Growth |
31.03.2015 |
31.03.2016 |
31.03.2017 |
|
|
INR
In Million |
INR
In Million |
INR
In Million |
|
Sales |
8247.744 |
9869.790 |
10174.407 |
|
|
|
19.667 |
3.086 |
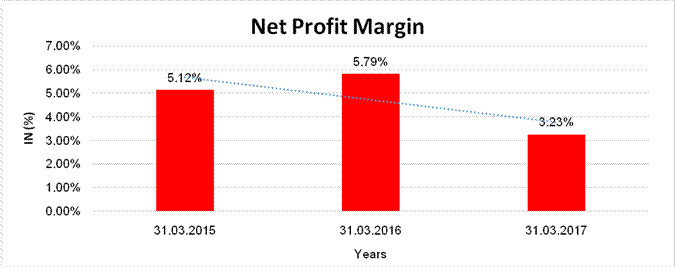
NET PROFIT MARGIN
|
Net
Profit Margin |
31.03.2015 |
31.03.2016 |
31.03.2017 |
|
|
INR
In Million |
INR
In Million |
INR
In Million |
|
Sales
|
8247.744 |
9869.790 |
10174.407 |
|
Profit |
422.639 |
571.847 |
328.965 |
|
|
5.12% |
5.79% |
3.23% |
ABRIDGED
BALANCE SHEET (CONSOLIDATED)
|
SOURCES OF FUNDS |
|
31.03.2017 |
31.03.2016 |
|
I.
EQUITY AND LIABILITIES |
|
|
|
|
(1)Shareholders' Funds |
|
|
|
|
(a) Share Capital |
|
131.598 |
119.622 |
|
(b) Reserves &
Surplus |
|
4104.856 |
2611.781 |
|
(c) Money received
against share warrants |
|
0.000 |
0.000 |
|
|
|
|
|
|
(2) Share Application
money pending allotment |
|
0.000 |
0.000 |
|
Total Shareholders’ Funds
(1) + (2) |
|
4236.454 |
2731.403 |
|
|
|
|
|
|
(3) Non-Current
Liabilities |
|
|
|
|
(a) long-term borrowings |
|
1194.702 |
908.522 |
|
(b) Deferred tax
liabilities (Net) |
|
395.756 |
296.539 |
|
(c) Other long term liabilities |
|
30.035 |
2.285 |
|
(d) long-term provisions |
|
26.728 |
84.783 |
|
Total Non-current
Liabilities (3) |
|
1647.221 |
1292.129 |
|
|
|
|
|
|
(4) Current Liabilities |
|
|
|
|
(a) Short term borrowings |
|
641.516 |
182.982 |
|
(b) Trade payables |
|
1501.699 |
1507.728 |
|
(c) Other current
liabilities |
|
840.442 |
790.312 |
|
(d) Short-term provisions |
|
38.271 |
83.065 |
|
Total Current Liabilities
(4) |
|
3021.928 |
2564.087 |
|
|
|
|
|
|
TOTAL |
|
8905.603 |
6587.619 |
|
|
|
|
|
|
II.
ASSETS |
|
|
|
|
(1) Non-current assets |
|
|
|
|
(a) Fixed Assets |
|
|
|
|
(i) Tangible assets |
|
4920.699 |
4153.211 |
|
(ii) Intangible Assets |
|
7.923 |
6.189 |
|
(iii) Capital
work-in-progress |
|
56.267 |
115.901 |
|
(iv) Intangible assets
under development |
|
0.000 |
0.000 |
|
(b) Non-current
Investments |
|
0.300 |
0.300 |
|
(c) Deferred tax assets
(net) |
|
0.000 |
0.000 |
|
(d) Long-term Loan and Advances |
|
247.092 |
113.909 |
|
(e) Other Non-current
assets |
|
125.597 |
87.062 |
|
Total Non-Current Assets |
|
5357.878 |
4476.572 |
|
|
|
|
|
|
(2) Current assets |
|
|
|
|
(a) Current investments |
|
833.271 |
0.000 |
|
(b) Inventories |
|
1024.249 |
661.304 |
|
(c) Trade receivables |
|
1198.079 |
1186.037 |
|
(d) Cash and cash
equivalents |
|
231.451 |
45.225 |
|
(e) Short-term loans and
advances |
|
226.258 |
208.876 |
|
(f) Other current assets |
|
34.417 |
9.605 |
|
Total Current Assets |
|
3547.725 |
2111.047 |
|
|
|
|
|
|
TOTAL |
|
8905.603 |
6587.619 |
PROFIT
& LOSS ACCOUNT (CONSOLIDATED)
|
|
PARTICULARS |
|
31.03.2017 |
31.03.2016 |
|
|
SALES |
|
|
|
|
|
Income |
|
10188.334 |
9881.594 |
|
|
Other Income |
|
47.090 |
9.706 |
|
|
TOTAL |
|
10235.424 |
9891.300 |
|
|
|
|
|
|
|
Less |
EXPENSES |
|
|
|
|
|
Cost of Raw Materials
and Components Consumed |
|
5760.000 |
5533.541 |
|
|
Purchases of
Stock-in-Trade |
|
313.245 |
255.848 |
|
|
Changes in inventories of
finished goods, work-in-progress and Stock-in-Trade |
|
(204.298) |
(66.914) |
|
|
Employees benefits
expense |
|
1461.221 |
1273.486 |
|
|
Exceptional Items |
|
141.886 |
0.000 |
|
|
Other expenses |
|
1680.271 |
1612.632 |
|
|
TOTAL |
|
9152.325 |
8608.593 |
|
|
|
|
|
|
|
|
PROFIT/ (LOSS) BEFORE INTEREST, TAX, DEPRECIATION AND
AMORTISATION |
|
1083.099 |
1282.707 |
|
|
|
|
|
|
|
Less |
FINANCIAL EXPENSES |
|
232.658 |
157.809 |
|
|
|
|
|
|
|
|
PROFIT / (LOSS) BEFORE TAX,
DEPRECIATION AND AMORTISATION |
|
850.441 |
1124.898 |
|
|
|
|
|
|
|
Less |
DEPRECIATION/
AMORTISATION |
|
392.891 |
331.201 |
|
|
|
|
|
|
|
|
PROFIT/ (LOSS) BEFORE TAX |
|
457.550 |
793.697 |
|
|
|
|
|
|
|
Less |
TAX |
|
126.296 |
220.367 |
|
|
|
|
|
|
|
|
PROFIT/ (LOSS) AFTER TAX
|
|
331.254 |
573.330 |
|
|
|
|
|
|
|
|
Earnings / (Loss) Per
Share (INR) |
|
26.30 |
47.93 |
LOCAL AGENCY FURTHER INFORMATION
|
Sr. No. |
Check list by
info agents |
Available in
Report (Yes/No) |
|
1 |
Year of establishment |
Yes |
|
2 |
Constitution of the entity -Incorporation
details |
Yes |
|
3 |
Locality of the entity |
Yes |
|
4 |
Premises details |
No |
|
5 |
Buyer visit details |
-- |
|
6 |
Contact numbers |
Yes |
|
7 |
Name of the person contacted |
No |
|
8 |
Designation of contact person |
No |
|
9 |
Promoter’s background |
Yes |
|
10 |
Date of Birth of Proprietor / Partners /
Directors |
Yes |
|
11 |
Pan Card No. of Proprietor / Partners |
No |
|
12 |
Voter Id Card No. of Proprietor / Partners |
No |
|
13 |
Type of business |
Yes |
|
14 |
Line of Business |
Yes |
|
15 |
Export/import details (if applicable) |
No |
|
16 |
No. of employees |
Yes |
|
17 |
Details of sister concerns |
Yes |
|
18 |
Major suppliers |
No |
|
19 |
Major customers |
No |
|
20 |
Banking Details |
Yes |
|
21 |
Banking facility details |
Yes |
|
22 |
Conduct of the banking account |
-- |
|
23 |
Financials, if provided |
Yes |
|
24 |
Capital in the business |
Yes |
|
25 |
Last accounts filed at ROC, if applicable |
Yes |
|
26 |
Turnover of firm for last three years |
Yes |
|
27 |
Reasons for variation <> 20% |
-- |
|
28 |
Estimation for coming financial year |
No |
|
29 |
Profitability for last three years |
Yes |
|
30 |
Major shareholders, if available |
Yes |
|
31 |
External Agency Rating, if available |
No |
|
32 |
Litigations that the firm/promoter
involved in |
-- |
|
33 |
Market information |
-- |
|
34 |
Payments terms |
No |
|
35 |
Negative Reporting by Auditors in the Annual
Report |
No |
COMPANY BACKGROUND
The Company is a public
limited company domiciled in India and incorporated under the provisions of the
Companies Act, 1956. The Company's registered office is at New Delhi and it has
several manufacturing plants and depots across the country. Its shares are
listed on National Stock Exchange and Bombay Stock Exchange in India. It has
one wholly owned foreign subsidiary-Fiem Industries Japan Co., Limited located
in Japan. The Company also has entered into a 50:50 Joint Venture with
Horustech Lighting SRL Italy and incorporated a Joint Venture, namely 'Centro
Ricerche Fiem Horustech SRL' which has been set-up at Italy as a design centre.
The Company has research and development facilities located at Rai, Sonepat,
Haryana which has been approved by Department of Science & Industrial
Research, Ministry of Science & Technology. The Company is in the business
of manufacturing and supply of auto components comprising of automotive
lighting & signalling equipments, rear-view mirror, prismatic mirror,
plastic moulded parts and sheet metal components for motorised vehicles, and
LED luminaries comprising of indoor and outdoor lighting, display panels and
integrated passengers information system.
STATE OF THE COMPANY’S AFFAIRS / BUSINESS REVIEW
During the year, Company
achieved a good growth in automotive business segment despite severe impact of
demonetization on overall economy. Net sales in automotive business grew by
11%. However, performance of LED business was not good during the year and net
revenue of LED Luminaries segment came down to INR 579.300 million in FY 2016-
17 as compared to INR 1191.700 million in FY 2015-16. Further, the Company has
supplied over 1,18,000 LED Street Light to EESL for SDMC project in Delhi under
SITC contract with comprehensive maintenance for 7 years. After commissioning,
the comprehensive maintenance is discontinued by EESL and a net amount of INR
141.900 million has been written-off as being non-recoverable from EESL (net of
reversal of earlier provision of INR 52.800 million). This exceptional item has
proved a dampener in the profitability of the Company. Further, some orders of
LED Bulbs have been short closed by EESL, due to steep price fall and other
reasons. One order of PVVNL, Meerut for LED Bulbs has also been short closed.
These all things coupled with demonetization has adversely impacted the LED
business.
During the year,
demonetization has adversly impacted overall business in the country in 3rd and
4th Quarter. Liquidity crunch was prevalent and automotive business was not an
exception. Sales at dealers end were not happening. Therefore, OEMs cut down
production drastically and their supplies to their major OEMs affected
adversely during this period.
However, management
believes that these are short term obstacles and in long term, LED provides a
huge opportunity in the country as well as for export opportunities. In India,
LED adoption is still in the initial phases and it will take some time to settle
the volatility in the market. At the automotive front, the outlook is promising
and the impact of demonetization is behind us. New regulations of BS-IV and AHO
are positive for the industry as well as for the Company. LED is being adopted
very fast in the automotive lighting applications. This is very positive
development for the Company as Company is frontrunner in the development of LED
Head lamps based on its in-house R&D capabilities.
Keeping in view the growth
prospective and to meet the capex requirements, Company augmented the financial
resources and raised INR 1200.000 million through Qualified Institutions
Placement (QIP) in September, 2016. Out of which INR 361.400 million have been
utilized towards cost of issue and capital expansion, the balance of INR
838.600 million have been temporarily invested in mutual funds/ fixed deposits.
During FY 2016-17, INR
210.000 million has been invested in newly set-up Unit of the Company in
Gujarat. Total Investment as on March 31, 2017 for Gujarat unit was INR 750.000
million. Investment in Tapukara Plant (Rajasthan) in LED Lighting products
facilities during FY 2016-17 was INR 230.000 million. During the Financial
year, the total capex was INR 1100.000 million in different units of the
Company.
During the year, they have
signed a “Technology License and Assistance Agreement” (TAA) with Aisan
Industry Co., Ltd., Japan and Toyota Tsusho Corporation, Japan for
manufacturing of ‘Canister’ in India. ‘Canister’ is an Emission Control System
Product. Under the TAA, the ‘Canister’ is manufactured by Fiem Industries Ltd.
with the technical support of Aisan Industry Co., Ltd. for two-wheelers and
three-wheelers in Indian market.
MANAGEMENT DISCUSSION AND ANALYSIS
Global economic overview
Global growth reduced to 3.1%
in 2016 and recovered to 3.4% in 2017. The estimate was revised by 0.1% for
2017 as compared to the April 2016 projection. This reflected a subdued outlook
following the Brexit referendum and weak growth in the US. However, long-term
prospects of emerging market economies improved because of a visible lowering
of interest rates in advanced economies and firming commodity prices.
Asia in general and India
in particular demonstrated robust growth while sub-Saharan Africa experienced a
slowdown among advanced economies, activity rebounded strongly in the US with
the economy approaching full employment. Long-term nominal and real interest
rates rose in the UK and the US since November 2016. The currencies of advanced
commodity exporters strengthened, reflecting the firming of commodity prices.
OUTLOOK
The global economy entered
its sixth year of stagnation with growth estimates for 2017 continuing to trend
the historical path. A projected stabilisation in energy and commodity prices
could provide some respite for resource-rich economies in 2017, but the
medium-term outlook continues to be bleak with growth weakening in terms of
investment and labour supply. Businesses will need to prepare themselves
adequately in order to address the challenges arising out of geopolitical
tensions, policy uncertainties, financial market volatilities and rapid changes
in technology. They can do so by leveraging qualitative sources of growth and
boosting their technological quotients and business productivity ratios.
INDIAN ECONOMY
OVERVIEW
India’s GDP grew at 7.1% in
FY17 versus a revised 8% (7.9% as per previous estimate) in FY16. India’s GDP
growth in the January-March quarter was lower than China’s 6.9% for this
period. Demonetisation had a pronounced broad-based impact on the economy in
the fourth quarter. Despite a sequential slowdown, agriculture and mining
sectors held up with consumption being robust. Manufacturing, construction and
major services were hit by the currency squeeze, pulling down real gross
domestic product (GDP) growth in Q4FY17 to 6.1% from 7%.
The lower-than-expected
real GDP growth in Q4FY17 was also due to the firming of commodity prices,
which hardened WPI. The GVA (Growth Value Added) growth in Q4FY17 was pegged at
just 5.6%, as an unfavourable base also impacted the estimate (GVA grew a
robust 8.7% in Q4FY16). The GVA expansion slipped sharply to 6.6% in FY17 from
7.9% in FY16.
Pertinently, although
growth in real term slipped in FY17, nominal GDP expansion touched 11% in the
year against 9.9% in FY16, owing to higher inflation, especially at the
wholesale level. With good monsoon, the agricultural sector posted a huge jump
in growth as it expanded by 4.9% during FY17, compared to a dismal 0.7% in the
previous year.
OUTLOOK
The growth estimate is
contingent on the prediction of normal monsoon in this year, along with
expectation of a boost in consumption demand, increased private sector and
government spending. The nationwide roll-out of the GST (Goods and Services
Tax) in the second quarter of FY18 is also expected to result in an increment
of 0.25% to 0.5% to GDP growth. CARE Ratings expects the economy to grow
7.6-7.8% in FY18.
INDIAN AUTO COMPONENTS SECTOR
OVERVIEW
The auto-components industry
accounts for almost 7% of India’s Gross Domestic Product (GDP) and employs as
many as 19 million people directly and indirectly. Over the last decade, the
automotive components industry trebled to US$ 39 billion in 2015-16 while
exports grew faster to US$ 10.8 billion.
A stable government
framework, increased purchasing power, large domestic market, and growing
infrastructure development have made India a favourable investment destination.
The cumulative Foreign Direct Investment (FDI) inflows in the Indian automobile
industry between April 2000 and September 2016 were US$ 15.80 billion.
Private equity investment
in the automobile component sector rose 607% to US$ 90.2 million in the first
five months of 2017 over the same period in the previous year.
OUTLOOK
The fiscal 2017-18 augurs
favorably for the Indian automotive sector, which is expected to grow 8-10%
based on higher localisation by Original Equipment Manufacturers (OEM), higher
domestic component content per vehicle and rising exports. The components
industry is projected to clock US$ 50 billion in revenue by 2018-19, up from
US$ 39 billion in 2016-17.
According to the Automotive
Component Manufacturers Association of India (ACMA), the Indian auto-components
industry is expected to register a turnover of US$ 100 billion by 2020 backed
by strong exports ranging between US$ 80 and100 billion by 2026, from the
current US$ 11.2 billion.
Indian LED market overview
The Indian LED Lighting
market was worth around US$ 3.7 billion in 2016, growing at a CAGR of around
17.5% during 2009-2016. LED lights have emerged as powerful sources for
lighting over the past several years. Due to their numerous advantages over
conventional lighting technology, they have gained prominence. Although the
Indian LED lighting market is at a nascent stage, it offers innumerable
opportunities for growth over the next few decades. As India represents one of
the biggest lighting markets, it offers a lucrative option for LED
manufacturers to set up facilities in the region. Skilled labor, ease of doing
business and demographic advantages provide a sustainable growth environment
for the industry.
There is another
development that promises to enhance the visibility and offtake of LED
luminaires in India. The Energy Efficiency Services Limited is one of the nodal
Indian agencies actively propagating and implementing the replacement of
conventional street lighting products with LED alternatives.
EESL seeks to unlock
energy-efficiency, estimated to be a US$12 billion opportunity that can
potentially result in energy savings up to 20 per cent of current consumption.
EESL’s programme are paving the roadmap for making energy efficiency more
accessible, affordable and safer for cities and dwellings.
EESL has evolved a service
model to enable urban municipalities to replace conventional lights with LEDs
at no upfront cost; the balance cost is recovered from municipalities through
energy savings. The Street Lighting National Programme intends to replace 3.5
crore conventional street lights with smart and energy-efficient LED street
lights by March 2019.
The programme is attractive
for the savings it can generate: the total connected load of street lights
across the country of around 3400 MW can be reduced to 1400 MW by replacing
conventional lights with LED-based alternatives. These replacements can lead to
savings of approximately 9 billion KWh of energy resulting in a cost savings of
Rs. 5,500 crore to municipalities each year. Given this opportunity, there are
a number of municipal corporations that are embracing the use of LED products
in street lighting applications.
However, unhealthy and
disruptive practices and predatory pricing have dampened the healthy growth of
the industry and affected genuine players and stakeholders. Fragmented
competition and low-entry barriers are proving to be an obstacle for serious
players. This appears to be a short-term phenomenon as LED represents a large
opportunity for India and realities should stabilize after short-term
turbulence.
OPERATIONAL REVIEW
The year could be referred
as one of the most challenging years in recent times. The demonetization of
high value currency notes of INR 500 and INR 1000 in the economy and the
unexpected write-off of their LED street lighting order from EESL adversely
affected their overall performance. At the end of the year, BS-IV and
implementation of AHO changed the momentum towards a positive direction.
Rather, now this overview reconciles two contrasting emotions – one is the optimism
for their automotive business across the foreseeable future and positivity
emerging from this business; the other is the disruption in LED luminaire
business that impacted us adversely during the year.
On the automotive front,
the outlook is promising as the impact of demonetization is behind us. New
regulations of BS-IV and AHO are positive for the industry as well as for their
Company. LED is being adopted rapidly in the automotive lighting applications,
a positive development as the company is a frontrunner in the development of
LED Head lamps on the strengths of its in-house R&D capabilities.
Keeping in view this growth
prospective and capex needs, the company augmented its financial resources and
raised INR 1200.000 million through a Qualified Institutions Placement (QIP) in
September, 2016.
Further, during the year ,
the Company signed a Technology License and Assistance Agreement” (TAA) with
Aisan Industry Co., Limited, Japan, and Toyota Tsusho Corporation, Japan, for
manufacturing a ‘Canister’ in India. ‘Canister’ is an Emission Control System
Product. Under the TAA, the ‘Canister’ is manufactured by Fiem Industries
Limited with the technical support of Aisan Industry Co., Limited for two
wheelers and three-wheelers in the Indian market.
A snapshot of investments
made by the Company during the year is as under:
·
During
FY17, Company made an investment of INR 210.000 million in a newly set-up
facility in Gujarat. The total Investment as on 31st March 2017 for this unit
was INR 750.000 million.
·
During
FY17, Company also made further investment of INR 230.000 million in Tapukara
plant (Rajasthan) in LED Lighting products facilities.
·
The
total capex by the Company for FY17 was INR 1100.000 million, including other
capital expenditure.
·
The
Company is investing in LED head lamp manufacturing facilities as demand for
the LED head lamp from its prestigious OEM customers was encouraging.
FINANCIAL REVIEW
During the third quarter of
the year, the country, economy, automotive sector and the company were affected
by the currency demonetization. This impact was most visibly reflected in the
country’s two-wheeler segment; this segment is largely influenced by cash
purchases and negligible external financing, making its purchase pattern
completely different from the rest of the automotive sector.
With consumption sentiment
being extensively affected from November 2016 to February 2017, a number of
intending two wheeler buyers deferred their purchases. The result was that most
prominent OEMs in the country decided to temporarily discontinue operations.
The cascade impact of this affected all two-wheeler brands in the country, a
number of them being their prominent buyers. As an extension, Fiem Industries
was also affected by this slowdown.
A snapshot of the financial
highlights of the Company during the year was as under:
·
During
FY17, net revenues of the automotive segment grew by 11% to INR 9595.100
million in FY17 compared to INR 8678.100 million in FY16.
·
Net
revenues of LED luminaries segment came down to INR 579.300 million in FY17
compared to INR 1191.700 million in FY16.
·
The
EBIDTA margins for the LED luminaries segment was 5.43% during FY17 due to low
revenues in Q4FY17 and an overall decline in the turnover of LED luminaries for
the whole year.
·
The
company supplied 1,18,997 numbers of LED street lights to EESL for the SDMC
project in Delhi under the SITC contract with a comprehensive maintenance for
seven years. After commissioning, the comprehensive maintenance is discontinued
by EESL and a net amount of INR 141.900 million was written-off as being
non-recoverable from EESL (net of reversal of earlier provision of INR 52.800
million).
·
The
company supplied 10.99 lac units of LED bulbs (value INR 98.100 million) to
PVVNL, Meerut, out of which Company may receive approximately 3.60 lac units of
LED bulbs (value INR 31.000 million) in the current financial year. The order
is now short closed.
For the time being, the LED
business is undergoing a difficult phase. Growth was adversely impacted due to
disruptive practices and under-pricing. However, the automotive business
started picking up after demonetization and is showing good signs of recovery.
New regulations of AHO positively impact the automotive lighting business as
LED is being rapidly adopted in automotive applications.
An underperformance in the
LED business has overshadowed the recovery in automotive business and overall
profitability was impacted due to short closures of LED bulb orders and
write-offs of around INR 190.000 million (INR 140.000 million new amount after
the provision of 5 crore) with respect to a street light order of EESL for
SDMC. These realities pulled down the net profit of the Company.
The management feels that
it will take some time the LED Business to stabilize.
STANDALONE
UNAUDITED FINANCIAL RESULTS FOR THE QUARTER AND NINE MONTHS ENDED 31ST
DECEMBER 2017
(INR In Million)
|
Particulars |
Quarter ended |
Nine Months ended |
|
|
|
31.12.2017 |
30.09.2017 |
31.12.2017 |
|
|
Unaudited |
||
|
INCOME FROM OPERATIONS |
|
|
|
|
Gross sales |
2843.204 |
3249.467 |
9325.935 |
|
Other Operating Income |
15.989 |
15.830 |
53.833 |
|
Revenue from operations |
2859.193 |
3265.297 |
9379.768 |
|
Other Income |
6.229 |
12.836 |
37.125 |
|
Total
Income from Operations |
2865.422 |
3278.133 |
9416.893 |
|
|
|
|
|
|
EXPENSES |
|
|
|
|
Cost of materials consumed |
1642.604 |
1998.905 |
5550.494 |
|
Purchase of Stock in Trade |
13.872 |
10.011 |
32.836 |
|
Changes in inventories of finished goods and
work-in-progress |
(32.761) |
(26.481) |
(230.930) |
|
Excise duty on sales |
0.000 |
0.000 |
347.799 |
|
Employee benefits expense |
437.229 |
482.272 |
1324.756 |
|
Finance Costs |
57.349 |
59.401 |
176.882 |
|
Depreciation and Amortization expenses |
112.968 |
111.133 |
331.506 |
|
Other Expenditure |
439.894 |
425.233 |
1313.036 |
|
Total
Expenses |
2671.155 |
3060.474 |
8846.379 |
|
Profit / (Loss) from ordinary activities before
Exceptional items |
194.267 |
217.659 |
570.514 |
|
Exceptional items |
-- |
-- |
-- |
|
Profit / (Loss) before Tax |
194.267 |
217.659 |
570.514 |
|
Tax Expense |
68.348 |
74.407 |
197.915 |
|
Profit
/ (Loss) after Tax |
125.919 |
143.252 |
372.599 |
|
Other Comprehensive Income |
|
|
|
|
·
Items that will not be
reclassified to profit or loss |
|
|
|
|
- Remeasurement of defined benefit liability/ asset |
(2.971) |
(3.027) |
(6.326) |
|
- Income tax relating to items that will not be reclassified to profit
or loss |
0.823 |
0.838 |
1.751 |
|
Total items that will not be reclassified to profit or loss (Net of
income tax) |
(2.148) |
(2.189) |
(4.575) |
|
·
Items that will be
reclassified to profit or loss |
-- |
-- |
-- |
|
Total other comprehensive income (Net of income tax) |
(2.148) |
(2.189) |
(4.575) |
|
Total other Comprehensive Income for the period |
123.771 |
141.063 |
368.024 |
|
Paid-up Equity Share Capital (Face value INR 10/- per
share) |
131.598 |
131.598 |
131.598 |
|
Reserves (excluding Revaluation Reserve) |
-- |
-- |
-- |
|
Earnings
per Share (EPS) - INR |
9.41 |
10.72 |
27.97 |
SEGMENT WISE
REVENUE, RESULTS AND CAPITAL EMPLOYED
(INR In Million)
|
Particulars |
Quarter
ended |
Nine Months ended |
|
|
|
31.12.2017 |
30.09.2017 |
31.12.2017 |
|
|
Unaudited |
||
|
1. Segment Revenue |
|
|
|
|
a) Automotive Segment |
2831.314 |
3236.813 |
9350.496 |
|
b) LED Luminaries Segment |
27.879 |
28.484 |
29.272 |
|
Total segment
revenue |
2859.193 |
3265.297 |
9379.768 |
|
Less: Inter –
segment revenue |
-- |
-- |
-- |
|
Total income from
operations (net sales) |
2859.193 |
3265.297 |
9379.768 |
|
|
|
|
|
|
2. Segment
Results |
|
|
|
|
Profit/ (loss)
before tax and interest |
|
|
|
|
a) Automotive Segment |
298.508 |
322.309 |
886.326 |
|
b) LED Luminaries Segment |
(15.730) |
(21.266) |
(62.174) |
|
Total segment
results |
282.778 |
301.043 |
824.152 |
|
(Add)/Less:
Finance Costs |
57.349 |
59.401 |
176.882 |
|
Other
un-allocable expenditure net off un-allocable other operating income |
31.162 |
23.983 |
76.756 |
|
Total Profit Before
Tax |
194.267 |
217.659 |
570.514 |
|
|
|
|
|
|
3. Segment Assets |
|
|
|
|
a) Automotive Segment |
6970.685 |
7157.573 |
6970.685 |
|
b) LED Luminaries Segment |
1290.501 |
1293.642 |
1290.501 |
|
Unallocable Corporate Assets |
433.833 |
684.190 |
433.833 |
|
Total segment Assets |
8695.019 |
9135.405 |
8695.019 |
|
|
|
|
|
|
4.
Segment Liabilities |
|
|
|
|
a) Automotive Segment |
1783.144 |
2246.240 |
1783.144 |
|
b) LED Luminaries Segment |
29.830 |
39.647 |
29.830 |
|
Unallocable Corporate Assets |
2542.559 |
2633.804 |
2542.559 |
|
Total segment Liabilities |
4355.533 |
4919.691 |
4355.533 |
|
|
|
|
|
|
CAPITAL EMPLOYED (Segment
Assets Less Segment Liabilities |
|
|
|
|
a) Automotive Segment |
5187.541 |
4911.333 |
5187.541 |
|
b) LED Luminaries Segment |
1260.671 |
1253.995 |
1260.671 |
|
Unallocable Corporate Assets |
(2108.726) |
(1949.614) |
(2108.726) |
|
TOTAL CAPITAL EMPLOYED |
4339.486 |
4215.714 |
4339.486 |
NOTES:
1. The above results have been reviewed by the Audit Committee and approved by the Board of Directors of the company in their respective meetings held on February 13, 2018. The statutory auditors of the company have carried out Limited Review on the above results.
2. These results have been prepared in accordance with the Companies ( Indian Accounting Standards) Rules, 2015 (Ind AS) prescribed under Section 133 of the Companies Act 2013 read with relevant rules issued thereunder and the other accounting principles generally accepted in India and accordingly the results have been prepared in accordance with the recognition and measurement principles laid down in the Ind AS-34 "Interim Financial Reporting". Beginning 1st April 2017, the company has for the first time adopted Ind AS with a transition date of 1st April 2016.
3. Post the applicability of Goods and Service tax (GST) with effect from 1st July 2017, sales are required to be disclosed net of GST. Accordingly the Gross Sales Figures for the Quarter and Nine Months ended 31.12.17 are not comparable with the previous periods presented in the results.. The following additional information is provided to to make sales figures comparable.
(INR In
Million)
|
Particulars |
Quarter
ended |
Nine Months ended |
|
|
|
31.12.2017 |
30.09.2017 |
31.12.2017 |
|
|
Unaudited |
||
|
Gross sales |
2843.204 |
3249.467 |
9325.935 |
|
Less Excise duty on sales |
-- |
-- |
347.799 |
|
Net Sales
(Excluding excise duty) |
2843.204 |
3249.467 |
8978.136 |
4. A fire incident happened on 25.01.2018 around noon in one block of Unit-5, situated at Kelamanglam Road, Achettipalli Post, Hosur 635110,Tamilnadu. The incident resulted in substantial damage to plant and machinery and Inventory etc. in the said block. The company is in the process of ascertaining the loss caused by fire. Further, the company has initiated the process for filing insurance claim as per the insurance cover.
5. The Statement does not include Ind AS compliant results for the previous year ended March 31, 2017 as the same is not mandatory as per SEBI's Circular dated July 5, 2016.
6. Reconciliation of Profit after tax for the Quarter and Nine months ended December 31, 2017 between Ind AS compliant results.
7. In terms of Regulation 33(3) of the SEBI (Listing Obligations and Disclosure Requirements) Regulations, 2015, the Company has availed the option of submitting un-audited quarterly financial results only on standalone basis.
8. Provision for Taxation includes current tax, deferred tax and is net of MAT Entitlement credit available to the company, if any.
9. Previous period’s figures have been regrouped/ rearranged wherever necessary, to make them comparable.
10. These results for the Quarter and nine months ended December 31, 2017 are available on the website of the Company (www.fiemindustries.com) and website of the Stock Exchanges viz. BSE Limited (www.bseindia.com) and National Stock Exchange of India Limited (www.nseindia.com).
11. During FY 2016-17, the company had issued and allotted 11,97,604 equity shares of INR 10 each at a premium of Rs 992 per equity share by way of Qualified Institutions Placement (QIP).
12. The Company is engaged m the business of manufacturing and supply of auto components comprising of automotive lighting and signaling equipments, rear view mirrors, plastic molded parts and sheet metal components for motorized vehicles, and LED luminaries for indoor and outdoor applications and integrated passenger information systems with LED Display.
As per IND AS108 Operating
Segment, the Company has identified two reportable segments, as described
below:
a) Automotive segment comprising of automotive lights and signaling equipment,
rear view mirrors, plastic moulded and other automotive parts.
b) LED Luminaries Segment comprising of LED Luminaries i.e. indoor and outdoor lighting products, display panels and LED integrated Passenger Information Systems
INDEX OF CHARGES:
|
S No |
SRN |
Charge Id |
Charge Holder Name |
Date of Creation |
Date of Modification |
Date of Satisfaction |
Amount |
Address |
|
1 |
G84581883 |
100170867 |
HDFC BANK LIMITED |
14/03/2018 |
- |
- |
1450000.0 |
HDFC BANK HOUSE, SENAPATI BAPAT MARG LOWER PAREL W MUMBAI MH400013IN |
|
2 |
G84574052 |
100170853 |
HDFC BANK LIMITED |
09/02/2018 |
- |
- |
2680001.0 |
HDFC BANK HOUSE, SENAPATI BAPAT MARG LOWER PAREL W MUMBAI MH400013IN |
|
3 |
G76877737 |
100154787 |
HDFC BANK LIMITED |
02/01/2018 |
- |
- |
8700000.0 |
HDFC BANK HOUSE, SENAPATI BAPAT MARG LOWER PAREL (WEST) MUMBAI MH400013IN |
|
4 |
G54464359 |
100124880 |
HDFC BANK LIMITED |
31/08/2017 |
- |
- |
2645000.0 |
HDFC BANK HOUSE, SENAPATI BAPAT MARG LOWER PAREL W MUMBAI MH400013IN |
|
5 |
G50575455 |
100116122 |
HDFC BANK LIMITED |
13/07/2017 |
- |
- |
2600000.0 |
HDFC BANK HOUSE, SENAPATI BAPAT MARG LOWER PAREL W MUMBAI MH400013IN |
|
6 |
G50365980 |
100115734 |
HDFC BANK LIMITED |
11/07/2017 |
- |
- |
2240000.0 |
HDFC BANK HOUSE, SENAPATI BAPAT MARG LOWER PAREL W MUMBAI MH400013IN |
|
7 |
G48858864 |
100111254 |
HDFC BANK LIMITED |
28/06/2017 |
- |
- |
2000000.0 |
HDFC BANK HOUSE, SENAPATI BAPAT MARG LOWER PAREL W MUMBAI MH400013IN |
|
8 |
G48170278 |
100108968 |
HDFC BANK LIMITED |
22/06/2017 |
- |
- |
3375000.0 |
HDFC BANK HOUSE, SENAPATI BAPAT MARG LOWER PAREL W MUMBAI MH400013IN |
|
9 |
G45193943 |
100101070 |
HDFC BANK LIMITED |
29/04/2017 |
- |
- |
1950000.0 |
HDFC BANK HOUSE, SENAPATI BAPAT MARG LOWER PAREL (WEST) MUMBAI MH400013IN |
|
10 |
G10685485 |
100047669 |
HDFC BANK LIMITED |
25/07/2016 |
- |
- |
875000.0 |
HDFC BANK HOUSE, SENAPATI BAPAT MARG LOWER PAREL (WEST) MUMBAI MH400013IN |
FIXED ASSETS:
Tangible Assets
· Land Free hold
· Land Lease hold
· Buildings
· Plant and Equipment
· Furniture and Fixtures
· Vehicles
· Office Equipment
· Mould, Block and Dies
· Tools and Equipments
· Electrical Installations
· Computers
Intangible Assets
· Computer Software
· Technical Know-how
· Trademarks
CMT REPORT (Corruption, Money Laundering & Terrorism]
The Public Notice information has been collected from various sources
including but not limited to: The Courts,
1] INFORMATION ON
DESIGNATED PARTY
No records exist designating subject or any of its beneficial owners,
controlling shareholders or senior officers as terrorist or terrorist
organization or whom notice had been received that all financial transactions
involving their assets have been blocked or convicted, found guilty or against
whom a judgement or order had been entered in a proceedings for violating
money-laundering, anti-corruption or bribery or international economic or
anti-terrorism sanction laws or whose assets were seized, blocked, frozen or
ordered forfeited for violation of money laundering or international
anti-terrorism laws.
2] Court Declaration :
No records exist to suggest that subject is
or was the subject of any formal or informal allegations, prosecutions or other
official proceeding for making any prohibited payments or other improper
payments to government officials for engaging in prohibited transactions or
with designated parties.
3] Asset Declaration :
No records exist to suggest that the property or assets of the subject
are derived from criminal conduct or a prohibited transaction.
4] Record on Financial
Crime :
Charges or conviction
registered against subject: None
5] Records on Violation of
Anti-Corruption Laws :
Charges or
investigation registered against subject: None
6] Records on Int’l
Anti-Money Laundering Laws/Standards :
Charges or
investigation registered against subject: None
7] Criminal Records
No
available information exist that suggest that subject or any of its principals
have been formally charged or convicted by a competent governmental authority
for any financial crime or under any formal investigation by a competent
government authority for any violation of anti-corruption laws or international
anti-money laundering laws or standard.
8] Affiliation with
Government :
No record
exists to suggest that any director or indirect owners, controlling
shareholders, director, officer or employee of the company is a government
official or a family member or close business associate of a Government
official.
9] Compensation Package :
Our market survey
revealed that the amount of compensation sought by the subject is fair and
reasonable and comparable to compensation paid to others for similar services.
10] Press Report :
No press reports / filings exists on
the subject.
CORPORATE GOVERNANCE
MIRA INFORM as part of its Due Diligence do provide comments on
Corporate Governance to identify management and governance. These factors often
have been predictive and in some cases have created vulnerabilities to credit
deterioration.
Our Governance Assessment focuses principally on the interactions
between a company’s management, its Board of Directors, Shareholders and other
financial stakeholders.
CONTRAVENTION
Subject is not known to have contravened any existing local laws,
regulations or policies that prohibit, restrict or otherwise affect the terms
and conditions that could be included in the agreement with the subject.
FOREIGN EXCHANGE RATES
|
Currency |
Unit
|
INR |
|
US Dollar |
1 |
INR 68.02 |
|
|
1 |
INR 91.25 |
|
Euro |
1 |
INR 80.07 |
INFORMATION DETAILS
|
Information
Gathered by : |
GYT |
|
|
|
|
Analysis Done by
: |
VAR |
|
|
|
|
Report Prepared
by : |
NKT |
SCORE FACTORS
|
DEMERIT POINTS |
|
|
|
--BANK CHARGES |
YES/NO |
YES |
|
--LITIGATION |
YES/NO |
NO |
|
--OTHER ADVERSE INFORMATION |
YES/NO |
NO |
|
MERIT POINTS |
|
|
|
--SOLE DISTRIBUTORSHIP |
YES/NO |
NO |
|
--EXPORT ACTIVITIES |
YES/NO |
NO |
|
--AFFILIATION |
YES/NO |
YES |
|
--LISTED |
YES/NO |
YES |
|
--OTHER MERIT FACTORS |
YES/NO |
YES |
RATING EXPLANATIONS
|
Credit Rating |
Explanation |
Rating Comments |
|
A++ |
Minimum Risk |
Business dealings permissible with minimum
risk of default |
|
A+ |
Low Risk |
Business dealings permissible with low
risk of default |
|
A |
Acceptable Risk |
Business dealings permissible with
moderate risk of default |
|
B |
Medium Risk |
Business dealings permissible on a regular
monitoring basis |
|
C |
Medium High Risk |
Business dealings permissible preferably
on secured basis |
|
D |
High Risk |
Business dealing not recommended or on
secured terms only |
|
NB |
New Business |
No recommendation can be done due to
business in infancy stage |
|
NT |
No Trace |
No recommendation can be done as the
business is not traceable |
NB is stated where there is insufficient information to facilitate rating. However, it is not to be considered as unfavourable.
This score serves as a reference to assess
SC’s credit risk and to set the amount of credit to be extended. It is
calculated from a composite of weighted scores obtained from each of the major
sections of this report. The assessed factors are as follows:
·
Financial
condition covering various ratios
·
Company
background and operations size
·
Promoters
/ Management background
·
Payment
record
·
Litigation
against the subject
·
Industry
scenario / competitor analysis
·
Supplier
/ Customer / Banker review (wherever available)
This report is issued at
your request without any risk and responsibility on the part of MIRA INFORM
PRIVATE LIMITED (MIPL) or its officials.