|
|
|

MIRA INFORM REPORT
|
Report No. : |
511084 |
|
Report Date : |
25.05.2018 |
IDENTIFICATION DETAILS
|
Name : |
GP PETROLEUMS LIMITED (w.ef. 10.04.2015) |
|
|
|
|
Formerly Known
As : |
SAH PETROLEUMS LIMITED |
|
|
|
|
Registered
Office : |
804, 8th Floor, Ackruti Star, MIDC Central Road, MIDC, Andheri (East), Mumbai – 400093, Maharashtra |
|
Tel. No.: |
91-22-61482500 |
|
|
|
|
Country : |
India |
|
|
|
|
Financials (as
on) : |
31.03.2017 |
|
|
|
|
Date of
Incorporation : |
06.07.1983 |
|
|
|
|
Com. Reg. No.: |
11-030372 |
|
|
|
|
Capital
Investment / Paid-up Capital : |
INR 254.922 Million |
|
|
|
|
CIN No.: [Company Identification
No.] |
L23201MH1983PLC030372 |
|
|
|
|
IEC No.: [Import-Export Code No.] |
Not Divulged |
|
|
|
|
PAN No.: [Permanent Account No.] |
Not Divulged |
|
|
|
|
GSTN : [Goods & Service Tax
Registration No.] |
Not Divulged |
|
|
|
|
TAN No.: [Tax Deduction &
Collection Account No.] |
Not Available |
|
|
|
|
Legal Form : |
A Public Limited Liability Company. The Company’s Shares are Listed on
the Stock Exchanges. |
|
|
|
|
Line of Business
: |
Production of Lubricant Oils, Greases, Rubber Process Oils and Other Products from Crude Oil (Registered Activity) |
|
|
|
|
No. of Employees
: |
257 (Approximately) |
RATING & COMMENTS
(Mira Inform has adopted New Rating mechanism w.e.f. 23rd
January 2017)
|
MIRA’s Rating : |
A+ |
|
Credit Rating |
Explanation |
Rating Comments |
|
A+ |
Low Risk |
Business dealings permissible with low
risk of default |
|
Status : |
Good |
|
|
|
|
Payment Behaviour : |
Regular |
|
|
|
|
Litigation : |
Clear |
|
|
|
|
Comments : |
Subject is a flagship company of “Gulf Petrochem Pte Limited” incorporated in the year 1983 and it is having a fine track record. For the financial year 2017, the company has achieved decent growth in its revenue as compared to its previous year along with fair profit margin during the year. GPPL has a robust financial risk profile, reflected in adequate liquidity and healthy capital structure backed by absence of debt funded capex and healthy accruals. Rating continue to derive strength from its established market position arising from its brand IPOL, in the Industrial lubricant and oils segment along with its association with Gulf Petrochem Group, which has entered into a strategic alliance with REPSOL, S.A. of Spain for manufacturing and sales of Repsol's premium lubricants across India. The company has its share price trading at around INR 68.00 on BSE as on 23rd May 2018 as against its face value of INR 5. As per quarterly financials of December 2017, the company has achieved a sales turnover of INR 1979.761million and reported fair profit margin of approximately 3% These strengths are partially offset by highly competitive lubricants industry, volatility in raw material prices, and working capital-intensive operations. Payment seems to be regular. In view of aforesaid, the company can be considered for business dealing at usual trade terms and conditions. |
NOTES :
Any query related to this report can be made
on e-mail : infodept@mirainform.com
while quoting report number, name and date.
EXTERNAL AGENCY RATING
|
Rating Agency Name |
CRISIL |
|
Rating |
Long term rating = A- |
|
Rating Explanation |
Adequate degree of safety and low credit risk. |
|
Date |
04.05.2018 |
|
Rating Agency Name |
CRISIL |
|
Rating |
Short term rating = A2+ |
|
Rating Explanation |
Strong degree of safety and low credit risk. |
|
Date |
04.05.2018 |
RBI DEFAULTERS’ LIST STATUS
Subject’s name is not enlisted as a defaulter
in the publicly available RBI Defaulters’ list.
EPF (Employee Provident Fund) DEFAULTERS’ LIST STATUS
Subject’s name is not enlisted as a defaulter
in the publicly available EPF (Employee Provident Fund) Defaulters’ list as of
31-03-2018.
BIFR (Board for Industrial & Financial Reconstruction) LISTING STATUS
Subject’s name is not listed as a Sick Unit in
the publicly available BIFR (Board for Industrial & Financial
Reconstruction) list as of 25.05.2018
IBBI (Insolvency and Bankruptcy Board of India) LISTING STATUS
Subject’s name is not listed in the publicly
available IBBI (Insolvency and Bankruptcy Board of India) list as of report
date.
INFORMATION DECLINED
Management non-cooperative (Tel No.:22-61482500)
LOCATIONS
|
Registered Office /Head Office / Regional Office 1: |
804, 8th Floor, Ackruti Star, MIDC Central Road, MIDC, Andheri (East), Mumbai – 400093, Maharashtra, India |
|
Tel. No.: |
91-22-61482500 |
|
Fax No.: |
91-22-61482599 |
|
E-Mail : |
|
|
Website : |
|
|
|
|
|
Vasai Plant: |
Plot No. 5 to 14, Behind Dewan & Shah Industrial Estate, Waliv, Vasai (East)- 401 208, Maharashtra, India |
|
|
|
|
Daman Plant |
Survey No. 97/2, Daman Industrial Estate, Kadaiya, Daman Pataliya Road, Nani Daman 396 210, India |
|
|
|
|
Regional Office 2: |
BF-173, Sector 1,Near Baisakhi, Saltlake City, Kolkata–700064, West Bengal, India |
|
Tel. No.: |
91-33-4004 6564/ 21062001 |
|
Fax No.: |
91-33-4004 6566 |
|
|
|
|
Regional Office 3: |
428/2, Rani Khera Road, Opposite Dhana Builders, Mundka, New Delhi–110041, India |
|
Tel. No.: |
91-11-2834 3152/ 54 / 3259 6427 |
|
Fax No.: |
91-11-2834 2998 |
|
|
|
|
Regional Office 4: |
M2, Prince Centre, 709–710, Pathari Road, Anna Salai, Chennai–600006, Tamilnadu, India |
|
Tel. No.: |
91-44-2829 7056 |
|
Fax No.: |
91-44-2829 7057 |
|
|
|
|
Branch Offices 1: |
No.D-392, 1st Cross, 1st Stage, Peenya Industrial Estate, Bangalore -560058, Karnataka, India |
|
Tel. No.: |
91 – 80 – 28378359 / 28378360 / 32003017 |
|
Fax No.: |
91- 80 – 28397002 |
|
|
|
|
Branch Offices 2: |
347, Industrial Area, Phase 1, Chandigarh |
|
Tel. No.: |
91 – 172 5079370 / 3950016 / 3250016 |
|
Fax No.: |
91 – 172 5079370 |
|
|
|
|
Branch Offices 3: |
M2, Prince Centre, 709 – 710, Pathari Road, Anna
Salai |
|
Tel. No.: |
91 – 44 – 2829 7056 |
|
Fax No.: |
91 – 44 – 2829 7057 |
|
|
|
|
Branch Offices 4: |
Flat No: 115, Second floor, Bhanu Enclave, Sunder Nagar, Erragadda, Hyderabad–500038. Andhra Pradesh, India. |
|
Tel. No.: |
+91 – 40 – 23711628 |
|
|
|
|
Branch Offices 5: |
BF – 173, Sector – 1, Near Baishakhi, Saltlake City, Kolkata -700064, West Bengal, India |
|
Tel. No.: |
91-33 – 40046564 / 21062001 |
|
|
|
|
Branch Offices 6: |
428/2, Rani Khera Road, Opp. Dhanna Builders, Mundka, New Delhi -110041, India |
|
Tel. No.: |
91 – 11 – 28343152 / 54 / 39596427/ 32596427/ 32405955 |
|
Fax No.: |
91- 11 – 28342998 |
|
|
|
|
Branch Offices 7: |
104, Punit Apartments, 526 Narayan Peth, Pune -411030, Maharashtra, India |
|
Tel. No.: |
91 – 20 -24487471 / 7765 / 7770 / 32506102 / 3206186 |
|
Fax No.: |
91 – 20 -24487577 |
|
|
|
|
Branch Offices 8: |
211, World Trade Centre, Sayajiganj, Vadodara -390005, Gujarat, India |
|
Tel. No.: |
91-265 – 236 1284 / 1826 / 3204517 |
|
Fax No.: |
91- 265 – 236 2983 |
DIRECTORS
As on 31.03.2017
|
Name : |
Mr. Ayush Goel |
|
Designation : |
Director |
|
Address : |
Reshm Aavaas, 105, Akashneem marg, DLF City, Phase 2, Gurugram -122001, Haryana, India |
|
Date of Appointment : |
23.05.2016 |
|
DIN No.: |
02889080 |
|
|
|
|
Name : |
Manan Goel |
|
Designation : |
Director |
|
Address : |
C-87, Antriksh Apartments, Sector 14, Extention Rohini, New Delhi- 110085, India |
|
Date of Appointment : |
25.05.2017 |
|
DIN No.: |
05337939 |
|
|
|
|
Name : |
Prerit Goel |
|
Designation : |
Director |
|
Address : |
119, Deepali Pitampura, Delhi -110034, India |
|
Date of Appointment : |
25.05.2017 |
|
DIN No.: |
05337952 |
|
|
|
|
Name : |
Narotamkumar Girdharilal Pur |
|
Designation : |
Director |
|
Address : |
B 503, Shagun Tower, Gen A K Vidya Marg, Dindoshi Depot, Goregaon (East), Mumbai -400063, Maharashtra, India |
|
Date of Appointment : |
14.08.2014 |
|
DIN No.: |
06948464 |
|
|
|
|
Name : |
Mr. Jagat Singh |
|
Designation : |
Director |
|
Address : |
104B, Sunder Apartment, New Delhi -110087, India |
|
Date of Appointment : |
28.05.2015 |
|
DIN No.: |
07178388 |
|
|
|
|
Name : |
Mr. Bhaswar Mukherjee |
|
Designation : |
Director |
|
Address : |
F-1/2, Sector 7, Vashi, Navi Mumbai – 400703, Maharashtra, India |
|
Date of Appointment : |
12.02.2015 |
|
DIN No.: |
01654539 |
|
|
|
|
Name : |
Ms. Pallavi Goel |
|
Designation : |
Director |
|
Address : |
Reshm Aavaas, 105, Akashneem Marg, DLF City, Phase 2, Gurugram – 122001, Haryana, India |
|
Date of Appointment : |
12.02.2015 |
|
DIN No.: |
03579576 |
KEY EXECUTIVES
|
Name : |
Mr. Shiv Ram Singh |
|
Designation : |
Company Secretary |
|
Address : |
291, Sector - 7, Urban Estate, Gurugram – 122001, Haryana, India |
|
Date of Appointment : |
06.02.2017 |
|
PAN No.: |
BACPS1599H |
|
|
|
|
Name : |
Mr. Hari Prakash Moothedath |
|
Designation : |
Chief Executive Officer |
|
Address : |
Block 5 - 7A, Indus Amber Apartment, 73/30, West Jones Road Saidapet, Chennai 600015 |
|
Date of Appointment : |
23.12.2015 |
|
PAN No.: |
AABPH3086L |
|
|
|
|
Name : |
Mr. Arjun Verma |
|
Designation : |
Chief Finance Officer |
|
Address : |
A 302, Progessive Signature, Plot No 53-54, Sector 6, Ghansoli, Mumbai- 400701, Maharashtra, India |
|
Date of Appointment : |
22.01.2018 |
|
PAN No.: |
ABGPV1431R |
|
|
|
|
Audit Committee: |
|
|
|
|
|
Nomination &
Remuneration Committee: |
|
|
|
|
|
Stakeholders
Relationship Committee: |
|
|
|
|
|
Corporate Social
Responsibility Committee: |
|
|
|
|
|
Risk Management
Committee: |
|
MAJOR SHAREHOLDERS
As on 31.03.2018
|
Category of
shareholder |
Total nos. shares
held |
Shareholding as a %
of total no. of shares (calculated as per SCRR, 1957)As a % |
|
|
(A) Promoter & Promoter Group |
36987892 |
72.55 |
|
|
(B) Public |
13996491 |
27.45 |
|
|
Grand Total |
50984383 |
100.00 |

Statement showing shareholding pattern of the Promoter and
Promoter Group
|
Category of shareholder |
Total nos. shares held |
Shareholding as a % of total no. of shares (calculated as per SCRR,
1957)As a % of |
|
|
A1) Indian |
|
||
|
Individuals/Hindu undivided Family |
35870 |
0.07 |
|
|
Pallavi Goel |
35870 |
0.07 |
|
|
Any Other (specify) |
9652022 |
18.93 |
|
|
GP Global Energy Private Limited |
9652022 |
18.93 |
|
|
Sub Total A1 |
9687892 |
19.00 |
|
|
A2) Foreign |
0.00 |
||
|
Any Other (specify) |
27300000 |
53.55 |
|
|
GULF PETROCHEM PTE LTD |
27300000 |
53.55 |
|
|
Sub Total A2 |
27300000 |
53.55 |
|
|
A=A1+A2 |
36987892 |
72.55 |
|
Category & Name of the Shareholders |
Total no. shares held |
Shareholding % calculated as per SCRR, 1957 As a
% |
|
|
B1) Institutions |
0.00 |
||
|
Mutual Funds/ |
451000 |
0.88 |
|
|
Financial
Institutions/ Banks |
23378 |
0.05 |
|
|
Sub Total B1 |
474378 |
0.93 |
|
|
B2) Central
Government/ State Government(s)/ President of India |
0.00 |
||
|
B3)
Non-Institutions |
0.00 |
||
|
Individual share
capital upto INR 0.200 million |
9666445 |
18.96 |
|
|
Individual share
capital in excess of INR 0.200 million |
1438845 |
2.82 |
|
|
NBFCs registered
with RBI |
49500 |
0.10 |
|
|
Any Other
(specify) |
2367323 |
4.64 |
|
|
Bodies Corporate |
963882 |
1.89 |
|
|
Clearing Members |
81324 |
0.16 |
|
|
HUF |
599284 |
1.18 |
|
|
IEPF |
93217 |
0.18 |
|
|
Non-Resident Indian (NRI) |
629616 |
1.23 |
|
|
Sub Total B3 |
13522113 |
26.52 |
|
|
B=B1+B2+B3 |
13996491 |
27.45 |
BUSINESS DETAILS
|
Line of Business : |
Production of Lubricant Oils, Greases, Rubber Process Oils and Other Products from Crude Oil (Registered Activity) |
||||
|
|
|
||||
|
Products / Services
: |
|
||||
|
|
|
||||
|
Brand Names : |
Not Available |
||||
|
|
|
||||
|
Agencies Held : |
Not Available |
||||
|
|
|
||||
|
Exports : |
Not Divulged |
||||
|
|
|
||||
|
Imports : |
Not Divulged |
||||
|
|
|
||||
|
Terms : |
Not Divulged |
PRODUCTION STATUS – (NOT AVAILABLE)
GENERAL INFORMATION
|
Suppliers : |
|
|||||||||||||||||||||||||||||||||
|
|
|
|||||||||||||||||||||||||||||||||
|
Customers : |
|
|||||||||||||||||||||||||||||||||
|
|
|
|||||||||||||||||||||||||||||||||
|
No. of Employees : |
257 (Approximately) |
|||||||||||||||||||||||||||||||||
|
|
|
|||||||||||||||||||||||||||||||||
|
Bankers : |
|
|||||||||||||||||||||||||||||||||
|
|
|
|||||||||||||||||||||||||||||||||
|
Facilities : |
|
|||||||||||||||||||||||||||||||||
|
Statutory
Auditors: |
|
|
Name : |
PNG and Company Chartered Accountants |
|
Address : |
1207, New Delhi House, 27, Barakhamba Road, New Delhi -110001, India |
|
Tel. No.: |
91-11-41526886, 43829979 |
|
E-Mail : |
|
|
|
|
|
Memberships : |
Not Available |
|
|
|
|
Collaborators : |
Not Available |
|
|
|
|
Holding Company: |
|
|
|
|
|
Ultimate Holding: |
|
|
|
|
|
Director of
reporting Company exercising more than 20% control |
|
|
|
|
|
Fellow Subsidiary |
|
CAPITAL STRUCTURE
As on 31.03.2017
Authorised Capital :
|
No. of Shares |
Type |
Value |
Amount |
|
|
|
|
|
|
52000000 |
Equity Shares |
INR 5/- each |
INR 260.000 Million |
|
|
|
|
|
Issued, Subscribed & Paid-up Capital :
|
No. of Shares |
Type |
Value |
Amount |
|
|
|
|
|
|
50984383 |
Equity Shares |
INR 5/- each |
INR 254.922 Million |
|
|
|
|
|
Reconciliation of
number of shares
|
Particulars |
31st March, 2017 No. of Shares |
|
Shares outstanding at the beginning of the year |
50984383 |
|
Shares issued during the year |
-- |
|
Shares outstanding at the end of the year |
50984383 |
Rights, Preferences
and restrictions attached to Equity Shares:
The company has only one class of equity shares having a Par Value of INR 5 per share. Each shareholder is eligible for one vote per share
The details of
Shareholders holding more than 5% shares:
|
Name Of The
Shareholders |
No. of Shares |
|
GP Global Energy Private Limited |
9529260 |
|
% Age Held |
18.691% |
|
Gulf Petrochem Energy Private Limited |
27300000 |
|
% Age Held |
53.546% |
FINANCIAL DATA
[all figures are
INR Million]
ABRIDGED
BALANCE SHEET
|
SOURCES OF FUNDS |
31.03.2017 |
31.03.2016 |
31.03.2015 |
|
|
|
|
|
|
I.
EQUITY AND LIABILITIES |
|
|
|
|
(1)Shareholders' Funds |
|
|
|
|
(a) Share Capital |
254.922 |
254.922 |
254.922 |
|
(b) Reserves &
Surplus |
1276.920 |
1144.401 |
1041.077 |
|
(c) Less: Revaluation
Reserve |
(4.252) |
(28.003) |
0.000 |
|
(d) Money received
against share warrants |
0.000 |
0.000 |
0.000 |
|
|
|
|
|
|
(2) Share Application
money pending allotment |
0.000 |
0.000 |
0.000 |
|
Total Shareholders’ Funds
(1) + (2) |
1527.590 |
1371.320 |
1295.999 |
|
|
|
|
|
|
(3) Non-Current
Liabilities |
|
|
|
|
(a) long-term borrowings |
0.000 |
107.595 |
108.962 |
|
(b) Deferred tax
liabilities (Net) |
47.609 |
21.977 |
11.870 |
|
(c) Other long term
liabilities |
6.135 |
6.135 |
4.735 |
|
(d) long-term provisions |
6.178 |
4.386 |
4.355 |
|
Total Non-current
Liabilities (3) |
59.922 |
140.093 |
129.922 |
|
|
|
|
|
|
(4) Current Liabilities |
|
|
|
|
(a) Short term borrowings |
802.880 |
1066.201 |
288.093 |
|
(b) Trade payables |
165.927 |
205.641 |
489.940 |
|
(c) Other current
liabilities |
74.324 |
107.730 |
99.171 |
|
(d) Short-term provisions |
78.767 |
14.068 |
7.293 |
|
Total Current Liabilities
(4) |
1121.898 |
1393.640 |
884.497 |
|
|
|
|
|
|
TOTAL |
2709.410 |
2905.053 |
2310.418 |
|
|
|
|
|
|
II.
ASSETS |
|
|
|
|
(1) Non-current assets |
|
|
|
|
(a) Fixed Assets |
|
|
|
|
(i) Tangible assets |
477.169 |
486.671 |
406.812 |
|
(ii) Intangible Assets |
5.256 |
4.037 |
5.429 |
|
(iii) Capital
work-in-progress |
0.000 |
0.000 |
0.000 |
|
(iv) Intangible assets
under development |
0.000 |
0.000 |
0.000 |
|
(b) Non-current
Investments |
0.000 |
0.000 |
0.000 |
|
(c) Deferred tax assets
(net) |
0.000 |
0.000 |
0.000 |
|
(d) Long-term Loan and Advances |
0.000 |
0.000 |
0.000 |
|
(e) Other Non-current
assets |
47.112 |
71.332 |
89.583 |
|
(f) Less: Revaluation
Reserve |
-4.252 |
-28.003 |
|
|
Total Non-Current Assets |
525.285 |
534.037 |
501.824 |
|
|
|
|
|
|
(2) Current assets |
|
|
|
|
(a) Current investments |
0.171 |
0.166 |
42.850 |
|
(b) Inventories |
709.065 |
576.763 |
569.377 |
|
(c) Trade receivables |
970.747 |
1308.652 |
857.718 |
|
(d) Cash and cash
equivalents |
215.366 |
265.958 |
216.275 |
|
(e) Short-term loans and
advances |
288.776 |
219.477 |
122.374 |
|
(f) Other current assets |
0.000 |
0.000 |
0.000 |
|
Total Current Assets |
2184.125 |
2371.016 |
1808.594 |
|
|
|
|
|
|
TOTAL |
2709.410 |
2905.053 |
2310.418 |
PROFIT
& LOSS ACCOUNT
|
|
PARTICULARS |
31.03.2017 |
31.03.2016 |
31.03.2015 |
|
|
SALES |
|
|
|
|
|
Income |
4799.427 |
4224.991 |
4072.814 |
|
|
Other Income |
121.855 |
14.318 |
27.461 |
|
|
TOTAL |
4921.282 |
4239.309 |
4100.275 |
|
|
|
|
|
|
|
Less |
EXPENSES |
|
|
|
|
|
Cost of Materials
Consumed |
2687.901 |
2448.193 |
3256.496 |
|
|
Purchases of Stock-in-Trade |
946.983 |
814.859 |
0.000 |
|
|
Changes in inventories of
finished goods, work-in-progress and Stock-in-Trade |
(24.372) |
31.123 |
56.214 |
|
|
Employees benefits
expense |
234.600 |
199.962 |
175.907 |
|
|
Other expenses |
656.049 |
448.363 |
439.276 |
|
|
TOTAL |
4501.161 |
3942.500 |
3927.893 |
|
|
|
|
|
|
|
|
PROFIT/ (LOSS) BEFORE INTEREST, TAX, DEPRECIATION AND
AMORTISATION |
420.121 |
296.809 |
172.382 |
|
|
|
|
|
|
|
Less |
FINANCIAL EXPENSES |
80.630 |
49.716 |
96.301 |
|
|
|
|
|
|
|
|
PROFIT / (LOSS) BEFORE
TAX, DEPRECIATION AND AMORTISATION |
339.491 |
247.093 |
76.081 |
|
|
|
|
|
|
|
Less/ Add |
DEPRECIATION/
AMORTISATION |
27.968 |
31.566 |
30.735 |
|
|
|
|
|
|
|
|
PROFIT/ (LOSS) BEFORE TAX |
311.523 |
215.527 |
45.346 |
|
|
|
|
|
|
|
Less |
TAX |
109.230 |
79.585 |
(4.915) |
|
|
|
|
|
|
|
|
PROFIT/ (LOSS) AFTER TAX
|
202.293 |
135.942 |
50.261 |
|
|
|
|
|
|
|
Add |
PREVIOUS YEARS’ BALANCE
BROUGHT FORWARD |
640.684 |
536.962 |
492.300 |
|
|
|
|
|
|
|
Less |
APPROPRIATIONS |
|
|
|
|
|
Transfer to General
Reserve |
0.000 |
0.500 |
0.500 |
|
|
Proposed Dividend |
38.238 |
5.098 |
5.099 |
|
|
Tax on Dividend |
7.784 |
6.228 |
0.000 |
|
|
Interim Dividend |
0.000 |
20.394 |
0.000 |
|
|
Total (M) |
46.022 |
32.220 |
5.599 |
|
|
|
|
|
|
|
|
Balance Carried to the
B/S |
796.955 |
640.684 |
536.962 |
|
|
|
|
|
|
|
|
EARNINGS IN FOREIGN CURRENCY |
|
|
|
|
|
F.O.B. Value of Exports |
92.600 |
89.441 |
154.139 |
|
|
TOTAL EARNINGS |
92.600 |
89.441 |
154.139 |
|
|
|
|
|
|
|
|
Earnings / (Loss) Per
Share (INR) |
3.97 |
2.67 |
0.99 |
CURRENT MATURITIES
OF LONG TERM DEBT DETAILS
|
Particulars |
31.03.2017 |
31.03.2016 |
31.03.2015 |
|
Current Maturities of Long term debt |
NA |
NA |
NA |
|
Cash generated from operations |
133.704 |
212.708 |
(184.587) |
|
Net cash flows from (used in) operations |
NA |
NA |
NA |
|
Net cash flows from (used in) operating activity |
75.890 |
171.797 |
(177.048) |
QUARTERLY
RESULTS
|
Particulars |
30.06.2017 (Unaudited) |
30.09.2017 (Unaudited) |
31.12.2017 (Unaudited) |
|
|
1st Quarter |
2nd
Quarter |
3rd
Quarter |
|
Net Sales |
1126.500 |
1252.540 |
1979.760 |
|
Total Expenditure |
1050.310 |
1186.910 |
1895.760 |
|
PBIDT (Excl OI) |
76.190 |
65.630 |
84.000 |
|
Other Income |
0.760 |
3.870 |
28.100 |
|
Operating Profit |
76.960 |
69.500 |
112.100 |
|
Interest |
16.130 |
14.500 |
17.050 |
|
Exceptional Items |
NA |
NA |
NA |
|
PBDT |
60.800 |
54.990 |
95.050 |
|
Depreciation |
7.020 |
6.990 |
6.990 |
|
Profit Before Tax |
53.780 |
48.000 |
88.060 |
|
Tax |
18.800 |
16.710 |
30.220 |
|
Provisions and
contingencies |
NA |
NA |
NA |
|
Profit After Tax |
34.980 |
31.290 |
57.840 |
|
Extraordinary Items |
NA |
NA |
NA |
|
Prior Period Expenses |
NA |
NA |
NA |
|
Other Adjustments |
NA |
NA |
NA |
|
Net Profit |
34.980 |
31.290 |
57.840 |
KEY
RATIOS
EFFICIENCY RATIOS
|
PARTICULARS |
31.03.2017 |
31.03.2016 |
31.03.2015 |
|
Average Collection Days (Sundry Debtors / Income * 365 Days) |
73.83 |
113.06 |
76.87 |
|
|
|
|
|
|
Account Receivables Turnover (Income / Sundry
Debtors) |
4.94 |
3.23 |
4.75 |
|
|
|
|
|
|
Average Payment Days (Sundry Creditors
/ Purchases * 365 Days) |
16.66 |
23.00 |
54.91 |
|
|
|
|
|
|
Inventory Turnover (Operating Income
/ Inventories) |
0.59 |
0.51 |
0.30 |
|
|
|
|
|
|
Asset Turnover (Operating Income
/ Net Fixed Assets) |
0.87 |
0.60 |
0.42 |
LEVERAGE RATIOS
|
PARTICULARS |
31.03.2017 |
31.03.2016 |
31.03.2015 |
|
Debt Ratio ((Borrowing + Current Liabilities) / Total
Assets) |
0.41 |
0.52 |
0.43 |
|
|
|
|
|
|
Debt Equity Ratio (Total Liability
/ Networth) |
0.53 |
0.86 |
0.31 |
|
|
|
|
|
|
Current Liabilities to Networth (Current
Liabilities / Net Worth) |
0.73 |
1.02 |
0.68 |
|
|
|
|
|
|
Fixed Assets to Networth (Net Fixed Assets
/ Networth) |
0.32 |
0.36 |
0.32 |
|
|
|
|
|
|
Interest Coverage Ratio (PBIT / Financial
Charges) |
5.21 |
5.97 |
1.79 |
PROFITABILITY RATIOS
|
PARTICULARS |
|
31.03.2017 |
31.03.2016 |
31.03.2015 |
|
Net Profit Margin ((PAT / Sales) *
100) |
% |
4.21 |
3.22 |
1.23 |
|
|
|
|
|
|
|
Return on Total Assets ((PAT / Total
Assets) * 100) |
% |
7.47 |
4.68 |
2.18 |
|
|
|
|
|
|
|
Return on Investment (ROI) ((PAT / Networth)
* 100) |
% |
13.24 |
9.91 |
3.88 |
SOLVENCY RATIOS
|
PARTICULARS |
31.03.2017 |
31.03.2016 |
31.03.2015 |
|
Current Ratio (Current Assets / Current Liabilities) |
1.95 |
1.70 |
2.04 |
|
|
|
|
|
|
Quick Ratio ((Current Assets
– Inventories) / Current Liabilities) |
1.31 |
1.29 |
1.40 |
|
|
|
|
|
|
G-Score Ratio Financial (Networth / Total
Assets) |
0.56 |
0.47 |
0.56 |
|
|
|
|
|
|
G-Score Ratio Debt (Debts / Equity
Capital) |
3.15 |
4.60 |
1.56 |
|
|
|
|
|
|
G-Score Ratio Liquidity (Total Current
Assets / Total Current Liabilities) |
1.95 |
1.70 |
2.04 |
Total Liability = Short-term Debt + Long-term
Debt + Current Maturities of Long-term debts
STOCK
PRICES
|
Face Value |
INR 5/- |
|
Market Value |
INR 68 |
FINANCIAL ANALYSIS
[all figures are
in INR Million]
DEBT EQUITY RATIO
|
Particular |
31.03.2015 |
31.03.2016 |
31.03.2017 |
|
|
INR
In Million |
INR
In Million |
INR
In Million |
|
Share Capital |
254.922 |
254.922 |
254.922 |
|
Reserves & Surplus |
1041.077 |
1144.401 |
1276.920 |
|
Money received against share
warrants |
0.000 |
0.000 |
0.000 |
|
Share Application money pending allotment |
0.000 |
0.000 |
0.000 |
|
Net
worth |
1295.999 |
1399.323 |
1531.842 |
|
|
|
|
|
|
long-term borrowings |
108.962 |
107.595 |
0.000 |
|
Short term borrowings |
288.093 |
1066.201 |
802.880 |
|
Current maturities of
long-term debts |
0.000 |
0.000 |
0.000 |
|
Total
borrowings |
397.055 |
1173.796 |
802.880 |
|
Debt/Equity
ratio |
0.306 |
0.839 |
0.524 |

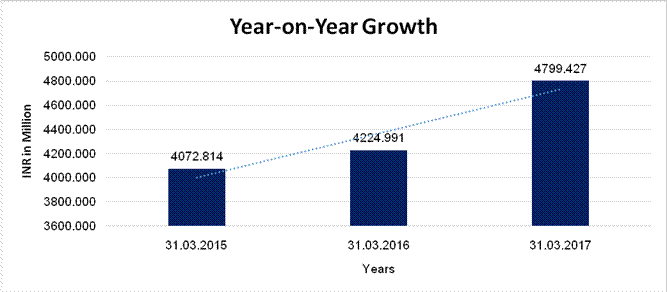
YEAR-ON-YEAR GROWTH
|
Year
on Year Growth |
31.03.2015 |
31.03.2016 |
31.03.2017 |
|
|
INR
In Million |
INR
In Million |
INR
In Million |
|
Sales |
4072.814 |
4224.991 |
4799.427 |
|
|
|
3.736 |
13.596 |
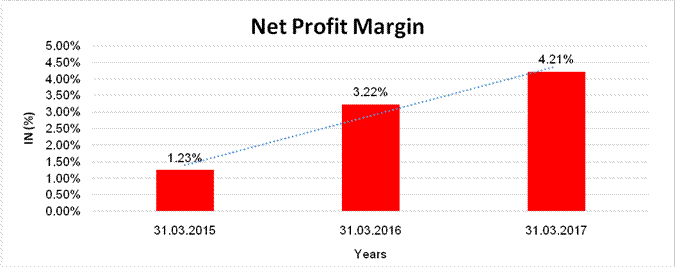
NET PROFIT MARGIN
|
Net
Profit Margin |
31.03.2015 |
31.03.2016 |
31.03.2017 |
|
|
INR
In Million |
INR
In Million |
INR
In Million |
|
Sales |
4072.814 |
4224.991 |
4799.427 |
|
Profit |
50.261 |
135.942 |
202.293 |
|
|
1.23% |
3.22% |
4.21% |
LOCAL AGENCY FURTHER INFORMATION
|
Sr. No. |
Check List by Info Agents |
Available in
Report (Yes / No) |
|
1] |
Year of establishment |
Yes |
|
2] |
Constitution of the entity Incorporation
details |
Yes |
|
3] |
Locality of the entity |
Yes |
|
4] |
Premises details |
No |
|
5] |
Buyer visit details |
-- |
|
6] |
Contact numbers |
Yes |
|
7] |
Name of the person contacted |
No |
|
8] |
Designation of contact person |
No |
|
9] |
Promoter’s background |
Yes |
|
10] |
Date of Birth of Proprietor / Partners /
Directors |
No |
|
11] |
Pan Card No. of Proprietor / Partners |
No |
|
12] |
Voter Id Card No. of Proprietor / Partners |
No |
|
13] |
Type of business |
Yes |
|
14] |
Line of Business |
Yes |
|
15] |
Export/import details (if applicable) |
No |
|
16] |
No. of employees |
Yes |
|
17] |
Details of sister concerns |
No |
|
18] |
Major suppliers |
No |
|
19] |
Major customers |
No |
|
20] |
Banking Details |
Yes |
|
21] |
Banking facility details |
Yes |
|
22] |
Conduct of the banking account |
-- |
|
23] |
Financials, if provided |
Yes |
|
24] |
Capital in the business |
Yes |
|
25] |
Last accounts filed at ROC, if applicable |
Yes |
|
26] |
Turnover of firm for last three years |
Yes |
|
27] |
Reasons for variation <> 20% |
-- |
|
28] |
Estimation for coming financial year |
|
|
29] |
Profitability for last three years |
Yes |
|
30] |
Major shareholders, if available |
Yes |
|
31] |
External Agency Rating, if available |
No |
|
32] |
Litigations that the firm/promoter
involved in |
-- |
|
33] |
Market information |
-- |
|
34] |
Payments terms |
No |
|
35] |
Negative Reporting by Auditors in the
Annual Report |
No |
COMPANY’S PERFORMANCE
Year 2016-17 was remarkable year to the Company. The brand IPOL recorded significant growth mainly through supporting channel network in B2C in Auto Lubricants and by stepping up the value benefit in the B2B for the manufacturing segment. The Company has also signed an exclusive license agreement with Repsol S A Spain to manufacture and market REPSOL brand of lubricants in Vasai plant, located near Mumbai. Being a new entrant in India, REPSOL has already made a mark in its very first year of operations.
MANAGEMENT DISCUSSION
AND ANALYSIS
Industry Structure
& Development
GP Petroleums Ltd. (GPPL) is a listed company in India and is part of Gulf Petrochem group, headquartered in UAE which is a major player in the petrochemical industry. It is an ISO 9001, ISO 14001 & OHSAS 18001 certified company, which specializes in formulating , manufacturing and marketing, of Industrial & Automotive lubricants, Process oils, Greases and other Specialties under the brand name IPOL for more than four decades.
It has invested in high precision quality-control and product development labs to meet global standards and OEM expectations. Company presently has stock points at various states covering all India market through well established distribution network. Automotive lubricant sold through a network of distributors and a wide spread of dealer network across the country. Industrial lubricants and rubber process oils are sold directly to key customers. The small and medium manufacturing establishments are serviced through a country wide network distributors. The customer offer from the company falls under three broad areas, a) Direct product offers, b) Product offer supported by technical services and c) A holistic package of fluid management solutions.
B)
Manufacturing/Marketing tie-up with REPSOL:
GPPL has signed an exclusive license agreement with Repsol S A Spain to manufacture and market REPSOL brand of lubricants in India to cater to the premium lubricant segment. This partnership will strengthen the in house R&D facilities and develop technologically advanced products in India in all segments. This also aligns well with Government's initiative of Make In India campaign. Repsol is very well known brand across the world for its successful performance in MotoGP world championship racing. The product range covers a wide variety of automotive lubricants for Two Wheelers, Cars and Diesel Engine Oils in the premium segment. Repsol has already started to make a significant presence in the Indian retail sector.
Overview:
The financial statements have been prepared in compliance with the requirements of the Companies Act, 1956/2013 and made on a prudent and reasonable basis in order that the financial statements reflects a true and fair manner the form and substance of transactions and reasonably present our state of affairs and profit for the year. The Company's Net Sales/Income from operations for the year ended 31st March, 2017 amounted to INR 4799.427 million against INR 4224.991 million in the previous year. The profit for the year stood at INR 202.293 million against the profit INR 135.942 million in the previous year, registering a growth of 48.81 %. Considering the performance of the company, the Board of Directors recommended final dividend of INR 0.75 per share @ 15% on the Equity Shares of INR 5/- each for the year ended 31st March, 2017.
INDUSTRY OUTLOOK:
The public sector undertakings dominated the lubricants market with more than 51% share which was used to be 89% till the year 1993, gradually private players are increasing their market share by investing heavily in the market to lure the customers. This is mainly because the Government has liberalized and decentralized the norms of import of key raw material, determination of pricing regulations and reduction in the custom duties on import of base oil. Due to liberalization policy, the fair competition took place between the private players and public sector undertakings. Presently, more than 20 well-known companies are operating in the Indian lubricants market. Due to foreign collaborations, Indian toll blending have raised its standards to supply better quality products. Post 1980 Indian market has grown up by importing more sophisticated base oils and better additives with a highly responsive formulations. The entry of multinationals has led to complex and premium brands being introduced into the Indian market. The Indian lubricants market is the third largest in the world after US & China and one of the fastest growing lubricants market globally
INDEX
OF CHARGES
|
SNo |
SRN |
Charge Id |
Charge Holder Name |
Date of Creation |
Date of
Modification |
Date of
Satisfaction |
Amount |
Address |
|
1 |
G77962470 |
100157005 |
Canara Bank |
13/10/2017 |
- |
- |
3000000.0 |
OVERSEAS BRANCH,M-11, CONNAUGHT CIRUCS,NEW DELHI-110001 INDIA |
|
2 |
C82275447 |
10627414 |
HDFC BANK LIMITED |
07/01/2016 |
- |
- |
400000000.0 |
HDFC BANK HOUSESENAPATI BAPAT MARGLOWER PAREL W MUMBAI-400013 MAHARASHTRA INDIA |
|
3 |
G37656774 |
90184077 |
Dena Bank |
30/07/1997 |
07/01/2017 |
- |
2200000000.0 |
SACHIVALAYA CORNER BRANCH, "THE BEACON"MADAM CAMA ROAD, SACHIVALAYA CORNER MUMBAI-400021 MAHARASHTRA INDIA |
|
4 |
G07321649 |
90188514 |
Dena Bank |
03/01/1994 |
27/06/2016 |
- |
2200000000.0 |
SACHIVALAYA CORNER BRANCH, "THE BEACON"MADAM CAMA ROAD, SACHIVALAYA CORNER MUMBAI-400021 MAHARASHTRA INDIA |
|
5 |
G32856619 |
10578816 |
YES BANK LIMITED |
16/03/2015 |
- |
02/08/2016 |
112500000.0 |
48, NYAYA MARG, CHANAKYAPURI, NEW DELHI-110021NEW DELHI-110021 INDIA |
|
6 |
B74099417 |
80066396 |
Dena Bank |
30/09/1985 |
- |
03/04/2013 |
1800000.0 |
SANTACRUZ EAST BRANCH MUMBAI 400055 MAHARASHTRA INDIA |
|
7 |
B73767527 |
80066394 |
UTI BANK LIMITED |
13/10/2005 |
- |
03/04/2013 |
30000000.0 |
NARIMAN POINT BRANCHATLANTA, NARIMAN POINT MUMBAI-400021 MAHARASHTRA INDIA |
|
8 |
B74098914 |
80066395 |
Dena Bank |
24/11/2005 |
- |
03/04/2013 |
70000000.0 |
SACHIVALAYA CORNER BRANCHTHE BEACON, SACHIVALAYA CORNER MUMBAI-400021 MAHARASHTRA INDIA |
|
9 |
B69221620 |
90188748 |
THE NORTH KANARA SSB CO-OP.BANK LTD |
03/10/1998 |
- |
22/02/2013 |
341000.0 |
GIRGAUM MUMBAI 400004N MAHARASHTRA INDIA |
|
10 |
B69220044 |
90188732 |
THE NORTH KANARA SSB CO-OP.BANK LTD |
22/06/1998 |
- |
22/02/2013 |
609000.0 |
GIRGAUM MUMBAI 400004N MAHARASHTRA INDIA |
UNAUDITED
FINANCIAL RESULT FOR THE QUARTER ENDED 31.12.2017
|
PARTICULARS |
3 Months |
9 Months |
|
|
|
31.12.2017 |
30.09.2017 |
31.12.2017 |
|
|
[Unaudited] |
[Unaudited] |
[Unaudited] |
|
1. Income from Operations |
|
|
|
|
Revenue from operations |
1979.761 |
1252.541 |
4358.797 |
|
Othe Income |
28.105 |
3.870 |
32.732 |
|
Total income from operations (net) |
2007.866 |
1256.411 |
4391.529 |
|
|
|
|
|
|
Expenses |
|
|
|
|
Cost of materials consumed |
941.462 |
741.788 |
2347.775 |
|
Purchases of stock-in trade |
440.229 |
28.394 |
570.790 |
|
Changes in inventories of finished goods. work-in-progress and stock in
trade |
(34.768) |
24.424 |
(46.393) |
|
Employee benefits expense |
63.382 |
67.249 |
189.734 |
|
Depreciation and Amortization Expenses |
6.992 |
6.992 |
21.006 |
|
Other Expenses |
246.493 |
146.920 |
523.514 |
|
Finance Costs |
17.053 |
14.499 |
47.682 |
|
Excise Duty |
238.963 |
178.141 |
547.575 |
|
Total expenses |
1919.806 |
1208.407 |
4201.683 |
|
Profit/ (Loss) from ordinary activities after finance cost but before
exceptional items |
88.060 |
48.004 |
189.846 |
|
Exceptional items |
-- |
-- |
-- |
|
Profit/ (Loss) from ordinary activities before tax |
88.060 |
48.004 |
189.846 |
|
Tax expenses |
30.219 |
16.716 |
65.739 |
|
Net Profit / (Loss) for the period |
57.841 |
31.288 |
124.107 |
|
|
|
|
|
|
Paid up equity share capital (Face Value of INR 5-each) |
254.922 |
254.922 |
254.922 |
|
Earnings per share (before extraordinary items) of INR 5/- each (not
annualized): |
|
|
|
|
(a) Basic |
1.13 |
0.61 |
2.43 |
|
(b) Diluted |
1.13 |
0.61 |
2.43 |
|
|
|
|
|
|
PARTICULARS OF
SHAREHOLDING |
|
|
|
|
A. Public Shareholding |
|
|
|
|
- Number of shares |
14037161 |
14140123 |
14037161 |
|
- Percentage of shareholding |
27.53% |
27.73% |
27.53% |
|
Promoters and Promoter group shareholding |
|
|
|
|
a) Pledged / Encumbered |
NIL |
NIL |
NIL |
|
- Number of shares |
|
|
|
|
- Percentage of shares (as a % of the total shareholding of Promoter
& Promoter group) |
100.00% |
100.00% |
100.00% |
|
b) Non Encumbered |
|
|
|
|
- Number of shares |
|
|
|
|
- Percentage of shares (as a % of the total Share Capital of the
Company) |
72.47% |
72.27% |
72.47% |
NOTES:
1. The above financial results were reviewed by Audit Committee and approved by Board of Directors at their meeting held on January 22, 2018. The above results for the quarter ended December 31, 2017 have been reviewed by Statutory Auditors of the company in terms of Regulation 33 of the SEBI (Listing Obligation and Disclosure Requirements) Regulation, 2015.
2. This Statement has been prepared in accordance with the Companies (Indian
Accounting Standard) Rules 2015 (Ind AS), prescribed under section 133 of
Companies Act 2013 read with relevant rules issued thereunder. Beginning April
01 2017, the company has, for the first time adopted Ind AS with a transition
date of April 01, 2016.
3. The above financial statement does not include Ind AS compliant results for
the previous year ended 31 March 2017 as the same are not mandatory as per SEBI
circular dated July 05, 2016.
4. Figures for the previous quarter have been regrouped/ rearranged, wherever
necessary.
5. Nine Months Ended December 2016 Net Profit includes the Profit on Sale of
Assets of INR 47.200 Million.
6. Segment Revenue includes Net Sales i.e. Gross Sales less GST amount.
CONTINGENT
LIABILITIES:
(INR in million)
|
PARTICULARS |
31.03.2017 |
31.03.2016 |
|
Claims against the Company not acknowledged as debts: |
|
|
|
Sales Tax |
32.635 |
35.604 |
|
Excise, Customs and Service Tax |
103.950 |
116.609 |
|
Guarantees given by Banks |
0.000 |
4.458 |
FIXED ASSETS
- Land
- Building
- Furniture and
Fixture
- Computer
- Plant and Machinery
- Office Equipment’s
- Vehicles
CMT REPORT (Corruption, Money Laundering & Terrorism]
The Public Notice information has been collected from various sources
including but not limited to: The Courts,
1] INFORMATION ON
DESIGNATED PARTY
No records exist designating subject or any of its beneficial owners,
controlling shareholders or senior officers as terrorist or terrorist
organization or whom notice had been received that all financial transactions
involving their assets have been blocked or convicted, found guilty or against
whom a judgement or order had been entered in a proceedings for violating
money-laundering, anti-corruption or bribery or international economic or
anti-terrorism sanction laws or whose assets were seized, blocked, frozen or
ordered forfeited for violation of money laundering or international
anti-terrorism laws.
2] Court Declaration :
No records exist to suggest that subject is
or was the subject of any formal or informal allegations, prosecutions or other
official proceeding for making any prohibited payments or other improper
payments to government officials for engaging in prohibited transactions or
with designated parties.
3] Asset Declaration :
No records exist to suggest that the property or assets of the subject
are derived from criminal conduct or a prohibited transaction.
4] Record on Financial
Crime :
Charges or conviction
registered against subject: None
5] Records on Violation of
Anti-Corruption Laws :
Charges or investigation
registered against subject: None
6] Records on Int’l
Anti-Money Laundering Laws/Standards :
Charges or
investigation registered against subject: None
7] Criminal Records
No
available information exist that suggest that subject or any of its principals
have been formally charged or convicted by a competent governmental authority
for any financial crime or under any formal investigation by a competent
government authority for any violation of anti-corruption laws or international
anti-money laundering laws or standard.
8] Affiliation with
Government :
No record
exists to suggest that any director or indirect owners, controlling
shareholders, director, officer or employee of the company is a government
official or a family member or close business associate of a Government
official.
9] Compensation Package :
Our market
survey revealed that the amount of compensation sought by the subject is fair
and reasonable and comparable to compensation paid to others for similar
services.
10] Press Report :
No press reports / filings exists on
the subject.
CORPORATE GOVERNANCE
MIRA INFORM as part of its Due Diligence do provide comments on
Corporate Governance to identify management and governance. These factors often
have been predictive and in some cases have created vulnerabilities to credit
deterioration.
Our Governance Assessment focuses principally on the interactions
between a company’s management, its Board of Directors, Shareholders and other
financial stakeholders.
CONTRAVENTION
Subject is not known to have contravened any existing local laws,
regulations or policies that prohibit, restrict or otherwise affect the terms
and conditions that could be included in the agreement with the subject.
FOREIGN EXCHANGE RATES
|
Currency |
Unit
|
INR |
|
US Dollar |
1 |
INR 67.52 |
|
|
1 |
INR 91.48 |
|
Euro |
1 |
INR 80.52 |
INFORMATION DETAILS
|
Information
Gathered by : |
SHI |
|
|
|
|
Analysis Done by
: |
NIS |
|
|
|
|
Report Prepared
by : |
RKI |
SCORE FACTORS
|
DEMERIT POINTS |
|
|
|
--BANK CHARGES |
YES/NO |
YES |
|
--LITIGATION |
YES/NO |
NO |
|
--OTHER ADVERSE INFORMATION |
YES/NO |
NO |
|
MERIT POINTS |
|
|
|
--SOLE DISTRIBUTORSHIP |
YES/NO |
NO |
|
--EXPORT ACTIVITIES |
YES/NO |
NO |
|
--AFFILIATION |
YES/NO |
YES |
|
--LISTED |
YES/NO |
YES |
|
--OTHER MERIT FACTORS |
YES/NO |
YES |
RATING EXPLANATIONS
|
Credit Rating |
Explanation |
Rating Comments |
|
A++ |
Minimum Risk |
Business dealings permissible with minimum
risk of default |
|
A+ |
Low Risk |
Business dealings permissible with low
risk of default |
|
A |
Acceptable Risk |
Business dealings permissible with
moderate risk of default |
|
B |
Medium Risk |
Business dealings permissible on a regular
monitoring basis |
|
C |
Medium High Risk |
Business dealings permissible preferably
on secured basis |
|
D |
High Risk |
Business dealing not recommended or on
secured terms only |
|
NB |
New Business |
No recommendation can be done due to
business in infancy stage |
|
NT |
No Trace |
No recommendation can be done as the
business is not traceable |
NB is stated where there is insufficient information to facilitate rating. However, it is not to be considered as unfavourable.
This score serves as a reference to assess
SC’s credit risk and to set the amount of credit to be extended. It is
calculated from a composite of weighted scores obtained from each of the major
sections of this report. The assessed factors are as follows:
·
Financial
condition covering various ratios
·
Company
background and operations size
·
Promoters
/ Management background
·
Payment
record
·
Litigation
against the subject
·
Industry
scenario / competitor analysis
·
Supplier
/ Customer / Banker review (wherever available)
This report is issued at
your request without any risk and responsibility on the part of MIRA INFORM
PRIVATE LIMITED (MIPL) or its officials.