|
|
|


MIRA INFORM REPORT
|
Report No. : |
510597 |
|
Report Date : |
28.05.2018 |
IDENTIFICATION DETAILS
|
Name : |
SALZER ELECTRONICS LIMITED |
|
|
|
|
Registered
Office : |
Samichetti Palayam Jothipuram Post, Coimbatore – 641047, Tamilnadu |
|
Tel. No.: |
91-422-4233600 |
|
|
|
|
Country : |
|
|
|
|
|
Financials (as
on) : |
31.03.2017 |
|
|
|
|
Date of
Incorporation : |
08.01.1985 |
|
|
|
|
Com. Reg. No.: |
18-001535 |
|
|
|
|
Capital
Investment / Paid-up Capital : |
INR 143.482 Million |
|
|
|
|
CIN No.: [Company Identification
No.] |
L03210TZ1985PLC001535 |
|
|
|
|
IEC No.: [Import-Export Code No.] |
0488047561 |
|
|
|
|
GSTN : [Goods & Service Tax
Registration No.] |
Not Divulged |
|
|
|
|
TAN No.: [Tax Deduction & Collection
Account No.] |
AAECS3411L |
|
|
|
|
PAN No.: [Permanent Account No.] |
Not Available |
|
|
|
|
Legal Form : |
A Public Limited Liability Company. The Company’s Shares are Listed on
the Stock Exchanges. |
|
|
|
|
Line of Business
: |
Manufacturer of electrical installation products such as CAM operated rotary switches, switch gear products and allied products. [Registered Activity] |
|
|
|
|
No. of Employees
: |
465 (Approximately) |
|
MIRA’s Rating : |
A+ |
|
Credit Rating |
Explanation |
Rating Comments |
|
A+ |
Low Risk |
Business dealings permissible with low
risk of default |
|
Maximum Credit Limit : |
USD 6300000 |
|
|
|
|
Status : |
Good |
|
|
|
|
Payment Behaviour : |
Regular |
|
|
|
|
Litigation : |
Clear |
|
|
|
|
Comments : |
Subject was incorporated in the year 1985. The company is a manufacturer of electrical installation products such as CAM operated rotary switches. Switch gear products and allied products. As per the quarterly results of December 2017, the company has achieved sales turnover of INR 1106.953 million along with average net profit margin. For the financial year ended 2017, the revenue of the company has been increased by 6.35% as compared to the previous year and has reported net profit margin of 4.45%. Rating takes into consideration the sound financial position marked by strong net worth base along with low debt balance sheet profile and comfortable liquidity parameter. The company has its share price trading at around INR 195.75 on BSE as on May 21, 2018 as against the Face Value (FV) of INR 10. Business is active. Payment seems to be regular. In view of aforesaid, the company can be considered for
business dealings at usual trade terms and condition. |
NOTES:
Any query related to this report can be made
on e-mail: infodept@mirainform.com
while quoting report number, name and date.
ECGC Country Risk Classification List
|
Country Name |
Previous Rating (30.09.2017) |
Current Rating (31.12.2017) |
|
India |
A1 |
A1 |
|
Risk Category |
ECGC
Classification |
|
Insignificant |
A1 |
|
Low Risk |
A2 |
|
Moderately Low Risk |
B1 |
|
Moderate Risk |
B2 |
|
Moderately High Risk |
C1 |
|
High Risk |
C2 |
|
Very High Risk |
D |
EXTERNAL AGENCY RATING
|
Rating Agency Name |
CRISIL |
|
Rating |
Long Term Loans= A- |
|
Rating Explanation |
Adequate degree of safety and low credit risk. |
|
Date |
06.06.2017 |
|
Rating Agency Name |
CRISIL |
|
Rating |
Short Term Loans = A1 |
|
Rating Explanation |
Very strong degree of safety and carry lowest credit risk. |
|
Date |
06.06.2017 |
RBI DEFAULTERS’ LIST STATUS
Subject’s name is not enlisted as a defaulter
in the publicly available RBI Defaulters’ list.
EPF (Employee Provident Fund) DEFAULTERS’ LIST STATUS
Subject’s name is not enlisted as a defaulter in
the publicly available EPF (Employee Provident Fund) Defaulters’ list as of
31-03-2018.
BIFR (Board for Industrial & Financial Reconstruction) LISTING
STATUS
Subject’s name is not listed as a Sick Unit in
the publicly available BIFR (Board for Industrial & Financial
Reconstruction) list as of 28.05.2018
IBBI (Insolvency and Bankruptcy Board of India) LISTING STATUS
Subject’s name is not listed in the publicly
available IBBI (Insolvency and Bankruptcy Board of India) list as of report
date.
INFORMATION DENIED
Management Non-Cooperative (91-422-4233614)
LOCATIONS
|
Registered Office : |
Samichetti Palayam Jothipuram Post, Coimbatore – 641047, Tamilnadu,
India |
|
Tel. No.: |
91-422-4233600/ 2692531 |
|
Fax No.: |
91-422-2692170 |
|
E-Mail : |
|
|
Website : |
|
|
|
|
|
Plant Locations |
|
|
Unit-I: |
Samichettipalayam, Jothipuram(Via), Coimbatore – 641047, Tamilnadu, India |
|
|
|
|
Unit-II : |
Chinnamaddampalayam, Coimbatore – 641019, Tamilnadu, India |
|
|
|
|
Unit-III : |
# 2, Gudalur Village Samichettipalayam, Jothipuram via, Coimbatore – 641047, Tamilnadu, India |
|
|
|
|
Unit-IV : |
No.882/3, Coimbatore Main Road, Bettathapuram, Coimbatore – 641104, Tamilnadu, India |
|
|
|
|
UNA Unit : |
Khasara No:2826, Una Nangal to Behdala Road, V.P.O Behdala, Tehsil and District-UNA, UNA – 174306, Himachal Pradesh, India |
DIRECTORS
AS ON 31.03.2018
|
Name : |
Mr. Rangachary Nambi Iyengar |
|
Designation : |
Director |
|
Address : |
C - 101, B Wing RNS Santhi Nivas, Near RNS Motors Bangalore, Tumkur Road, Bangalore – 560022, Karnataka, India |
|
Date of Appointment : |
01.03.2014 |
|
DIN No.: |
00054437 |
|
|
|
|
Name : |
Mr. Dhamodaraswamy R |
|
Designation : |
Director |
|
Address : |
9/174,Railway Station Road, Perianaickenpalayam, Coimbatore – 641020, Tamiladu, India |
|
Date of Appointment : |
17.12.1986 |
|
DIN No.: |
00003230 |
|
|
|
|
Name : |
Mr. Sankaran Baskarasubramanian |
|
Designation : |
Director |
|
Address : |
12/33 Vallinagar, Edayarpalayam Road, Coimbatore – 641023, Tamilnadu, India |
|
Date of Appointment : |
01.10.1994 |
|
DIN No.: |
00003152 |
|
|
|
|
Name : |
Mr. Rangaswamynaidu Doraiswamy |
|
Designation : |
Managing Director |
|
Address : |
9/175-A, Railway Station Road, Perianaickenpalayam, Coimbatore – 641020, Tamilnadu, India |
|
Date of Appointment : |
08.01.1985 |
|
DIN No.: |
00003131 |
|
|
|
|
Name : |
Mr. Rajeshkumar Doraiswamy |
|
Designation : |
Whole-Time Director |
|
Address : |
9/175-A,Railway Station Road, Perianaickenpalayam, Coimbatore – 641020, Tamilnadu, India |
|
Date of Appointment : |
22.12.2001 |
|
DIN No.: |
00003126 |
|
|
|
|
Name : |
Mr. Perumal Reddiar Ramachandran |
|
Designation : |
Whole-Time Director |
|
Address : |
No 2/438-2 Durai Mohan Illam, Pettathapuram Pirivu (East), Pettathapuram, Coimbatore – 641104, Tamilnadu, India |
|
Date of Appointment : |
26.09.1998 |
|
DIN No.: |
01043572 |
|
|
|
|
Name : |
Mr. Motichand Chandra Nirmal Kumar |
|
Designation : |
Director |
|
Address : |
136a, East Ponnurangan Road, R.S. Puram, CBE, Coimbatore – 641002, Tamilnadu, India |
|
Date of Appointment : |
17.12.1986 |
|
DIN No.: |
00003134 |
|
|
|
|
Name : |
Mr. Prafulchandra Kanthilal Shah |
|
Designation : |
Director |
|
Address : |
No.1 Rajappa Lane, Sjp Cross Road, Bangalore - 560001, Karnataka, India |
|
Date of Appointment : |
02.05.1986 |
|
DIN No.: |
00003106 |
|
|
|
|
Name : |
Mr. Veeraraghavan Sankaran |
|
Designation : |
Director |
|
Address : |
New No.13, Old No.7 Second Street, Zacriah Colony, Kodambakkam, Chennai – 600094, Tamilnadu, India |
|
Date of Appointment : |
28.08.2002 |
|
DIN No.: |
00003141 |
|
|
|
|
Name : |
Mr. Narayanaswamy Jayabal |
|
Designation : |
Director |
|
Address : |
29,G.V.Residency,Sowripalayam, Coimbatore – 6410 =28, Tamilnadu, India |
|
Date of Appointment : |
28.12.1995 |
|
DIN No.: |
00003111 |
|
|
|
|
Name : |
Mr. Rajeshkumar Thilagam |
|
Designation : |
Director |
|
Address : |
Old No. 9 / 174 New No. 9 / 175 Railway Feeder, Road, Perianaickenpalayam, Coimbatore – 641019, Tamilnadu, India |
|
Date of Appointment : |
30.03.2015 |
|
DIN No.: |
00006783 |
|
|
|
|
Name : |
Mr. Venkatapathy L L |
|
Designation : |
Director |
|
Address : |
11,Vincent Colony, R.S. Puram, Coimbatore – 641002, Tamilnadu, India |
|
Date of Appointment : |
17.12.1986 |
|
DIN No.: |
00003095 |
|
|
|
|
Name : |
Mr. Venkatapathy L L |
|
Designation : |
Director |
|
Address : |
11,Vincent Colony, R.S.Puram, Coimbatore – 641002, Tamilnadu, India |
|
Date of Appointment : |
17.12.1986 |
|
DIN No.: |
00003095 |
|
|
|
|
Name : |
Mr. Otto Eggimann |
|
Designation : |
Director |
|
Address : |
Moosmattstrasse 4, Hunenberg 6331 Ch Switzerland |
|
Date of Appointment : |
25.05.2017 |
|
DIN No.: |
07791113 |
KEY EXECUTIVES
|
Name : |
Mr. Sankaran Baskarasubramanian |
|
Designation : |
Company Secretary |
|
Address : |
12/33, Vallinagar, Edayarpalayam Road, Coimbatore – 641023, Tamilnadu, India |
|
Date of Appointment : |
01.10.1994 |
|
PAN No.: |
AALPB3468J |
|
|
|
|
Name : |
Mr. Rajeshkumar Doraiswamy |
|
Designation : |
Chief Financial Officer |
|
Address : |
9/175-A, Railway Station Road, Perianaickenpalayam, Coimbatore – 641020, Tamilnadu, India |
|
Date of Appointment : |
09.08.2014 |
|
PAN No.: |
ADSPR6198K |
SHAREHOLDING PATTERN
AS ON March 2018
|
Category of
Shareholder |
No.
of Shares |
Percentage
of Holding |
|
(A) Promoter
& Promoter Group |
4798608 |
32.00 |
|
(B) Public |
10198079 |
68.00 |
|
Grand Total |
14996687 |
100.00 |

Statement showing shareholding pattern of the Promoter
and Promoter Group
|
Category of
Shareholder |
No.
of Shares |
Percentage
of Holding |
|
A1) Indian |
|
0.00 |
|
Individuals/Hindu
undivided Family |
1805228 |
12.04 |
|
D
Vishnurangaswamy |
692787 |
4.62 |
|
Thilagam R |
457255 |
3.05 |
|
R Doraiswamy |
313428 |
2.09 |
|
D Rajesh Kumar |
239266 |
1.60 |
|
R Pappammal |
59922 |
0.40 |
|
R Damodaraswamy |
42570 |
0.28 |
|
Any Other
(Specify) |
2993380 |
19.96 |
|
Saradha
Investments Limited |
667968 |
4.45 |
|
Quebec
Information Services I Limited |
575142 |
3.84 |
|
Srve Industries
Limited |
533855 |
3.56 |
|
Salzer Exports
Limited |
345725 |
2.31 |
|
Kr Health Care
Private Limited |
269683 |
1.80 |
|
Salzer Securities
Holdings Limited |
101007 |
0.67 |
|
Salzer Magnet
Wires Limited |
500000 |
3.33 |
|
Sub Total A1 |
4798608 |
32.00 |
|
A2) Foreign |
|
0.00 |
|
A=A1+A2 |
4798608 |
32.00 |
Statement showing shareholding pattern of the Public
shareholder
|
Category of
Shareholder |
No.
of Shares |
Percentage
of Holding |
|
B1) Institutions |
0 |
0.00 |
|
Mutual Funds/ |
891077 |
5.94 |
|
Sundaram Mutual Fund
A/C Sundaram Select Microcap Series VI |
891077 |
5.94 |
|
Foreign Portfolio
Investors |
277099 |
1.85 |
|
Algot Holding APS |
167000 |
1.11 |
|
Financial
Institutions/ Banks |
514623 |
3.43 |
|
Wallfort
Financial Services Limited |
242000 |
1.61 |
|
Elara India
Opportunities Fund Limited |
239690 |
1.60 |
|
Sub Total B1 |
1682799 |
11.22 |
|
B2) Central
Government/ State Government(s)/ President of India |
0 |
0.00 |
|
B3)
Non-Institutions |
0 |
0.00 |
|
Individual share
capital upto INR 0.200 million |
5379809 |
35.87 |
|
Individual share
capital in excess of INR 0.200 million |
1406464 |
9.38 |
|
Tarun Kantilal
Vakharia |
219128 |
1.46 |
|
Sharmin Nasser |
165000 |
1.10 |
|
Sidharth R Ajwani |
150917 |
1.01 |
|
Any Other
(specify) |
1729007 |
11.53 |
|
Bodies Corporate |
1181454 |
7.88 |
|
Clearing Members |
50021 |
0.33 |
|
Director or
Director's Relatives |
63638 |
0.42 |
|
Foreign Nationals |
3111 |
0.02 |
|
Overseas
Corporate Bodies |
81713 |
0.54 |
|
Non-Resident
Indian (NRI) |
340683 |
2.27 |
|
Trusts |
210 |
0.00 |
|
IEPF |
8177 |
0.05 |
|
Sub Total B3 |
8515280 |
56.78 |
|
B=B1+B2+B3 |
10198079 |
68.00 |
BUSINESS DETAILS
|
Line of Business : |
Manufacturer of electrical installation products such as CAM operated rotary switches, switch gear products and allied products. [Registered Activity] |
||||||
|
|
|
||||||
|
Products / Services
: |
|
||||||
|
|
|
||||||
|
Brand Names : |
Not Divulged |
||||||
|
|
|
||||||
|
Agencies Held : |
Not Divulged |
||||||
|
|
|
||||||
|
Exports : |
Not Divulged |
||||||
|
|
|
||||||
|
Imports : |
Not Divulged |
||||||
|
|
|
||||||
|
Terms : |
Not Divulged |
PRODUCTION STATUS – NOT AVAILABLE
GENERAL INFORMATION
|
Suppliers : |
|
||||||||||||||||||||||||||||||||||||||||||||||||||||||||||||||||||||||||||||||||||||||||||||||||||||||||||||||||||
|
|
|
||||||||||||||||||||||||||||||||||||||||||||||||||||||||||||||||||||||||||||||||||||||||||||||||||||||||||||||||||
|
Customers : |
|
||||||||||||||||||||||||||||||||||||||||||||||||||||||||||||||||||||||||||||||||||||||||||||||||||||||||||||||||||
|
|
|
||||||||||||||||||||||||||||||||||||||||||||||||||||||||||||||||||||||||||||||||||||||||||||||||||||||||||||||||||
|
No. of Employees : |
465 (Approximately) |
||||||||||||||||||||||||||||||||||||||||||||||||||||||||||||||||||||||||||||||||||||||||||||||||||||||||||||||||||
|
|
|
||||||||||||||||||||||||||||||||||||||||||||||||||||||||||||||||||||||||||||||||||||||||||||||||||||||||||||||||||
|
Bankers : |
· Canara Bank, Gudalur Branch, SRKV Post, Coimbatore – 641020, Tamilnadu, India · Canara Bank, Mid Corporate Branch, 16 and 18 East Arokia Swamy Road, R.S. Puram, Coimbatore – 641002, Tamilnadu, India · Citi Bank, Tri Star Towers, Plot No.657, Avinashi Road, Coimbatore – 641018, Tamilnadu, India · Union Bank of India, Coimbatore Main Branch 235, Oppanakara Street, Coimbatore – 641001, Tamilnadu, India |
||||||||||||||||||||||||||||||||||||||||||||||||||||||||||||||||||||||||||||||||||||||||||||||||||||||||||||||||||
|
|
|
||||||||||||||||||||||||||||||||||||||||||||||||||||||||||||||||||||||||||||||||||||||||||||||||||||||||||||||||||
|
Facilities : |
|
|
Auditors : |
|
|
Name : |
Swamy and Ravi Chartered Accountants |
|
Address : |
No.537, N.S.R. Road, Saibaba Colony, Coimbatore – 641011, Tamilnadu, India |
|
|
|
|
Internal Auditor : |
Covai Management Services |
|
Address : |
Coimbatore – 641011, Tamilnadu, India |
|
|
|
|
Cost Auditor : |
CMA Mr. A.R. Ramasubramania Raja Cost Auditor |
|
Address : |
Coimbatore – 641011, Tamilnadu, India |
|
|
|
|
Secretarial Auditor : |
GV Associates Company Secretaries |
|
Address : |
Coimbatore, Tamilnadu, India |
|
|
|
|
Memberships : |
Not Available |
|
|
|
|
Collaborators : |
Not Available |
|
|
|
|
Enterprise owned or
significantly influenced by key management personnel or their relatives : |
· Salzer Exports Limited · Salzer Magnet Wires Limited · Salzer Spinners Limited · SRVE Industries Limited · Roots Multiclean Limited · K R Health Care Private Limited · SRVE Industries · Micro Instruments Limited |
CAPITAL STRUCTURE
AFTER 31.03.2017
Authorised Capital : INR
200.000 Million
Issued, Subscribed & Paid-up Capital : INR 155.267 Million
AS ON 31.03.2017
Authorised Capital :
|
No. of Shares |
Type |
Value |
Amount |
|
|
|
|
|
|
20000000 |
Equity Shares |
INR 10/- each |
INR 200.000 Million |
|
|
|
|
|
Issued, Subscribed & Paid-up Capital :
|
No. of Shares |
Type |
Value |
Amount |
|
|
|
|
|
|
14348187 |
Equity Shares |
INR 10/- each |
INR 143.482 Million |
|
|
|
|
|
Reconciliation of shares outstanding at the
beginning and at the end of the period
|
Equity Shares |
Shares in lakhs |
INR
in Million |
|
At the Beginning of the Period |
136.43 |
136.432 |
|
ADD.: Shares issued during the Year |
|
|
|
Issue under conversion of warrants |
5.80 |
5.800 |
|
Issue under Exercise of Stock Options |
1.25 |
1.250 |
|
Institutional Placement |
-- |
-- |
|
Less: Shares bought Back during the year |
-- |
-- |
|
Add: Other movements during the year |
-- |
-- |
|
Outstanding at the end of the period |
143.48 |
143.482 |
Terms/rights
attached to the Equity Shares.
· The Company has only one class of Equity Shares having par value of INR 10/- per share. Each holder of Equity Shares is entitled to one vote per share. The company declares and pays Divided in Indian Rupees.
· The Dividend Proposed is as recommended by the Board of Directors and subject to the approval of the Shareholders’ in the ensuring Annual General Meeting.
· For the year Ended 31st March, 2017, The amount of dividend per share recognized as distributions to Equity is INR 1.60.(31st March, 2016: INR 1.50)
· In the event of liquidation of the company, the holders of equity shares will be entitled to receive remaining assets of the company, after distribution of all preferential amounts.
· The distribution will be in proportion to the number of equity shares held by the shareholders
List of Share Holders
having 5% or more shares in the Company
|
Name of
Shareholder |
Number
of Shares |
% holding |
|
Sundaram Mutual Fund A/C |
917805 |
6.40% |
FINANCIAL DATA
[all figures are
INR Million]
ABRIDGED
BALANCE SHEET
|
SOURCES OF FUNDS |
31.03.2017 |
31.03.2016 |
31.03.2015 |
|
I.
EQUITY
AND LIABILITIES |
|
|
|
|
(1)Shareholders' Funds |
|
|
|
|
(a) Share Capital |
143.482 |
136.432 |
102.837 |
|
(b) Reserves & Surplus |
2076.541 |
1776.169 |
967.864 |
|
(c) Share application money on conversion of warrants and pending allotment |
0.000 |
41.175 |
0.000 |
|
|
|
|
|
|
(2) Money received upon exercise of stock options and pending allotment |
0.000 |
1.060 |
8.796 |
|
Total
Shareholders’ Funds (1) + (2) |
2220.023 |
1954.836 |
1079.497 |
|
|
|
|
|
|
(3)
Non-Current Liabilities |
|
|
|
|
(a) long-term borrowings |
118.249 |
176.794 |
175.745 |
|
(b) Deferred tax liabilities (Net) |
58.639 |
39.180 |
19.361 |
|
(c) Other long term
liabilities |
0.000 |
0.000 |
25.081 |
|
(d) long-term
provisions |
4.910 |
7.339 |
8.271 |
|
Total Non-current
Liabilities (3) |
181.798 |
223.313 |
228.458 |
|
|
|
|
|
|
(4)
Current Liabilities |
|
|
|
|
(a) Short
term borrowings |
1030.478 |
813.313 |
750.044 |
|
(b) Trade
payables |
318.393 |
329.114 |
271.223 |
|
(c) Other
current liabilities |
543.040 |
355.096 |
367.117 |
|
(d) Short-term
provisions |
62.368 |
78.586 |
54.987 |
|
Total Current
Liabilities (4) |
1954.279 |
1576.109 |
1443.371 |
|
|
|
|
|
|
TOTAL |
4356.100 |
3754.258 |
2751.326 |
|
|
|
|
|
|
II.
ASSETS |
|
|
|
|
(1)
Non-current assets |
|
|
|
|
(a) Fixed
Assets |
|
|
|
|
(i)
Tangible assets |
1181.988 |
1009.428 |
770.468 |
|
(ii)
Intangible Assets |
22.649 |
13.032 |
7.718 |
|
(iii)
Capital work-in-progress |
90.679 |
81.123 |
55.525 |
|
(iv)
Intangible assets under development |
0.000 |
0.000 |
0.000 |
|
(b) Non-current Investments |
7.658 |
54.808 |
48.630 |
|
(c) Deferred tax assets (net) |
0.000 |
0.000 |
0.000 |
|
(d) Long-term Loan and Advances |
10.694 |
9.300 |
7.165 |
|
(e) Other
Non-current assets |
216.852 |
192.668 |
2.044 |
|
Total Non-Current
Assets |
1530.520 |
1360.359 |
891.550 |
|
|
|
|
|
|
(2)
Current assets |
|
|
|
|
(a)
Current investments |
36.981 |
120.434 |
8.018 |
|
(b)
Inventories |
908.627 |
667.268 |
660.805 |
|
(c) Trade
receivables |
1210.668 |
997.560 |
778.987 |
|
(d) Cash
and cash equivalents |
123.944 |
125.338 |
90.393 |
|
(e)
Short-term loans and advances |
437.968 |
388.069 |
228.724 |
|
(f) Other
current assets |
107.392 |
95.230 |
92.849 |
|
Total
Current Assets |
2825.580 |
2393.899 |
1859.776 |
|
|
|
|
|
|
TOTAL |
4356.100 |
3754.258 |
2751.326 |
PROFIT
& LOSS ACCOUNT
|
|
PARTICULARS |
31.03.2017 |
31.03.2016 |
31.03.2015 |
||
|
|
SALES |
|
|
|
||
|
|
|
Income |
3840.620 |
3611.349 |
2833.023 |
|
|
|
|
Other Income |
67.543 |
28.037 |
10.025 |
|
|
|
|
TOTAL |
3908.163 |
3639.386 |
2843.048 |
|
|
|
|
|
|
|
||
|
Less |
EXPENSES |
|
|
|
||
|
|
|
Cost of Materials Consumed |
3008.661 |
2517.935 |
1986.996 |
|
|
|
|
Changes in Inventories of finished goods, work-in-progress and
stock-in-trade |
(207.723) |
48.006 |
(27.871) |
|
|
|
|
Employee Benefits Expenses |
188.662 |
176.843 |
155.379 |
|
|
|
|
Other Expenses |
421.817 |
439.642 |
363.960 |
|
|
|
|
TOTAL |
3411.417 |
3182.426 |
2478.464 |
|
|
|
|
|
|
|
||
|
|
PROFIT/(LOSS)
BEFORE INTEREST, TAX, DEPRECIATION AND AMORTISATION |
496.746 |
456.960 |
364.584 |
||
|
|
|
|
|
|
||
|
Less |
FINANCIAL
EXPENSES |
145.929 |
131.359 |
123.426 |
||
|
|
|
|
|
|
||
|
|
PROFIT/(LOSS)
BEFORE TAX, DEPRECIATION AND AMORTISATION |
350.817 |
325.601 |
241.158 |
||
|
|
|
|
|
|
||
|
Less |
DEPRECIATION/
AMORTISATION |
98.048 |
83.189 |
71.447 |
||
|
|
|
|
|
|
||
|
|
PROFIT/(LOSS)
BEFORE TAX |
252.769 |
242.412 |
169.711 |
||
|
|
|
|
|
|
||
|
Less |
TAX |
81.826 |
71.937 |
49.904 |
||
|
|
|
|
|
|
||
|
|
PROFIT/(LOSS)
AFTER TAX |
170.943 |
170.475 |
119.807 |
||
|
|
|
|
|
|
||
|
|
EARNINGS IN
FOREIGN CURRENCY |
|
|
|
||
|
|
|
F.O.B. Value of Exports |
577.898 |
541.330 |
454.546 |
|
|
|
|
Others |
3.819 |
25.125 |
4.061 |
|
|
|
TOTAL EARNINGS |
581.717 |
566.455 |
458.607 |
||
|
|
|
|
|
|
||
|
|
IMPORTS |
|
|
|
||
|
|
|
Raw Materials |
503.983 |
532.148 |
211.831 |
|
|
|
|
Components and Stores parts |
269.760 |
232.401 |
204.985 |
|
|
|
|
Capital Goods |
16.453 |
60.721 |
16.701 |
|
|
|
TOTAL IMPORTS |
790.196 |
825.270 |
433.517 |
||
|
|
|
|
|
|
||
|
|
Earnings /
(Loss) Per Share (INR) |
|
|
|
||
|
|
|
12.35 |
13.54 |
11.65 |
||
|
|
|
11.89 |
12.87 |
10.79 |
||
CURRENT MATURITIES OF LONG TERM DEBT DETAILS
|
Particulars |
31.03.2017 |
31.03.2016 |
31.03.2015 |
|
Current maturities of long term debt |
106.805 |
103.652 |
42.653 |
|
Cash generated from operations |
50.164 |
(109.368) |
292.448 |
|
Net Cash flow from operating activities |
(1.955) |
(145.241) |
262.339 |
QUARTERLY
RESULTS
|
Particulars |
30.06.2017 (Unaudited) |
30.09.2017 (Unaudited) |
31.12.2017 (Unaudited) |
31.03.2018 (Unaudited) |
|
|
1st
Quarter |
2nd
Quarter |
3rd
Quarter |
4th
Quarter |
|
Net sales |
1151.450 |
1007.410 |
1106.950 |
1267.510 |
|
Total Expenditure |
1046.500 |
878.360 |
972.160 |
1103.450 |
|
PBIDT (Excluding Other Income) |
104.950 |
129.050 |
134.790 |
164.060 |
|
Other income |
20.090 |
13.450 |
6.180 |
(8.700) |
|
Operating Profit |
125.040 |
142.500 |
140.970 |
155.360 |
|
Interest |
39.840 |
34.810 |
35.950 |
38.530 |
|
Exceptional Items |
NA |
NA |
NA |
NA |
|
PBDT |
85.200 |
107.690 |
105.030 |
116.830 |
|
Depreciation |
26.720 |
22.860 |
26.320 |
29.470 |
|
Profit Before Tax |
58.480 |
84.830 |
78.710 |
87.360 |
|
Tax |
17.830 |
26.700 |
25.840 |
38.850 |
|
Provisions and
contingencies |
NA |
NA |
NA |
NA |
|
Profit after tax |
40.650 |
58.130 |
52.870 |
48.510 |
|
Extraordinary Items |
NA |
NA |
NA |
NA |
|
Prior Period Expenses |
NA |
NA |
NA |
NA |
|
Other Adjustments |
NA |
NA |
NA |
NA |
|
Net Profit |
40.650 |
58.130 |
52.870 |
48.510 |
KEY
RATIOS
EFFICIENCY RATIOS
|
PARTICULARS |
31.03.2017 |
31.03.2016 |
31.03.2015 |
|
Average Collection Days (Sundry
Debtors / Income * 365 Days) |
115.06 |
100.82 |
100.36 |
|
|
|
|
|
|
Account Receivables Turnover (Income / Sundry Debtors) |
3.17 |
3.62 |
3.64 |
|
|
|
|
|
|
Average Payment Days (Sundry Creditors / Purchases * 365 Days) |
38.63 |
47.71 |
49.82 |
|
|
|
|
|
|
Inventory Turnover (Operating Income / Inventories) |
0.55 |
0.68 |
0.55 |
|
|
|
|
|
|
Asset Turnover (Operating Income / Net Fixed Assets) |
0.38 |
0.41 |
0.44 |
LEVERAGE RATIOS
|
PARTICULARS |
31.03.2017 |
31.03.2016 |
31.03.2015 |
|
Debt Ratio ((Borrowing
+ Current Liabilities) / Total Assets) |
0.50 |
0.49 |
0.60 |
|
|
|
|
|
|
Debt Equity Ratio (Total Liability / Networth) |
0.57 |
0.56 |
0.90 |
|
|
|
|
|
|
Current Liabilities to Networth (Current Liabilities / Net Worth) |
0.88 |
0.81 |
1.34 |
|
|
|
|
|
|
Fixed Assets to Networth (Net Fixed Assets / Networth) |
0.58 |
0.56 |
0.77 |
|
|
|
|
|
|
Interest Coverage Ratio (PBIT / Financial Charges) |
3.40 |
3.48 |
2.95 |
PROFITABILITY RATIOS
|
PARTICULARS |
|
31.03.2017 |
31.03.2016 |
31.03.2015 |
|
PAT to Sales ((PAT
/ Sales) * 100) |
% |
4.45 |
4.72 |
4.23 |
|
|
|
|
|
|
|
Return on Total Assets ((PAT / Total Assets) * 100) |
% |
3.92 |
4.54 |
4.35 |
|
|
|
|
|
|
|
Return on Investment (ROI) ((PAT / Networth) * 100) |
% |
7.70 |
8.72 |
11.10 |
SOLVENCY RATIOS
|
PARTICULARS |
31.03.2017 |
31.03.2016 |
31.03.2015 |
|
Current Ratio (Current
Assets / Current Liabilities) |
1.45 |
1.52 |
1.29 |
|
|
|
|
|
|
Quick Ratio ((Current Assets – Inventories) / Current
Liabilities) |
0.98 |
1.10 |
0.83 |
|
|
|
|
|
|
G-Score Ratio Financial (Networth / Total Assets) |
0.51 |
0.52 |
0.39 |
|
|
|
|
|
|
G-Score Ratio Debt (Debts / Equity Capital) |
8.75 |
8.02 |
9.42 |
|
|
|
|
|
|
G-Score Ratio Liquidity (Total Current Assets / Total Current Liabilities) |
1.45 |
1.52 |
1.29 |
Total
Liability = Short-term Debt + Long-term Debt + Current Maturities of Long-term
debts
STOCK
PRICES
|
Face Value |
INR 10.00/- |
|
Market Value |
INR 195.75/- |
FINANCIAL ANALYSIS
[all figures are
INR Million]
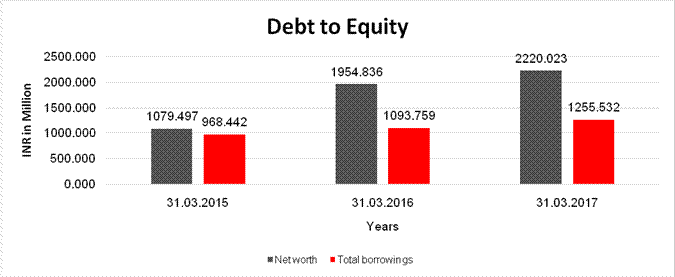
DEBT EQUITY RATIO
|
Particular |
31.03.2015 |
31.03.2016 |
31.03.2017 |
|
|
INR
In Million |
INR
In Million |
INR
In Million |
|
Share Capital |
102.837 |
136.432 |
143.482 |
|
Reserves & Surplus |
967.864 |
1776.169 |
2076.541 |
|
Share application money on
conversion of warrants and pending allotment |
0.000 |
41.175 |
0.000 |
|
Money received upon exercise
of stock options and pending allotment |
8.796 |
1.060 |
0.000 |
|
Net
worth |
1079.497 |
1954.836 |
2220.023 |
|
|
|
|
|
|
long-term borrowings |
175.745 |
176.794 |
118.249 |
|
Short term borrowings |
750.044 |
813.313 |
1030.478 |
|
Current Maturities of Long
term debt |
42.653 |
103.652 |
106.805 |
|
Total
borrowings |
968.442 |
1093.759 |
1255.532 |
|
Debt/Equity
ratio |
0.897 |
0.560 |
0.566 |
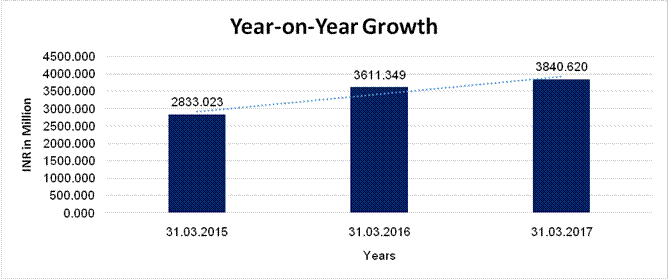
YEAR-ON-YEAR GROWTH
|
Year
on Year Growth |
31.03.2015 |
31.03.2016 |
31.03.2017 |
|
|
INR
In Million |
INR
In Million |
INR
In Million |
|
Sales |
2833.023 |
3611.349 |
3840.620 |
|
|
|
27.473 |
6.349 |
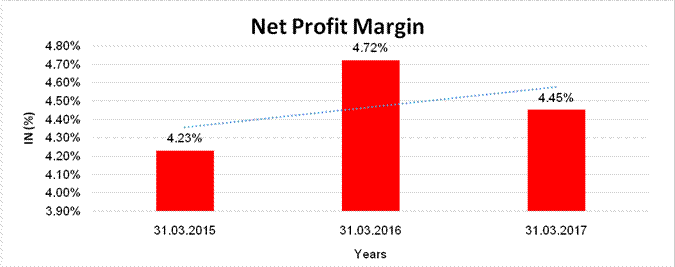
NET PROFIT MARGIN
|
Net
Profit Margin |
31.03.2015 |
31.03.2016 |
31.03.2017 |
|
|
INR
In Million |
INR
In Million |
INR
In Million |
|
Sales
|
2833.023 |
3611.349 |
3840.620 |
|
Profit |
119.807 |
170.475 |
170.943 |
|
|
4.23% |
4.72% |
4.45% |
LOCAL AGENCY FURTHER INFORMATION
|
Sr. No. |
Check list by
info agents |
Available in
Report (Yes/No) |
|
1 |
Year of establishment |
Yes |
|
2 |
Constitution of the entity -Incorporation
details |
Yes |
|
3 |
Locality of the entity |
Yes |
|
4 |
Premises details |
No |
|
5 |
Buyer visit details |
-- |
|
6 |
Contact numbers |
Yes |
|
7 |
Name of the person contacted |
No |
|
8 |
Designation of contact person |
No |
|
9 |
Promoter’s background |
Yes |
|
10 |
Date of Birth of Proprietor / Partners /
Directors |
No |
|
11 |
Pan Card No. of Proprietor / Partners |
No |
|
12 |
Voter Id Card No. of Proprietor / Partners |
No |
|
13 |
Type of business |
Yes |
|
14 |
Line of Business |
Yes |
|
15 |
Export/import details (if applicable) |
No |
|
16 |
No. of employees |
Yes |
|
17 |
Details of sister concerns |
Yes |
|
18 |
Major suppliers |
No |
|
19 |
Major customers |
No |
|
20 |
Banking Details |
Yes |
|
21 |
Banking facility details |
Yes |
|
22 |
Conduct of the banking account |
-- |
|
23 |
Financials, if provided |
Yes |
|
24 |
Capital in the business |
Yes |
|
25 |
Last accounts filed at ROC, if applicable |
Yes |
|
26 |
Turnover of firm for last three years |
Yes |
|
27 |
Reasons for variation <> 20% |
-- |
|
28 |
Estimation for coming financial year |
No |
|
29 |
Profitability for last three years |
Yes |
|
30 |
Major shareholders, if available |
Yes |
|
31 |
External Agency Rating, if available |
Yes |
|
32 |
Litigations that the firm/promoter
involved in |
-- |
|
33 |
Market information |
-- |
|
34 |
Payments terms |
No |
|
35 |
Negative Reporting by Auditors in the
Annual Report |
No |
CORPORATE INFORMATION AND HISTORY
The company is incorporated on 08.01.1985 for manufacture of electrical installation products such as CAM operated rotary switches, switch gear products and allied products and is an ongoing concern since then. The company is listed in BSE Limited (Bombay Stock Exchange) AND National Stock Exchange Limited.
ANALYSIS OF PERFORMANCE
The revenues from the
operations were at H384 crores in full year as against INR 3610.000 million in the
corresponding year, with a 7% growth. The full year ended EBITDA stood at INR
429.300 million giving a flat growth. EBITDA (Earnings Before Interest Tax
Depreciation and Amortization) and margin was at 11.17% and remained flat as
compared to last year. The PAT (Profit After Tax) also was flat at INR 171.000
million in the full year as against INR 170.400 million in the corresponding
year. Exports for the full year contributed 18% of total revenues of the
Company.
Industrial switch gear segment
The industrial switch gear
segment is one the largest contributors to overall revenues of the Company.
This segment comprises Cam Operated Rotary Switches; Toraidal Transformers,
Relays, Load Break Switches, Wire Harness etc. The market conditions in India
as well as USA and Europe continue to be very challenging. Despite these
challenges, this division managed and posted a growth of 7% on year on year and
made 46% contribution to the total revenue of the Company. Going forward, the
Company is expecting strong recovery of the demand across the spectrum and also
foresee healthy business would come from both domestic and international
markets and also from the companies like GE, Schneider, Honeywell, ABB &
Siemens in 2017-18.
Wire and cable segment
Wire and cable segment
consisting of copper wires and cables is the second major business of the
Company. On a yearly basis, wire and cable business contributed 46% with a year
on year growth of 32%. Within this segment, the Company’s focus has been to do
brand labelling for major brands. Initially, it has been started with branding
for L&T, and today branding is being done for Crompton Greaves, Texmo,
E-Fab and a couple of other brands. In the last two years, this division has
started to focus giving value added products to various customers like elevator
travelling cables, wire harnesses, and other similar cables in the segment.
Building Product Segment
In respect of Building
Product Segment, the Company has witnessed a very robust growth although the
contribution to the total revenue remains small and exploring various options
to improve its contribution to the extent of 10% level. On a yearly basis the
building segment product contributed 6% with a year on year growth of 50%.
Energy management segment
The fourth is the energy
management segment and an order driven business. This is a new technology
oriented business which was developed by the Company’s in-house R&D team.
This product segment has given a benefit of being the largest ESCO with highest
CRISIL rating - Grade A in the country for the Company. Energy management
business, on an annual basis, contributed 2% to the total revenues with a year
on year decline of 76%. In the last year, this segment had a revenue of INR
420.000 million coming in from the EPC contract business as against which, only
H10 Crore revenue recorded in this year.
Without Energy Management
business, the company has achieved revenue growth of 17% year on year. The
EBITDA and PAT also witnessed a growth of 13% and 20% respectively. Overall,
the revenue growth has been driven by the building segment, wire and cable
segment; both of them have grown more than 30% year on year. Through their
continued association and increase in orders from their valued customers like
GE, Schneider, Honeywell and ABB, the Company has been able to achieve this
growth.
Going forward the Company’s
focus remains to achieve profitable growth by adding newer products which are
customized and value added in nature, exploring newer geographies which can
yield better margins. With a very competent team in place, the Company is quite
confident of achieving the milestone which it has set for itself.
The Company has signed a
Memorandum of Understanding with Saelzer Electric GmbH, Germany, for possible co-operation
between two companies to leverage on their inherent strengths for Joint Product
Development with cutting edge technologies and exploring Joint Marketing for
Rotary Cam Switches world-wide.
MANAGEMENT DISCUSSION AND ANALYSIS
Forward-looking statement
Statements in this
Management Discussion and Analysis of Financial Condition and Results of
Operations of the Company describing the Company’s objectives, expectations or
predictions may be forward looking within the meaning of applicable securities
laws and regulations. Forward looking statements are based on certain
assumptions and expectations of future events. The Company cannot guarantee
that these assumptions and expectations are accurate or will be realized. The
Company assumes no responsibility to publicly amend, modify or revise forward
looking statements, on the basis of any subsequent developments, information or
events.
Actual results may differ
materially from those expressed in the statement. Important factors that could
influence the Company’s operations include changes in government regulations,
tax laws, economic developments within the country and such other factors
globally. The financial statements are prepared under historical cost
convention, on accrual basis of accounting, and in accordance with the
provisions of the Companies Act, 2013 (the Act) and in compliance with the
Accounting standards as notified under section 133 of the Act read with the
Companies (Accounts) Rules 2014. The management of Salzer Electronics has used
estimates and Judgments relating to the financial statements on a prudent and
reasonable basis, in order that the financial statements reflect in a true and
fair manner, the state of affairs and profit for the year.
Global economic overview
The pace of global economic
activity waned during 2016 because of inflationary headwinds. The year was
marked by the United Kingdom’s decision to exit the European Union and the
election of Donald Trump as the American President. Within advanced economies,
comprising the US, Europe and Japan, a protracted monetary policy support and
return to fiscal neutrality underpinned a generally-accelerating output. In
countries outside the advanced economies, the sources of slower growth
comprised commodity price declines, overhangs from erstwhile credit growth and
political turmoil. Global growth stood at 3.4% in 2017 after a downward
revision of 10 bps following the April 2016 projection. Long-term prospects of
emerging market economies improved following a decline in interest rates in
advanced economies and firming commodity prices. Asian countries in general
demonstrated robust growth. Although, the currencies of advanced commodity
exporters strengthened, currencies of several emerging markets depreciated
substantially.
Outlook
The global economy entered
its sixth year of stagnation with growth estimates for 2018 continuing to trend
the historical path. A projected stabilisation in energy and commodity prices
may strengthen the case for resource-rich economies in 2018. Global economic
growth is expected to rise from 3.4% in 2017 to 3.6% in 2018, driven by an
increase in economic activities, expectations of resurgence in global demand
and reduced deflationary pressures.
Indian economic overview
During FY2016-17, the
Indian economy slowed down to 7.1% from 7.6% in FY2015-16, largely owing to the
demonetisation initiative undertaken in the third quarter of the financial
year. India’s consumer confidence index stood at 136 in Q4 2016, the highest in
the world. India retained its position as the fastest-growing major economy in
the world catalysed by strong consumption growth and enhanced government
spending. Inflation declined on account of a decline in food inflation. This
facilitated a 50 basis points rate cut by the RBI in 2016-17. A declining
vulnerability on the external and fiscal front and fiscal consolidation by the
government enhanced investor confidence that translated into record net foreign
exchange inflows. The year was also marked by the government’s demonetisation initiative
and the preparatory work related to the introduction of the GST. While the
first initiative focused on eliminating the parallel economy, the second is
expected to transform the country’s taxation structure.
Outlook
India’s outlook remains positive
with economic growth expected to rebound in the range of 6.75-7.5% in
FY2017-18. The adoption of the Goods and Service Tax promises to create a
unified taxation regime. This could enhance the efficiency of production and
movement of goods and services across India. This critical fiscal policy could
make an important contribution to raise India’s medium-term GDP growth to
>8%. The Union Budget 2017-18 laid a keen emphasis on rural infrastructural
development, which is supposed to have a cascading multi-sectoral impact.
Finally, the Central Government’s policies towards achieving fiscal
consolidation, reforming the agricultural sector and the labour market while
moderating inflation are expected to accelerate India’s economic growth over
the medium-term.
Growth of the Power Sector
Salzer has been a part of
the growth story of country’s infrastructure sector in general, and power
sector & capital goods sectors in Particular.
The infrastructure sector
is a key driver for the Indian economy. The sector is responsible for
propelling India’s overall development and enjoys intense Government focus for
initiating policies that ensure the time-bound creation of world-class
infrastructure in the country. The infrastructure sector includes power,
bridges, dams, roads and urban infrastructure development. In 2016, India
jumped 19 places in World Bank’s Logistics Performance Index (LPI) 2016 to rank
35th among 160 countries.
The Infrastructure sector
has been languishing for the last several years owing to multiple factors like
poor funding, Non-availability of the required raw materials. Players in the
infrastructure have been facing severe headwinds and struggling to report
reasonable growth.
UNSECURED LOANS:
|
PARTICULARS |
31.03.2017 INR
In Million |
31.03.2016 INR
In Million |
|
SHORT TERM
BORROWINGS |
|
|
|
From Banks |
|
|
|
Loans repayable on demand (HDFC ) |
200.000 |
150.000 |
|
|
|
|
|
Total |
200.000 |
150.000 |
STANDALONE UNAUDITED
FINANCIAL RESULTS FOR THE QUARTER AND NINE MONTHS ENDED 31ST
DECEMBER 2017
(INR In Million)
|
Particulars |
Quarter ended |
Nine Months ended |
|
|
|
31.12.2017 |
30.09.2017 |
31.12.2017 |
|
|
Unaudited |
||
|
INCOME FROM OPERATIONS |
|
|
|
|
Net Sales |
1106.953 |
1007.408 |
3265.810 |
|
Other Operating Income |
6.180 |
13.447 |
39.720 |
|
Total
Income from Operations |
1113.133 |
1020.855 |
3305.530 |
|
|
|
|
|
|
EXPENSES |
|
|
|
|
Cost of materials consumed |
818.729 |
729.343 |
2318.797 |
|
Excise Duty |
-- |
-- |
105.603 |
|
Changes in inventories of finished goods and
work-in-progress |
(9.514) |
(1.384) |
(0.575) |
|
Employee benefits expense |
46.332 |
51.448 |
144.178 |
|
Finance Costs |
35.951 |
34.809 |
110.595 |
|
Depreciation and Amortization expenses |
26.318 |
22.859 |
75.893 |
|
Other Expenditure |
116.605 |
98.948 |
329.017 |
|
Total
Expenses |
1034.421 |
936.023 |
3083.508 |
|
Profit / (Loss) before Tax |
78.712 |
84.832 |
222.022 |
|
Tax Expense |
|
|
|
|
-
Current tax |
16.579 |
17.036 |
47.075 |
|
-
Deferred tax |
9.261 |
9.665 |
23.290 |
|
Profit
/ (Loss) after Tax |
52.872 |
58.131 |
151.657 |
|
Other Comprehensive Income |
|
|
|
|
·
Items that will not be
reclassified to profit or loss |
|
|
|
|
- Remeasurement of post-employment benefit obligation |
(0.334) |
(0.334) |
(0.978) |
|
- Change in fair value of FVOCI instruments |
0.483 |
1.206 |
1.689 |
|
Profit on sale of instruments designated as FVOCI |
0.761 |
1.514 |
2.274 |
|
Income tax relating to these items |
0.116 |
0.116 |
0.338 |
|
Total other Comprehensive Income for the period,
net of tax |
1.026 |
2.502 |
3.323 |
|
Total other Comprehensive Income for the period |
53.898 |
60.633 |
154.980 |
|
Paid-up Equity Share Capital (Face value INR 10/- per
share) |
144.967 |
144.967 |
144.967 |
|
Reserves (excluding Revaluation Reserve) |
|
|
|
|
Earnings per Share (EPS) - INR |
|
|
|
|
-
Basic |
3.65 |
4.03 |
10.48 |
|
-
Diluted |
3.56 |
3.93 |
10.21 |
NOTES:
1. The above Un-audited Financial Results were reviewed by the Audit Committee at its meeting held on February 08, 2018 and subsequently approved by the Board of Directors at its meeting held on February 09, 2018.
2. In line with notification dated February 16, 2015, the Company has for the first time adopted Indian Accounting Standards ("IND AS") from April 01, 2017 with transition date as April 01, 2016. Based on SEBI Circular CIR/CFD/FAC/62/2016 dated July 05, 2016, the financial results for third quarter ended and Nine Months period ended December 31, 2017 and December 31, 2016 have been prepared in accordance with IND AS Rules as prescribed under Section 133 of the Companies Act 2013 and other recognised accounting practices and Polices to the extent applicable.
3. The Un-audited Financial Results for the Nine Months period / third Quarter ended December 31, 2017 have been subjected to "Limited Review" by Statutory Auditors of the Company. The IND AS compliant un-audited financial results for the corresponding Nine Months period / third Quarter ended December 31, 2016 have not been subjected to Limited Review or Audit. However, the Management has exercised necessary due diligence to ensure that the financial results provide a true and fair view of the affairs of the Company
4. Although not mandatory in terms of aforesaid SEBI Circular, the results in respect of previous year ended March 31, 2017 have been disclosed. These have been furnished in accordance with then prevailing Accounting Standards notified under Companies (Accounting Standards) Rules 2006 ("IGAAP") and not IND-AS Compliant. Hence, the IND -AS figures for the quarter ended December 31, 2017 and December 31, 2016 are not comparable with the figures for the quarter ended year ended March 31, 2017.
5. The format of the Un-audited Financial Results as prescribed in SEBI’s Circular No.CIR/CFD/CMD/15/2015 dated November 30, 2015 has been modified to comply with the requirements of SEBI Circular No.CIR/CFD/FAC/62/2016 dated July 05, 2016 on adoption of IND AS and in pursuance of Schedule III to the Companies Act 2013, which are applicable to the Companies that are required to comply with IND AS.
6. Revenue from operations was disclosed Gross Excise Duty till June 30, 2017. The Government of India has implemented Goods and Service Tax ("GST") from July 01, 2017 replacing Excise Duty, Service Tax and other Indirect Taxes. As per IND AS 18, the revenue for the quarter ended December 31, 2017 and September 30, 2017 are reported net of GST. Accordingly, the revenue from Operations and Excise duty expenses for the Quarter ended September 30, 2017 & December 31, 2017 and Nine Months period ended December 31, 2017 are not comparable with the previous periods.
7. The Company's Operation relates to primarily One Segment "Electrical Installation Products". Hence the results are reported under One Segment as per the IND AS-108 - "Operating Segments",
8. A statement of reconciliation of the Net Profit Reported for the quarter ended December 31, 2017 & December 31, 2016, as per IGAAP, to the total comprehensive income in accordance with IND AS as under as required under Para 2.8 of SEBI Circular No.CIR/CFD/FAC/62/2016 dated July 05, 2016.
9. Basic Earnings per share and Diluted Earnings per Share have been prepared in accordance with IND AS 33,
10. During the Nine months period ended December 31,2017, the Company allotted 1,48,500 Equity Shares against stock options exercised by the Employees under "Salzer Electronics Limited Employees Stock Option Scheme 2012-13"
11. The Figures for the Immediate Previous quarter and Year ending March 31, 2017 have been re-grouped, wherever necessary, reported under IGAAP.
INDEX OF CHARGES:
|
S No |
SRN |
Charge Id |
Charge Holder Name |
Date of Creation |
Date of Modification |
Date of Satisfaction |
Amount |
Address |
|
1 |
G48676365 |
100085541 |
HDFC BANK LIMITED |
19/10/2016 |
22/06/2017 |
- |
216800000.0 |
HDFC BANK HOUSESENAPATI BAPAT MARG LOWER PAREL W MUMBAI MH400013IN |
|
2 |
G39209705 |
100085542 |
HDFC BANK LIMITED |
19/10/2016 |
- |
- |
50000000.0 |
HDFC BANK HOUSESENAPATI BAPAT MARG LOWER PAREL W MUMBAI MH400013IN |
|
3 |
G14180871 |
10515869 |
CITI BANK N.A. |
27/05/2014 |
18/07/2016 |
- |
55000000.0 |
TRISTAR TOWERS, AVINASHI ROADPLOT NO. 657 COIMBATORE TN641037IN |
|
4 |
G13641923 |
10459059 |
CITI BANK N.A. |
13/11/2013 |
20/09/2016 |
- |
435000000.0 |
TRISTAR TOWERS, AVINASHI ROADPLOT NO. 657 COIMBATORE TN641037IN |
|
5 |
G36521201 |
10078110 |
UNION BANK OF INDIA |
29/11/2007 |
03/02/2017 |
- |
482700000.0 |
COIMBATORE MAIN BRANCH, 235, OPPANAKARA STREET, POST BOX NO.8, COIMBATORE TN641001IN |
|
6 |
A46010062 |
10057783 |
UNION BANK OF INDIA LIMITED |
06/06/2007 |
25/08/2008 |
- |
130000000.0 |
COIMBATORE MAIN BRANCH239,OPPANNAKARA STREET, COIMBATORE TN641001IN |
|
7 |
Y10081910 |
90002832 |
ANZ GRINDLAYS BANK PLC |
21/09/1995 |
- |
- |
2466792.0 |
GRINDLAYS GARDENNO.1; HADDOWS ROAD MADRAS TN600006IN |
|
8 |
C69797694 |
90002214 |
CANARA BANK |
05/06/1986 |
16/11/2015 |
- |
692500000.0 |
MID CORPORATE BRANCH, 16& 18., EAST AROKIA SWAMY ROAD, R S PURAM COIMBATORE TN641002IN |
|
9 |
G34551739 |
10172839 |
CITI BANK N.A. |
06/08/2009 |
14/05/2015 |
25/01/2017 |
60000000.0 |
TRISTAR TOWERS, AVINASHI ROAD, PLOT NO. 657, COIMBATORE TN641037IN |
|
10 |
G34552141 |
10500660 |
CITI BANK N.A. |
16/05/2014 |
14/05/2015 |
25/01/2017 |
10000000.0 |
TRISTAR TOWERS, AVINASHI ROAD, PLOT NO. 657, COIMBATORE TN641037IN |
FIXED ASSETS:
· Land
· Building
· Plant and Machinery
· Windmill
· Electrical Machinery (Solar)
· Furniture and Fixtures
· Vehicles
· Software
CMT REPORT (Corruption, Money Laundering & Terrorism]
The Public Notice information has been collected from various sources
including but not limited to: The Courts,
1] INFORMATION ON
DESIGNATED PARTY
No records exist designating subject or any of its beneficial owners,
controlling shareholders or senior officers as terrorist or terrorist
organization or whom notice had been received that all financial transactions
involving their assets have been blocked or convicted, found guilty or against
whom a judgement or order had been entered in a proceedings for violating
money-laundering, anti-corruption or bribery or international economic or
anti-terrorism sanction laws or whose assets were seized, blocked, frozen or
ordered forfeited for violation of money laundering or international
anti-terrorism laws.
2] Court Declaration :
No records exist to suggest that subject is
or was the subject of any formal or informal allegations, prosecutions or other
official proceeding for making any prohibited payments or other improper
payments to government officials for engaging in prohibited transactions or
with designated parties.
3] Asset Declaration :
No records exist to suggest that the property or assets of the subject
are derived from criminal conduct or a prohibited transaction.
4] Record on Financial
Crime :
Charges or conviction
registered against subject: None
5] Records on Violation of
Anti-Corruption Laws :
Charges or
investigation registered against subject: None
6] Records on Int’l
Anti-Money Laundering Laws/Standards :
Charges or
investigation registered against subject: None
7] Criminal Records
No
available information exist that suggest that subject or any of its principals
have been formally charged or convicted by a competent governmental authority
for any financial crime or under any formal investigation by a competent
government authority for any violation of anti-corruption laws or international
anti-money laundering laws or standard.
8] Affiliation with
Government :
No record
exists to suggest that any director or indirect owners, controlling
shareholders, director, officer or employee of the company is a government official
or a family member or close business associate of a Government official.
9] Compensation Package :
Our market
survey revealed that the amount of compensation sought by the subject is fair
and reasonable and comparable to compensation paid to others for similar
services.
10] Press Report :
No press reports / filings exists on
the subject.
CORPORATE GOVERNANCE
MIRA INFORM as part of its Due Diligence do provide comments on Corporate
Governance to identify management and governance. These factors often have been
predictive and in some cases have created vulnerabilities to credit
deterioration.
Our Governance Assessment focuses principally on the interactions
between a company’s management, its Board of Directors, Shareholders and other
financial stakeholders.
CONTRAVENTION
Subject is not known to have contravened any existing local laws,
regulations or policies that prohibit, restrict or otherwise affect the terms
and conditions that could be included in the agreement with the subject.
FOREIGN EXCHANGE RATES
|
Currency |
Unit
|
INR |
|
US Dollar |
1 |
INR 68.26 |
|
|
1 |
INR 91.22 |
|
Euro |
1 |
INR 79.88 |
INFORMATION DETAILS
|
Information
Gathered by : |
PRT |
|
|
|
|
Analysis Done by
: |
NYT |
|
|
|
|
Report Prepared
by : |
NKT |
SCORE FACTORS
|
DEMERIT POINTS |
|
|
|
--BANK CHARGES |
YES/NO |
YES |
|
--LITIGATION |
YES/NO |
NO |
|
--OTHER ADVERSE INFORMATION |
YES/NO |
NO |
|
MERIT POINTS |
|
|
|
--SOLE DISTRIBUTORSHIP |
YES/NO |
NO |
|
--EXPORT ACTIVITIES |
YES/NO |
NO |
|
--AFFILIATION |
YES/NO |
YES |
|
--LISTED |
YES/NO |
YES |
|
--OTHER MERIT FACTORS |
YES/NO |
YES |
RATING EXPLANATIONS
|
Credit Rating |
Explanation |
Rating Comments |
|
A++ |
Minimum Risk |
Business dealings permissible with minimum
risk of default |
|
A+ |
Low Risk |
Business dealings permissible with low
risk of default |
|
A |
Acceptable Risk |
Business dealings permissible with
moderate risk of default |
|
B |
Medium Risk |
Business dealings permissible on a regular
monitoring basis |
|
C |
Medium High Risk |
Business dealings permissible preferably
on secured basis |
|
D |
High Risk |
Business dealing not recommended or on
secured terms only |
|
NB |
New Business |
No recommendation can be done due to
business in infancy stage |
|
NT |
No Trace |
No recommendation can be done as the
business is not traceable |
NB is stated where there is insufficient information to facilitate rating. However, it is not to be considered as unfavourable.
This score serves as a reference to assess
SC’s credit risk and to set the amount of credit to be extended. It is
calculated from a composite of weighted scores obtained from each of the major
sections of this report. The assessed factors are as follows:
·
Financial
condition covering various ratios
·
Company
background and operations size
·
Promoters
/ Management background
·
Payment
record
·
Litigation
against the subject
·
Industry
scenario / competitor analysis
·
Supplier
/ Customer / Banker review (wherever available)
This report is issued at
your request without any risk and responsibility on the part of MIRA INFORM
PRIVATE LIMITED (MIPL) or its officials.